Customers urged to control bills through budget billing, conservation

By PR Newswire


CSA Z463 Electrical Maintenance

Our customized live online or in‑person group training can be delivered to your staff at your location.

  • Live Online
  • 6 hours Instructor-led
  • Group Training Available
Regular Price:
$249
Coupon Price:
$199
Reserve Your Seat Today
The Ameren Illinois Utilities are encouraging customers to use energy wisely and to take advantage of their Budget Billing plan to eliminate billing surprises by spreading energy costs evenly over several months.

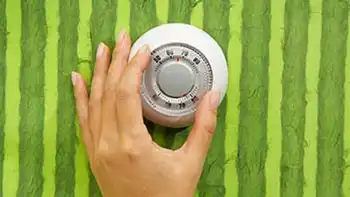
"We encourage our customers to use simple, proven energy conservation practices that will help them spend less by using less without sacrificing personal comfort," said Sean Vanslyke, manager of Community and Public Relations for the Ameren Illinois Utilities.

"For example, with the return of standard time most of us are using more indoor lighting. Customers can save up to $100 a year by replacing 20 standard incandescent bulbs with compact fluorescent lights or CFLs. Customers can save even more with a special offer at http://www.actonenergy.com that reduces the purchase price of CFLs," Vanslyke said.

The Budget Billing plan allows residential customers to pay the same amount each month. By enrolling now, customers can begin leveling out their monthly payments. The plan allows customers to pay an average monthly bill amount based on the last 12 months of usage.

The payment level is periodically reviewed and adjusted as necessary. On the 12th month, the account is reviewed to calculate the difference between the amount of energy used during the year and the amount paid under Budget Billing. If the amount paid exceeds the actual cost of providing the energy, the customer receives a credit. If the amount billed is less than the actual cost of providing the energy, the customer is billed for the difference.

"Budget Billing helps eliminate those seasonal variations in utility bills with a regular and predictable payment," Vanslyke said. "Plus, many of our customers save time and money by combining Budget Billing with one of our automated billing plans."

Customers may enroll in Budget Billing and get information about automated billing options by visiting Ameren's Web site (http://www.ameren.com) or by calling their Ameren Illinois Utilities company (AmerenCIPS: 1-888-789-2477, AmerenCILCO: 1-888-672-5252, and AmerenIP: 1-800-755-5000). Customers may enroll in the program or drop out at any time. There is no cost to enroll in Budget Billing.

To save money through conservation and energy efficiency, customers should visit the Ameren Illinois Utilities' Act On Energy Web site (http://www.actonenergy.net), where electric customers can purchase CFLs for as little as $1 each. Customers also can order bulbs by calling 1-866-807-1317. Electric customers can choose from 14 specially priced CFLs, ranging from mini-bulbs to globes. There are even three-way and dimmable CFLs, and outdoor CFLs designed to deter bugs.

Now also is a good time to take steps that can reduce heating bills. A good place to begin is by using caulk and weather stripping to block drafts. Furnaces and flues should be inspected and cleaned annually by a heating system professional.

Another way to save money is by setting the water heater temperature at 120 degrees Fahrenheit or on "low." Using this setting can reduce annual energy costs by 3 to 5 percent. When away from home for an extended period of time, select the "vacation" setting if the unit is so equipped.

Hot water usage can be reduced by using cold or warm water in the washing machine, a step that saves money and can extend the life of clothing. Get more life out of the water heater and reduce energy costs by periodically draining the tank to eliminate the buildup of sediment.

The Ameren Illinois Utilities deliver electricity and natural gas and do not mark up the energy supply costs for electricity or natural gas. The cost of energy combined with taxes may compose up to 70 percent of a residential customer's utility bill.

Related News

New Power Grid “Report Card” Reveal Dangerous Vulnerabilities

U.S. Power Grid D+ Rating underscores aging infrastructure, rising outages, cyber threats, EMP and solar flare risks, strained transmission lines, vulnerable transformers, and slow permitting, amplifying reliability concerns and resilience needs across national energy systems.


Key Points

ASCE's D+ grade flags aging infrastructure, rising outages, and cyber, EMP, and weather risks needing investment.

✅ Major outages rising; weather remains top disruption driver.

✅ Aging transformers, transmission lines, limited maintenance.

✅ Cybersecurity gaps via smart grid, EV charging, SCADA.


The U.S. power grid just received its “grade card” from the American Society of Civil Engineers (ASCE) and it barely passed.

The overall rating of our antiquated electrical system was a D+. Major power outages in the United States, including widespread blackouts, have grown from 76 in 2007 to 307 in 2011, according to the latest available statistics. The major outage figures do not take into account all of the smaller outages which routinely occur due to seasonal storms.

The American Society of Civil Engineers power grid grade card rating means the energy infrastructure is in “poor to fair condition and mostly below standard, with many elements approaching the end of their service life.” It further means a “large portion of the system exhibits significant deterioration” with a “strong risk of failure.”

Such a designation is not reassuring and validates those who purchased solar generators over the past several years.

#google#

The vulnerable state of the power grid gets very little play by mainstream media outlets. Concerns about a solar flare or an electromagnetic pulse (EMP) attack instantly sending us back to an 1800s existence are legitimate, but it may not take such an extreme act to render the power grid a useless tangle of wires. The majority of the United States’ infrastructure and public systems evaluated by the ASCE earned a “D” rating. A “C” ranking (public parks, rail and bridges) was the highest grade earned. It would take a total of $3.6 trillion in investments by 2020 to fix everything, the report card stated. To put that number in perspective, the federal government’s budget for all of 2012 was slightly more, $3.7 trillion.

“America relies on an aging electrical grid and pipeline distribution systems, some of which originated in the 1880s,” the report read. “Investment in power transmission has increased since 2005, but ongoing permitting issues, weather events, including summer blackouts that strain local systems, and limited maintenance have contributed to an increasing number of failures and power interruptions. While demand for electricity has remained level, the availability of energy in the form of electricity, natural gas, and oil will become a greater challenge after 2020 as the population increases. Although about 17,000 miles of additional high-voltage transmission lines and significant oil and gas pipelines are planned over the next five years, permitting and siting issues threaten their completion. The electric grid in the United States consists of a system of interconnected power generation, transmission facilities, and distribution facilities.”


Harness the power of the sun when the power goes out…

There are approximately 400,000 miles of electrical transmission lines throughout the United States, and thousands of power generating plants dot the landscape. The ASCE report card also stated that new gas-fired and renewable generation issues increase the need to add new transmission lines. Antiquated power grid equipment has reportedly prompted even more “intermittent” power outages in recent years.

The American Society of Civil Engineers accurately notes that the power grid is more vulnerable to cyber attacks than ever before, including Russian intrusions documented in recent years, and it cites the aging electrical system as the primary culprit. Although the decades-old transformers and other equipment necessary to keep power flowing around America are a major factor in the enhanced vulnerability of the power grid, moving towards a “smart grid” system is not the answer. As previously reported by Off The Grid News, smart grid systems and even electric car charging stations make the power grid more accessible to cyber hackers. During the Hack in the Box Conference in Amsterdam, HP ArcSight Product Manager Ofer Sheaf stated that electric car charging stations are in essence a computer on the street. The roadway fueling stations are linked to the power grid electrical system. If cyber hackers garner access to the power grid via the charging stations, they could stop the flow of power to a specific area or alter energy distribution levels and overload the system.

While a relatively small number of electric car charging stations exist in America now, that soon will change. Ongoing efforts by both federal and state governments to reduce our reliance on fossil fuels have resulted in grants and privately funded vehicle charging station projects. New York Governor Andrew Cuomo in April announced plans to build 360 such electrical stations in his state. A total of 3,000 car charging stations are in the works statewide and are slated for completion over the next five years.

SHIELD ActWeather-related events were the primary cause of power outages from 2007 to 2012, according to the infrastructure report card. Power grid reliability issues are emerging as the greatest threat to the electrical system, with rising attacks on substations compounding the risks. The ASCE grade card also notes that retiring and rotating in “new energy sources” is a “complex” process. Like most items we routinely purchase in our daily lives, many of the components needed to make the power grid functional are not manufactured in the United States.

The SHIELD Act is the first real piece of federal legislation in years drafted to address power grid vulnerabilities. While the single bill will not fix all of the electrical system issues, it is a big step in the right direction – if it ever makes it out of committee. Replacing aging transformers, encasing them in a high-tech version of a Faraday cage, and stockpiling extra units so instant repairs are possible would help preserve one of the nation’s most critical and life-saving pieces of infrastructure after a weather-related incident or man-made disaster.

“Geomagnetic storm environments can develop instantaneously over large geographic footprints,” solar geomagnetic researcher John Kappenman said about the fragile state of the power grid. He was quoted in an Oak Ridge National Laboratory report. “They have the ability to essentially blanket the continent with an intense threat environment and … produce significant collateral damage to critical infrastructures. In contrast to well-conceived design standards that have been successfully applied for more conventional threats, no comprehensive design criteria have ever been considered to check the impact of the geomagnetic storm environments. The design actions that have occurred over many decades have greatly escalated the dangers posed by these storm threats for this critical infrastructure.”

The power grid has morphed in size tenfold during the past 50 years. While solar flares, cyber attacks, and an EMP are perhaps the most extensive and frightening threats to the electrical system, the infrastructure could just as easily fail in large portions due to weather-related events exacerbated by climate change across regions. The power grid is basically a ticking time bomb which will spawn civil unrest, lack of food, clean water, and a multitude of fires if it does go down.


Related News

View more

Clean B.C. is quietly using coal and gas power from out of province

BC Hydro Electricity Imports shape CleanBC claims as Powerex trades cross-border electricity, blending hydro with coal and gas supplies, affecting emissions, grid carbon intensity, and how electric vehicles and households assess "clean" power.


Key Points

Powerex buys power for BC Hydro, mixing hydro with coal and gas, shifting emissions and affecting CleanBC targets.

✅ Powerex trades optimize price, not carbon intensity

✅ Imports can include coal- and gas-fired generation

✅ Emissions affect EV and CleanBC decarbonization claims


British Columbians naturally assume they’re using clean power when they fire up holiday lights, juice up a cell phone or plug in a shiny new electric car. 

That’s the message conveyed in advertisements for the CleanBC initiative launched by the NDP government, amid indications that residents are split on going nuclear according to a survey, which has spent $3.17 million on a CleanBC “information campaign,” including almost $570,000 for focus group testing and telephone town halls, according to the B.C. finance ministry.

“We’ll reduce air pollution by shifting to clean B.C. energy,” say the CleanBC ads, which feature scenic photos of hydro reservoirs. “CleanBC: Our Nature. Our Power. Our Future.” 

Yet despite all the bumph, British Columbians have no way of knowing if the electricity they use comes from a coal-fired plant in Alberta or Wyoming, a nuclear plant in Washington, a gas-fired plant in California or a hydro dam in B.C. 

Here’s why. 

BC Hydro’s wholly-owned corporate subsidiary, Powerex Corp., exports B.C. power when prices are high and imports power from other jurisdictions when prices are low. 

In 2018, for instance, B.C. imported more electricity than it exported — not because B.C. has a power shortage (it has a growing surplus due to the recent spate of mill closures and the commissioning of two new generating stations in B.C.) but because Powerex reaps bigger profits when BC Hydro slows down generators to import cheaper power, especially at night.

“B.C. buys its power from outside B.C., which we would argue is not clean,” says Martin Mullany, interim executive director for Clean Energy BC. 

“A good chunk of the electricity we use is imported,” Mullany says. “In reality we are trading for brown power” — meaning power generated from conventional ‘dirty’ sources such as coal and gas. 

Wyoming, which generates almost 90 per cent of its power from coal, was among the 12 U.S. states that exported power to B.C. last year. (Notably, B.C. did not export any electricity to Wyoming in 2018.)

Utah, where coal-fired power plants produce 70 per cent of the state’s energy amid debate over the costs of scrapping coal-fired electricity, and Montana, which derives about 55 per cent of its power from coal, also exported power to B.C. last year. 

So did Nebraska, which gets 63 per cent of its power from coal, 15 per cent from nuclear plants, 14 per cent from wind and three per cent from natural gas.   

Coal is responsible for about 23 per cent of the power generated in Arizona, another exporter to B.C., while gas produces about 44 per cent of the electricity in that state.  

In 2017, the latest year for which statistics are available, electricity imports to B.C. totalled just over 1.2 million tonnes of carbon dioxide emissions, according to the B.C. environment ministry — roughly the equivalent of putting 255,000 new cars on the road, using the U.S. Environmental Protection Agency’s calculation of 4.71 tonnes of annual carbon emissions for a standard passenger vehicle. 

These figures far outstrip the estimated local and upstream emissions from the contested Woodfibre LNG plant in Squamish that is expected to release annual emissions equivalent to 170,000 new cars on the road.

Import emissions cast a new light on B.C.’s latest “milestone” announcement that 30,000 electric cars are now among 3.7 million registered vehicles in the province.

BC Electric Vehicles Announcement Horgan Heyman Mungall Weaver
In November of 2018 the province announced a new target to have all new light-duty cars and trucks sold to be zero-emission vehicles by the year 2040. Photo: Province of B.C. / Flickr

“Making sure more of the vehicles driven in the province are powered by BC Hydro’s clean electricity is one of the most important steps to reduce [carbon] pollution,” said the November 28 release from the energy ministry, noting that electrification has prompted a first call for power in 15 years from BC Hydro.

Mullany points out that Powerex’s priority is to make money for the province and not to reduce emissions.

“It’s not there for the cleanest outcome,” he said. “At some time we have to step up to say it’s either the money or the clean power, which is more important to us?”

Electricity bought and sold by little-known, unregulated Powerex
These transactions are money-makers for Powerex, an opaque entity that is exempt from B.C.’s freedom of information laws. 

Little detailed information is available to the public about the dealings of Powerex, which is overseen by a board of directors comprised of BC Hydro board members and BC Hydro CEO and president Chris O’Reilly. 

According to BC Hydro’s annual service plan, Powerex’s net income ranged from $59 million to $436 million from 2014 to 2018. 

“We will never know the true picture. It’s a black box.” 

Powerex’s CEO Tom Bechard — the highest paid public servant in the province — took home $939,000 in pay and benefits last year, earning $430,000 of his executive compensation through a bonus and holdback based on his individual and company performance.  

“The problem is that all of the trade goes on at Powerex and Powerex is an unregulated entity,” Mullany says. 

“We will never know the true picture. It’s a black box.” 

In 2018, Powerex exported 8.7 million megawatt hours of electricity to the U.S. for a total value of almost $570 million, according to data from the Canada Energy Regulator. That same year, Powerex imported 9.6 million megawatt hours of electricity from the U.S. for almost $360 million. 

Powerex sold B.C.’s publicly subsidized power for an average of $87 per megawatt hour in 2018, according to the Canada Energy Regulator. It imported electricity for an average of $58 per megawatt hour that year. 

In an emailed statement in response to questions from The Narwhal, BC Hydro said “there can be a need to import some power to meet our electricity needs” due to dam reservoir fluctuations during the year and from year to year.

‘Impossible’ to determine if electricity is from coal or wind power
Emissions associated with electricity imports are on average “significantly lower than the emissions of a natural gas generating plant because we mostly import electricity from hydro generation and, increasingly, power produced from wind and solar,” BC Hydro claimed in its statement. 

But U.S. energy economist Robert McCullough says there’s no way to distinguish gas and coal-fired U.S. power exports to B.C. from wind or hydro power, noting that “electrons lack labels.” 

Similarly, when B.C. imports power from Alberta, where generators are shifting to gas and 48.5 per cent of electricity production is coal-fired and 38 per cent comes from natural gas, there’s no way to tell if the electricity is from coal, wind or gas, McCullough says.

“It really is impossible to make that determination.” 

Wyoming Gilette coal pits NASA
The Gillette coal pits in Wyoming, one of the largest coal-producers in the U.S. Photo: NASA Earth Observatory

Neither the Canada Energy Regulator nor Statistics Canada could provide annual data on electricity imports and exports between B.C. and Alberta. 

But you can watch imports and exports in real time on this handy Alberta website, which also lists Alberta’s power sources. 

In 2018, California, Washington and Oregon supplied considerably more power to B.C. than other states, according to data from Canada Energy Regulator. 

Washington, where about one-quarter of generated power comes from fossil fuels, led the pack, with more than $339 million in electricity exports to B.C. 

California, which still gets more than half of its power from gas-fired plants even though it leads the U.S. in renewable energy with substantial investments in wind, solar and geothermal, was in second place, selling about $18.4 million worth of power to B.C. 

And Oregon, which produces about 43 per cent of its power from natural gas and six per cent from coal, exported about $6.2 million worth of electricity to B.C. last year. 

By comparison, Nebraska’s power exports to B.C. totalled about $1.6 million, Montana’s added up to $1.3 million,  Nevada’s were about $706,000 and Wyoming’s were about $346,000.

Clean electrons or dirty electrons?
Dan Woynillowicz, deputy director of Clean Energy Canada, which co-chaired the B.C. government’s Climate Solutions and Clean Growth Advisory Council, says B.C. typically exports power to other jurisdictions during peak demand. 

Gas-fired plants and hydro power can generate electricity quickly, while coal-fired power plants take longer to ramp up and wind power is variable, Woynillowicz notes. 

“When you need power fast and there aren’t many sources that can supply it you’re willing to pay more for it.”

Woynillowicz says “the odds are high” that B.C. power exports are displacing dirty power.

Elsewhere in Canada, analysts warn that Ontario's electricity could get dirtier as policies change, raising similar concerns.

“As a consumer you never know whether you’re getting a clean electron or a dirty electron. You’re just getting an electron.” 


Related News

View more

Clean energy jobs energize Pennsylvania: Clean Energy Employment Report

Pennsylvania Clean Energy Employment surges, highlighting workforce growth in energy efficiency, solar, wind, grid and storage, and alternative transportation, supporting COVID-19 recovery, high-wage jobs, manufacturing, construction, and statewide economic resilience.


Key Points

Jobs across clean power, efficiency, grid, storage, and advanced transport fueling Pennsylvania's workforce growth.

✅ 8.7% job growth from 2017-2019, outpacing statewide average

✅ 97,000+ employed across efficiency, solar, wind, grid, and fuels

✅ 75% earn above median; strong full-time opportunities


The 2020 Pennsylvania Clean Energy Employment Report has been released, and Gov. Tom Wolf is energized by it.

This "comes at an opportune time, as government and industry leaders look to strengthen Pennsylvania's workforce and economy in response to the challenges of the COVID-19 pandemic," Wolf said Monday in a prepared statement. "This detailed analysis of data and trends in clean energy employment ... demonstrates the sector was a top job generator statewide, and shows which industries were hiring and looking for trained workers."

Foremost among the findings, released Monday, is that the clean energy sector was responsible for adding 7,794 jobs from 2017 through 2019. That is an 8.7% average job growth rate, well above the 1.9% overall average in the state, according to a news release from Wolf's office.

This report lists employment data in five industries: energy efficiency; clean energy generation; alternative transportation; clean grid and storage; and clean fuels, while some cleaner states still import dirty electricity in regional markets.

The energy efficiency industry was the biggest clean energy employer in the state last year, with more than 71,400 state residents working in construction, technology and manufacturing jobs related to energy-efficient systems.

Solar energy workers comprised the largest share of the clean energy generation workforce – 35.4%, or 5,173 individuals. Solar employment increased 8.3% from 2017 to 2019, while there was a slight decline nationwide amid clean energy job losses reported in May.

Wind energy firms employed 2,937, and policy moves such as Ontario's clean electricity regulations signal broader market shifts, with more than 21% of those roles in manufacturing.

Job losses, though, were recorded in nuclear generation (minus 4.5%) and coal generation (minus 8.6%) over the two-year period, as electricity deregulation remains a point of debate in the sector. This mirrors national declines in both categories.

Federal efforts to support coal community revitalization are channeling clean energy projects to hard-hit regions.

Natural gas electric generation capacity doubled across Pennsylvania over the past decade; even as residents could face winter electricity price increases according to recent reports, employment still grew 13.4% from 2017 through 2019. But increasing output from unconventional wells has outpaced demand, sparking reductions in siting and drilling for new wells.

The Clean Energy Employment Report was released along with – and as part of – the 2020 Pennsylvania Energy Employment Report, which asserts that energy remains a large employer in the state, and new clean energy funding announcements underscore the sector's momentum. As of the last quarter of 2019, according to the larger report, energy accounted for 269,031 jobs, or 4.5% of the overall statewide workforce.

Wolf, in summary, said: "This report shows that workforce training investment decisions can benefit Pennsylvanians right now and position the state going forward to grow and improve livelihoods, the economy and our environment."


Related News

View more

Electricity Shut-Offs in a Pandemic: How COVID-19 Leads to Energy Insecurity, Burdensome Bills

COVID-19 Energy Burden drives higher electricity bills as income falls, intensifying energy poverty, utility shut-offs, and affordability risks for low-income households; policy moratoriums, bill relief, and efficiency upgrades are vital responses.


Key Points

The COVID-19 energy burden is the rising share of income spent on energy as bills increase and earnings decline.

✅ Rising home demand and lost wages increase energy cost share.

✅ Mandated shut-off moratoriums and reconnections protect health.

✅ Fund assistance, efficiency, and solar for LMI households.


I have asthma. It’s a private piece of medical information that I don’t normally share with people, but it makes the potential risks associated with exposure to the coronavirus all the more dangerous for me. But I’m not alone. 107 million people in the U.S. have pre-existing medical conditions like asthma and heart disease; the same pre-existing conditions that elevate their risk of facing a life-threatening situation were we to contract COVID-19. There are, however, tens of millions more house-bound Americans with a condition that is likely to be exacerbated by COVID-19: The energy burden.

The energy burden is a different kind of pre-existing condition:
In the last four weeks, 22 million people filed for unemployment. Millions of people will not have steady income (or the healthcare tied to it) to pay rent and utility bills for the foreseeable future which means that thousands, possibly millions of home-bound Americans will struggle to pay for energy.

Your energy burden is the amount of your monthly income that goes to paying for energy, like your monthly electric bill. So, when household energy use increases or income decreases, your energy burden rises. The energy burden is not a symptom of the pandemic and the economic downturn; it is more like a pre-existing condition for many Americans.

Before the coronavirus outbreak, I shared a few maps that showed how expensive electricity is for some. The energy burden in most pronounced in places already struggling economically, like in Appalachia, where residents in some counties must put more than 30 percent of their income toward their electric bills, and in the Midwest where states such as Michigan have some families spending more than 1/5 of their income on energy bills. The tragic facts are that US families living below the poverty line are far more likely to also be suffering from their energy burden.

But like other pre-existing conditions, the impacts of the coronavirus pandemic are exacerbating the underlying problems afflicting communities across the country.

Critical responses to minimize the spread of COVID-19 are social distancing, washing hands frequently, covering our faces with masks and staying at home. More time at home for most will drive up energy bills, and not by a little. Estimates on how much electricity demand during COVID-19 will increase vary but I’ve seen estimates as high as a 20% increase on average. For some families that’s a bag of groceries or a refill on prescription medication.

What happens when the power gets turned off?
Under normal conditions, if you cannot pay your electric bill your electricity can get turned off. This can have devastating consequences. Most states have protections for health and medical reasons and some states have protections during extreme heat or cold weather. But enforcement of those protections can vary by utility service area and place unnecessary burdens on the customer.

UCS
Only Florida has no protections of any kind against utility shut-offs when health or medical reasons would merit protection against it. However, when it comes to protection against extreme heat, only a few states have mandatory protections based on temperature thresholds.

The NAACP has also pointed out that utilities have unceremoniously disconnected the power of millions of people, disproportionally African-American and Latinx households.

April tends to be a mild month for most of the country, but the South already had its first heat wave at the end of March. If this pandemic lasts into the summer, utility disconnects could become deadly, and efforts to prevent summer power outages will be even more critical to public health. In the summer, during extreme summer heat families can’t turn off the A/C and go to the movies if we are following public health measures and sheltering in place. Lots of families that don’t have or can’t afford to run A/C would otherwise gather at local community pools, beaches, or in cooling centers, but with parks, pools and community groups closed to prevent the virus’s spread, what will happen to these families in July or August?

But we won’t have to wait till the summer to see how families will be hard hit by falling behind on bills and losing power. Here are a few ways electricity disconnection policies cause people harm during the pandemic:

Loss of electricity during the COVID-19 pandemic means families will lose their ability to refrigerate essential food supplies.
Child abuse guidance discusses how unsanitary household conditions are a contributing factor to child protective services involvement. Unsanitary household conditions can include, for example, rotting food (which might happen if electricity is cut off).

HUD’s handbook on federally subsidized housing includes a chapter on termination, which says that lease agreements can be terminated for repeated minor infractions including failing to pay utilities.
Airway machines used to treat respiratory ailments—pre-existing conditions in this pandemic—will not work. Our elderly neighbors in particular might rely on medicine that requires refrigeration or medical equipment that requires electricity. They too have fallen victim to utility shut-offs even during the pandemic.

Empowering solutions are available today

Decisionmakers seeking solutions can look to implement utility shut off moratoriums as a good start. Good news is that many utilities have voluntarily taken action to that effect, and New Jersey and New York have suspended shut-offs, one of the best trackers on who is taking what action has been assembled by Energy Policy Institute.

But voluntary actions do not always provide comprehensive protection, and they certainly have not been universally adopted across the country. Some utilities are waiving fees as relief measures, and some moratoriums only apply to customers directly affected by COVID-19, which will place additional onerous red tape on households that are stricken and perhaps unable to access testing. Others might only be an extension of standard medical shut off protections. Moratoriums put in place by voluntary action can also be revoked or lifted by voluntary action, which does not provide any sense of certainty to people struggling to make ends meet.

This is why the US needs mandatory moratoriums on all utility disconnections. These normally would be rendered at the state level, either by a regulatory commission, legislative act, or even an emergency executive order. But the inconsistent leadership among states in response to the COVID-19 crisis suggests that Congressional action is needed to ensure that all vulnerable utility customers are protected. That’s exactly what a coalition of organizations, including UCS, is calling for in future federal aid legislation. UCS has called for a national moratorium on utility shut-offs.

And let’s be clear, preventing new shut-offs isn’t enough. Cutting power off at residence during a pandemic is not good public policy. People who are without electricity should have it restored so residents can safely shelter in place and help flatten the curve. So far, only Colorado and Wisconsin’s leadership has taken this option.

Addressing the root causes of energy poverty
Preventing shut-offs is a good first step, but the increased bill charges will nevertheless place greater economic pressure on an incalculable number of families. Addressing the root of the problem (energy affordability) must be prioritized when we begin to recover from the health and economic ramifications of the COVID-19 pandemic.

One way policymakers can do that is to forgive outstanding balances on utility bills, perhaps with an eligibility cap based on income. Additional funds could be made available to those who are still struggling to pay their bills via capping bills, waiving late payment fees, automating payment plans or other protective measures that rightfully place consumers (particularly vulnerable consumers) at the center of any energy-related COVID-19 response. Low-and-moderate-income energy efficiency and solar programs should be funded as much as practically possible.

New infrastructure, particularly new construction that is slated for public housing, subsidized housing, or housing specifically marketed for low- and moderate-income families, should include smart thermostats, better insulation, and energy-efficient appliances.

Implementing these solutions may seem daunting, let us not forget that one of the best ways to ease people’s energy burden is to keep a utility’s overall energy costs low. That means state utility commissions must be vigilant in utility rate cases and fuel recovery cost dockets to protect people facing unfathomable economic pressures. Unscrupulous utilities have been known to hide unnecessary costs in our energy bills. Commissions and their staff are overwhelmed at this time, but they should be applying extra scrutiny during proceedings when utilities are recovering costs associated with delivering energy.

What might a utility try to get past the commission?
Well, residential demand is up, so for many people, bills will increase. However, wholesale electricity rates are low right now, in some cases at all-time lows. Why? Because industrial and commercial demand reductions (from social distancing at home) have more than offset residential demand increases. Overall US electricity demand is flat or declining, and supply/demand economics predicts that when demand decreases, prices decrease.

At the same time, natural gas prices have set record lows each month of this year and that’s a trend that is expected to hold true for a while.

Low demand plus low gas prices mean wholesale market prices are incredibly low. Utilities should be taking advantage of low market prices to ensure that they deliver electricity to customers at as low a cost as possible. Utilities must also NOT over-run coal plants uneconomically or lean on aging capacity despite disruptions in coal and nuclear that can invite brownouts because that will not only needlessly cost customers more, but it will also increase air pollution which will exacerbate respiratory issues and susceptibility to COVID-19, according to a recent study published by Harvard.


Related News

View more

U.S. renewable electricity surpassed coal in 2022

2022 US Renewable Power Milestone highlights EIA data: wind and solar outpaced coal and nuclear, hydropower contributed, with falling levelized costs, grid integration, battery storage, and transmission upgrades shaping affordable, reliable clean power growth.


Key Points

The year US renewables, led by wind and solar, generated more power than coal and nuclear, per EIA.

✅ Wind and solar rose; levelized costs fell 70%-90% over decade

✅ Renewables surpassed coal and nuclear in 2022 per EIA

✅ Grid needs storage and transmission to manage intermittency


Electricity generated from renewables surpassed coal in the United States for the first time in 2022, as wind and solar surpassed coal nationwide, the U.S. Energy Information Administration has announced.

Renewables also surpassed nuclear generation in 2022 after first doing so last year, and wind and solar together generated more electricity than nuclear for the first time in the United States.

Growth in wind and solar significantly drove the increase in renewable energy and contributed 14% of the electricity produced domestically in 2022, with solar producing about 4.7% of U.S. power overall. Hydropower contributed 6%, and biomass and geothermal sources generated less than 1%.

“I’m happy to see we’ve crossed that threshold, but that is only a step in what has to be a very rapid and much cheaper journey,” said Stephen Porder, a professor of ecology and assistant provost for sustainability at Brown University.

California produced 26% of the national utility-scale solar electricity followed by Texas with 16% and North Carolina with 8%.

The most wind generation occurred in Texas, which accounted for 26% of the U.S. total, while wind is now the most-used renewable electricity source nationwide, followed by Iowa (10%) and Oklahoma (9%).

“This booming growth is driven largely by economics,” said Gregory Wetstone, president and CEO of the American Council on Renewable Energy, as renewables became the second-most prevalent U.S. electricity source in 2020 nationwide. “Over the past decade, the levelized cost of wind energy declined by 70 percent, while the levelized cost of solar power has declined by an even more impressive 90 percent.”

“Renewable energy is now the most affordable source of new electricity in much of the country,” added Wetstone.

The Energy Information Administration projected that the wind share of the U.S. electricity generation mix will increase from 11% to 12% from 2022 to 2023 and that solar will grow from 4% to 5% during the period, and renewables hit a record 28% share in April according to recent data. The natural gas share is expected to remain at 39% from 2022 to 2023, and coal is projected to decline from 20% last year to 17% this year.

“Wind and solar are going to be the backbone of the growth in renewables, but whether or not they can provide 100% of the U.S. electricity without backup is something that engineers are debating,” said Brown University’s Porder.

Many decisions lie ahead, he said, as the proportion of renewables that supply the energy grid increases, with renewables projected to soon be one-fourth of U.S. electricity generation over the near term.

This presents challenges for engineers and policy-makers, Porder said, because existing energy grids were built to deliver power from a consistent source. Renewables such as solar and wind generate power intermittently. So battery storage, long-distance transmission and other steps will be needed to help address these challenges, he said.


Related News

View more

Typical Ontario electricity bill set to increase nearly 2% as fixed pricing ends

Ontario Electricity Rates update: OEB sets time-of-use and tiered pricing for residential customers, with kWh charges for peak, mid-peak, and off-peak periods reflecting COVID-19 impacts on demand, supply costs, and pricing.


Key Points

Ontario Electricity Rates are OEB-set time-of-use and tiered prices that set per-kWh costs for residential customers.

✅ Time-of-use: 21.7 peak, 15.0 mid-peak, 10.5 off-peak cents/kWh

✅ Tiered: 12.6 cents/kWh up to 1000 kWh, then 14.6 cents/kWh

✅ Average 700 kWh home pays about $2.24 more per month


Energy bills for the typical Ontario home are going up by about two per cent with fixed pricing coming to an end on Nov. 1, the Ontario Energy Board says. 

The province's electricity regulator has released new time-of-use pricing and says the rate for the average residential customer using 700 kWh per month will increase by about $2.24.

The change comes as Ontario stretches into its eight month of the COVID-19 pandemic with new case counts reaching levels higher than ever seen before.

Time-of-use pricing had been scrapped for residential bills for much for the pandemic with a single fixed COVID-19 hydro rate set for all hours of the day. The move, which came into effect June 1, was meant "to support families, small business and farms while Ontario plans for the safe and gradual reopening of the province," the OEB said at the time.

Ontario later set the off-peak price until February 7 around the clock to provide additional relief.

Fixed pricing meant customers' bills reflected how much power they used, rather than when they used it. Customers were charged 12.8 cents/kWh under the COVID-19 recovery rate no matter their time of use.

Beginning November, the province says customers can choose between time-of-use and tiered pricing options. Rates for time-of-use plans will be 21.7 cents/kWh during peak hours, 15 cents/kWh for mid-peak use and 10.5 cents/kWh for off-peak use. 

Customers choosing tiered pricing will pay 12.6 cents/kWh for the first 1000 kWh each month and then 14.6 cents/kWh for any power used beyond that.

The energy board says the increase in pricing reflects "a combination of factors, including those associated with the COVID-19 pandemic, that have affected demand, supply costs and prices in the summer and fall of 2020."

Asked for his reaction to the move Tuesday, Premier Doug Ford said, "I hate it," adding the province inherited an energy "mess" from the previous Liberal government and are "chipping away at it."


Related News

View more

Sign Up for Electricity Forum’s Newsletter

Stay informed with our FREE Newsletter — get the latest news, breakthrough technologies, and expert insights, delivered straight to your inbox.

Electricity Today T&D Magazine Subscribe for FREE

Stay informed with the latest T&D policies and technologies.
  • Timely insights from industry experts
  • Practical solutions T&D engineers
  • Free access to every issue

Live Online & In-person Group Training

Advantages To Instructor-Led Training – Instructor-Led Course, Customized Training, Multiple Locations, Economical, CEU Credits, Course Discounts.

Request For Quotation

Whether you would prefer Live Online or In-Person instruction, our electrical training courses can be tailored to meet your company's specific requirements and delivered to your employees in one location or at various locations.