Duke Energy defends practices in hearing

By The News & Observer


CSA Z462 Arc Flash Training - Electrical Safety Essentials

Our customized live online or in‑person group training can be delivered to your staff at your location.

  • Live Online
  • 6 hours Instructor-led
  • Group Training Available
Regular Price:
$249
Coupon Price:
$199
Reserve Your Seat Today
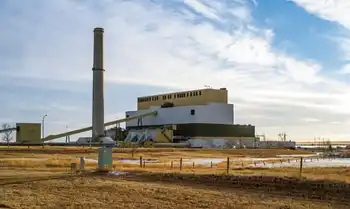
Environmental advocates accused Progress Energy and Duke Energy of stifling the development of energy conservation programs to bolster their efforts to build new power plants.

In a recent hearing before the N.C. Utilities Commission, a former Duke University economics professor told regulators that the state's two biggest utilities could avoid the need for new plants if they aggressively pursued energy efficiency and other conservation programs.

The utilities commission held the hearing this week to review the accuracy of the utilities' energy demand forecasts. The utilities file the forecasts every year for planning purposes. Both companies are planning as many as four new nuclear reactors and other power plants in the Carolinas to meet customer demand.

Both Progress and Duke also are increasing conservation programs, as required by a new state law passed last year. But the advocates say it's not enough.

"The energy efficiency programs seem to be altogether too timid," said John Blackburn, a retired Duke University economist who testified for N.C. Waste Awareness and Reduction Network, a Durham group.

Conservation programs reverse the century-old logic of utility business operations, in which the companies generate their own power and sell it to customers. With conservation, the utilities try to persuade customers - by offering financial incentives - to upgrade appliances, lighting, insulation and home design to save power.

Duke is proposing to meet 1.6 percent of its energy demand through conservation programs in the next five years. Critics say that the company could meet 1 percent of power demand through conservation annually, up to 20 percent over two decades.

No one disputes that the conservation can dramatically cut household electricity use, by as much as 50 percent in some cases, but utility officials are reluctant to become dependent on the public for future planning. The concern is that even with financial incentives, customers may decide not to participate, which could wreak havoc with a region's power supply.

"Just because it's cost-effective doesn't mean that someone will do it," said Richard Stevie, Duke Energy's managing director of customer marketing analytics. "I have seen a lot of energy efficiency programs come and go."

The main drivers of energy demand are growing population and household income. The state is adding about 100,000 new electricity customer accounts a year, of which 75,000 are moving into territory served by Progress or Duke.

The Public Staff, the name of the state's consumer advocacy agency, told the utilities commission that the utility demand forecasts are reasonable.

The critics want the state to require the utilities to revise their forecasts by accounting for more efficiency programs.

The utilities commission is expected to rule on the request within a few months.

Related News

Texas produces and consumes the most electricity in the US

Texas ERCOT Power Grid leads U.S. wind generation yet faces isolated interconnection, FERC exemption, and high industrial energy use, with distinct electricity and natural gas prices managed by a single balancing authority.


Key Points

The state-run interconnection that balances Texas electricity, isolated from FERC oversight and other U.S. grids.

✅ Largest U.S. wind power producer, high industrial demand

✅ Operates one balancing authority, independent interconnection

✅ Pays lower electricity, higher natural gas vs national average


For nearly two decades, the Lone Star State has generated more wind-sourced electricity than any other state in the U.S., according to the Energy Information Administration, or EIA.

In 2022, EIA reported Texas produced more electricity than any other state and generated twice as much as second-place Florida.

However, Texas also leads the country in another category. According to EIA, Texas is the largest energy-consuming state in the nation across all sectors with more than half of the state’s energy being used by the industrial sector.

As of May 2023, Texas residents paid 43% more for natural gas and around 10% less for electricity compared to the national average, according to EIA, and in competitive areas shopping for electricity is getting cheaper as well. Commercial and industrial sectors on average for the same month paid 25% less for electricity compared to the national average.


U.S. electric system compared to Texas
The U.S. electric system is essentially split into three regions called interconnections and are managed by a total of 74 entities called balancing authorities that ensure that power supply and demand are balanced throughout the region to prevent the possibility of blackouts, according to EIA.

The three regions (Interconnections):

Eastern Interconnection: Covers all U.S. states east of the Rocky Mountains, a portion of northern Texas, and consists of 36 balancing authorities.
Western Interconnection: Covers all U.S. states west of the Rockies and consists of 37 balancing authorities.
ERCOT: Covers the majority of Texas and consists of one balancing authority (itself).

During the 2021 winter storm, Texas electric cooperatives were credited with helping maintain service in many communities.

“ERCOT is unique in that the balancing authority, interconnection, and the regional transmission organization are all the same entity and physical system,” according to EIA, a structure often discussed in analyses of Texas power grid challenges today.

With this being the case, Texas is the only state in the U.S. that balances itself, the only state that is not subject to the jurisdiction of the Federal Energy Regulatory Commission, or FERC, and the only state that is not synchronously interconnected to the grid in the rest of the United States in the event of tight grid conditions, highlighting ongoing discussions about improving Texas grid reliability before peak seasons, according to EIA.

Every other state in the U.S. is connected to a web of multiple balancing authorities that contribute to ensuring power supply and demand are met.

California, for example, was the fourth largest electricity producer and the third largest electricity consumer in the nation in 2022, according to EIA, and California imports the most electricity from other states while Pennsylvania exports the most.

Although California produces significantly less electricity than Texas, it has the ability to connect with more than 10 neighboring balancing authorities within the Western Interconnection to interchange electricity, a dynamic that can see clean states importing dirty electricity under certain market conditions. ERCOT being independent only has electricity interchange with two balancing authorities, one of which is in Mexico.

Regardless of Texas’ unique power structure compared to the rest of the nation, the vast majority of the U.S. risked electricity supplies during this summer’s high heat, as outlined in severe heat blackout risks reports, according to EIA.


Related News

View more

Wind and Solar Double Global Share of Electricity in Five Years

Wind And Solar Energy Growth is reshaping the global power mix, accelerating grid decarbonization as coal declines; boosted by pandemic demand drops, renewables now supply near 10% of electricity, advancing climate targets toward net-zero trajectories.


Key Points

It is the rise in wind and solar's share of electricity, driving decarbonization and displacing coal globally.

✅ Share doubled in five years across 83% of global electricity

✅ Coal's share fell; renewables neared 10% in H1 2020

✅ Growth still insufficient for 1.5 C; needs ~13% coal cuts yearly


Wind and solar energy doubled its share of the global power mix over the last five years, with renewable power records underscoring the trend, moving the world closer to a path that would limit the worst effects of global warming.

The sources of renewable energy made up nearly 10% of power in most parts of the world in the first half of this year, according to analysis from U.K. environmental group Ember, while globally over 30% of electricity is renewable in broader assessments.

That decarbonization of the power grid was boosted this year as shutdowns to contain the coronavirus reduced demand overall, leaving renewables to pick up the slack.

Ember analyzed generation in 48 countries that represent 83% of global electricity. The data showed wind and solar power increased 14% in the first half of 2020 compared with the same period last year while global demand fell 3% because of the impact of the coronavirus.

At the same time that wind turbines and solar panels have proliferated, coal’s share of the mix has fallen around the world. In some, mainly western European countries, where renewables surpassed fossil fuels, coal has been all but eliminated from electricity generation.


China relied on the dirtiest fossil fuel for 68% of its power five years ago, and solar PV growth in China has accelerated since then. That share dipped to 62% this year and renewables made up 10% of all electricity generated.

Still, the growth of renewables may not be going fast enough for the world to hit its climate goals, even as the U.S. is projected to have one-fourth of electricity from renewables soon, and coal is still being burnt for power in many parts of the world.

Coal use needs to fall by about 79% by 2030 from last year’s levels - a fall of 13% every year throughout the decade to come, and in the U.S. renewable electricity surpassed coal in 2022, Ember said.

New installations of wind farms are set to hold more or less steady in the next five years, according to data from BloombergNEF on deployment trends. That will make it difficult to realize a sustained pace of doubling renewable power every five years.

“If your expectations are that we need to be on target for 1.5 degrees, clearly we’re not going fast enough,” said Dave Jones, an analyst at Ember. “We’re not on a trajectory where we’re reducing coal emissions fast enough.”


Related News

View more

Turning thermal energy into electricity

Near-Field Thermophotovoltaics captures radiated energy across a nanoscale gap, using thin-film photovoltaic cells and indium gallium arsenide to boost power density and efficiency, enabling compact Army portable power from emitters via radiative heat transfer.


Key Points

A nanoscale TPV method capturing near-field photons for higher power density at lower emitter temperatures.

✅ Nanoscale gap boosts radiative transfer and usable photon flux

✅ Thin-film InGaAs cells recycle sub-band-gap photons via reflector

✅ Achieved ~5 kW/m2 power density with higher efficiency


With the addition of sensors and enhanced communication tools, providing lightweight, portable power has become even more challenging, with concepts such as power from falling snow illustrating how diverse new energy-harvesting approaches are. Army-funded research demonstrated a new approach to turning thermal energy into electricity that could provide compact and efficient power for Soldiers on future battlefields.

Hot objects radiate light in the form of photons into their surroundings. The emitted photons can be captured by a photovoltaic cell and converted to useful electric energy. This approach to energy conversion is called far-field thermophotovoltaics, or FF-TPVs, and has been under development for many years; however, it suffers from low power density and therefore requires high operating temperatures of the emitter.

The research, conducted at the University of Michigan and published in Nature Communications, demonstrates a new approach, where the separation between the emitter and the photovoltaic cell is reduced to the nanoscale, enabling much greater power output than what is possible with FF-TPVs for the same emitter temperature.

This approach, which enables capture of energy that is otherwise trapped in the near-field of the emitter is called near-field thermophotovoltaics or NF-TPV and uses custom-built photovoltaic cells and emitter designs ideal for near-field operating conditions, alongside emerging smart solar inverters that help manage conversion and delivery.

This technique exhibited a power density almost an order of magnitude higher than that for the best-reported near-field-TPV systems, while also operating at six-times higher efficiency, paving the way for future near-field-TPV applications, including remote microgrid deployments in extreme environments, according to Dr. Edgar Meyhofer, professor of mechanical engineering, University of Michigan.

"The Army uses large amounts of power during deployments and battlefield operations and must be carried by the Soldier or a weight constrained system," said Dr. Mike Waits, U.S. Army Combat Capabilities Development Command's Army Research Laboratory. "If successful, in the future near-field-TPVs could serve as more compact and higher efficiency power sources for Soldiers as these devices can function at lower operating temperatures than conventional TPVs."

The efficiency of a TPV device is characterized by how much of the total energy transfer between the emitter and the photovoltaic cell is used to excite the electron-hole pairs in the photovoltaic cell, where insights from near-light-speed conduction research help contextualize performance limits in semiconductors. While increasing the temperature of the emitter increases the number of photons above the band-gap of the cell, the number of sub band-gap photons that can heat up the photovoltaic cell need to be minimized.

"This was achieved by fabricating thin-film TPV cells with ultra-flat surfaces, and with a metal back reflector," said Dr. Stephen Forrest, professor of electrical and computer engineering, University of Michigan. "The photons above the band-gap of the cell are efficiently absorbed in the micron-thick semiconductor, while those below the band-gap are reflected back to the silicon emitter and recycled."

The team grew thin-film indium gallium arsenide photovoltaic cells on thick semiconductor substrates, and then peeled off the very thin semiconductor active region of the cell and transferred it to a silicon substrate, informing potential interfaces with home battery systems for distributed use.

All these innovations in device design and experimental approach resulted in a novel near-field TPV system that could complement distributed resources in virtual power plants for resilient operations.

"The team has achieved a record ~5 kW/m2 power output, which is an order of magnitude larger than systems previously reported in the literature," said Dr. Pramod Reddy, professor of mechanical engineering, University of Michigan.

Researchers also performed state-of-the-art theoretical calculations to estimate the performance of the photovoltaic cell at each temperature and gap size, informing hybrid designs with backup fuel cell solutions that extend battery life, and showed good agreement between the experiments and computational predictions.

"This current demonstration meets theoretical predictions of radiative heat transfer at the nanoscale, and directly shows the potential for developing future near-field TPV devices for Army applications in power and energy, communication and sensors," said Dr. Pani Varanasi, program manager, DEVCOM ARL that funded this work.


Related News

View more

Current Model For Storing Nuclear Waste Is Incomplete

Nuclear Waste Corrosion accelerates as stainless steel, glass, and ceramics interact in aqueous conditions, driving localized corrosion in repositories like Yucca Mountain, according to Nature Materials research on high-level radioactive waste storage.


Key Points

Degradation of waste forms and canisters from water-driven chemistry, causing accelerated, localized corrosion in storage.

✅ Stainless steel-glass contact triggers severe localized attack

✅ Ceramics and steel co-corrosion observed under aqueous conditions

✅ Yucca Mountain-like chemistry accelerates waste form degradation


The materials the United States and other countries plan to use to store high-level nuclear waste, even as utilities expand carbon-free electricity portfolios, will likely degrade faster than anyone previously knew because of the way those materials interact, new research shows.

The findings, published today in the journal Nature Materials (https://www.nature.com/articles/s41563-019-0579-x), show that corrosion of nuclear waste storage materials accelerates because of changes in the chemistry of the nuclear waste solution, and because of the way the materials interact with one another.

"This indicates that the current models may not be sufficient to keep this waste safely stored," said Xiaolei Guo, lead author of the study and deputy director of Ohio State's Center for Performance and Design of Nuclear Waste Forms and Containers, part of the university's College of Engineering. "And it shows that we need to develop a new model for storing nuclear waste."

Beyond waste storage, options like carbon capture technologies are being explored to reduce atmospheric CO2 alongside nuclear energy.

The team's research focused on storage materials for high-level nuclear waste -- primarily defense waste, the legacy of past nuclear arms production. The waste is highly radioactive. While some types of the waste have half-lives of about 30 years, others -- for example, plutonium -- have a half-life that can be tens of thousands of years. The half-life of a radioactive element is the time needed for half of the material to decay.

The United States currently has no disposal site for that waste; according to the U.S. General Accountability Office, it is typically stored near the nuclear power plants where it is produced. A permanent site has been proposed for Yucca Mountain in Nevada, though plans have stalled. Countries around the world have debated the best way to deal with nuclear waste; only one, Finland, has started construction on a long-term repository for high-level nuclear waste.

But the long-term plan for high-level defense waste disposal and storage around the globe is largely the same, even as the U.S. works to sustain nuclear power for decarbonization efforts. It involves mixing the nuclear waste with other materials to form glass or ceramics, and then encasing those pieces of glass or ceramics -- now radioactive -- inside metallic canisters. The canisters then would be buried deep underground in a repository to isolate it.

At the generation level, regulators are advancing EPA power plant rules on carbon capture to curb emissions while nuclear waste strategies evolve.

In this study, the researchers found that when exposed to an aqueous environment, glass and ceramics interact with stainless steel to accelerate corrosion, especially of the glass and ceramic materials holding nuclear waste.

In parallel, the electrical grid's reliance on SF6 insulating gas has raised warming concerns across Europe.

The study qualitatively measured the difference between accelerated corrosion and natural corrosion of the storage materials. Guo called it "severe."

"In the real-life scenario, the glass or ceramic waste forms would be in close contact with stainless steel canisters. Under specific conditions, the corrosion of stainless steel will go crazy," he said. "It creates a super-aggressive environment that can corrode surrounding materials."

To analyze corrosion, the research team pressed glass or ceramic "waste forms" -- the shapes into which nuclear waste is encapsulated -- against stainless steel and immersed them in solutions for up to 30 days, under conditions that simulate those under Yucca Mountain, the proposed nuclear waste repository.

Those experiments showed that when glass and stainless steel were pressed against one another, stainless steel corrosion was "severe" and "localized," according to the study. The researchers also noted cracks and enhanced corrosion on the parts of the glass that had been in contact with stainless steel.

Part of the problem lies in the Periodic Table. Stainless steel is made primarily of iron mixed with other elements, including nickel and chromium. Iron has a chemical affinity for silicon, which is a key element of glass.

The experiments also showed that when ceramics -- another potential holder for nuclear waste -- were pressed against stainless steel under conditions that mimicked those beneath Yucca Mountain, both the ceramics and stainless steel corroded in a "severe localized" way.

Other Ohio State researchers involved in this study include Gopal Viswanathan, Tianshu Li and Gerald Frankel.

This work was funded in part by the U.S. Department of Energy Office of Science.

Meanwhile, U.S. monitoring shows potent greenhouse gas declines confirming the impact of control efforts across the energy sector.


Related News

View more

Canada expected to miss its 2035 clean electricity goals

Canada 2035 Clean Electricity Target faces a 48.4GW shortfall as renewable capacity lags; accelerating wind, solar PV, grid upgrades, and coherent federal-provincial policy is vital to reach zero-emissions power and strengthen transmission and distribution.


Key Points

Canada's plan to supply nearly 100% of electricity from zero-emitting sources by 2035, requiring renewable buildout.

✅ Average adds 2.6GW; shortfall totals 48.4GW by 2035

✅ Expand wind, solar PV, storage, and grid modernization

✅ Align federal-province policy; retire or convert thermal plants


GlobalData’s latest report, ‘Canada Power Market Size and Trends by Installed Capacity, Generation, Transmission, Distribution and Technology, Regulations, Key Players and Forecast, 2022-2035’, discusses the power market structure of Canada and, amid looming power challenges, provides historical and forecast numbers for capacity, generation and consumption up to 2035. Detailed analysis of the country’s power market regulatory structure, competitive landscape and a list of major power plants are provided. The report also gives a snapshot of the power sector in the country on broad parameters of macroeconomics, supply security, generation infrastructure, transmission and distribution infrastructure, electricity import and export scenario, degree of competition, regulatory scenario, and future potential. An analysis of the deals in the country’s power sector is also included in the report.

Canada is expected to fall short of its 2035 clean electricity target after reviewing the country’s current renewable capacity activity. The country has targeted to produce nearly 100% of its electricity from zero-emitting sources by 2035, while electricity associations' net-zero goals extend to 2050; however, the country is adding only 2.6GW of annual renewable capacity additions on average every year, which would mean a cumulative shortfall of 48.4GW.

Canada has good governmental support, but it is not doing enough to ensure its targets are met. If the country is to meet its target to produce nearly 100% of electricity from zero-emitting sources by 2035, the country should both increase the capacity and efficiency of renewable power plants, as well as provide comprehensive end-to-end policies at both the federal and provincial levels, as debates over whether Ontario is embracing clean power continue across provinces. It should also involve communities and businesses in raising awareness of the benefits of adopting renewable energy.

The country has a large amount of proven natural gas and oil reserves that are proving too tempting an opportunity, and the Canadian Government is planning to increase the capacity of its gas-based plants under net-zero regulations permit some gas in the power mix, to secure real-time demand and supply. However, the country’s dependency on gas-based plants creates a major challenge to achieve its 2035 clean electricity target.

If the Canadian Government is to meet its 2035 targets, it should draw on examples from its European counterparts and add renewable capacity at a rapid pace, while balancing demand and emissions in key provinces. One advantage for Canada here is that it does not have land constraints, which is common in other major renewable power-generating countries. This could give the country an estimated 6.1GW of renewable capacity every year on average during the 2021-2035 period: enough capacity to meet its target. Most of these installations are expected to be for wind and solar PV.

Changing provincial governments are not helpful when it comes to implementing long-term projects, especially as Ontario faces looming electricity shortfalls that heighten planning risks, and continued stopping and starting of projects like this will only be damaging to renewable goals. Another way the country can achieve its target is by converting thermal power plants into clean energy plants and providing a roadmap or timeline for provinces to retire thermal power plants completely, even as scrapping coal can be costly for some systems.

Canada’s GDP (at constant prices) increased from $1,617.3bn in 2010 to $1,924.5bn in 2021, at a CAGR of 1.6%. The GDP (at constant prices) of the country declined sharply from $1,943.8bn in 2019 to $1,840.5bn in 2020 because of Covid-19 pandemic. After the recommencement of regular industrial and trade activities, the GDP grew by 4.6% in 2021 from 2020. The GDP is expected to cross pre-pandemic levels by the end of 2022.


Related News

View more

Duke Energy reaffirms capital investments in renewables and grid projects to deliver cleaner energy, economic growth

Duke Energy Clean Energy Strategy advances renewables, battery storage, grid modernization, and energy efficiency to cut carbon, retire coal, and target net-zero by 2050 across the Carolinas with robust IRPs and capital investments.


Key Points

Plan to expand renewables, storage, and grid upgrades to cut carbon and reach net-zero electricity by 2050.

✅ 56B investment in renewables, storage, and grid modernization

✅ Targets 50% carbon reduction by 2030 and net-zero by 2050

✅ Retires coal units; expands energy efficiency and IRPs


Duke Energy says that the company will continue advancing its ambitious clean energy goals without the Atlantic Coast Pipeline (ACP) by investing in renewables, battery storage, energy efficiency programs and grid projects that support U.S. electrification efforts.

Duke Energy, the nation's largest electric utility, unveils its new logo. (PRNewsFoto/Duke Energy) (PRNewsfoto/Duke Energy)

Duke Energy's $56 billion capital investment plan will deliver significant customer benefits and create jobs at a time when policymakers at all levels are looking for ways to rebuild the economy in 2020 and beyond. These investments will deliver cleaner energy for customers and communities while enhancing the energy grid to provide greater reliability and resiliency.

"Sustainability and the reduction of carbon emissions are closely tied to our region's success," said Lynn Good, Duke Energy Chair, President and CEO. "In our recent Climate Report, we shared a vision of a cleaner electricity future with an increasing focus on renewables and battery storage in addition to a diverse mix of zero-carbon nuclear, natural gas, hydro and energy efficiency programs.

"Achieving this clean energy vision will require all of us working together to develop a plan that is smart, equitable and ensures the reliability and affordability that will spur economic growth in the region. While we're disappointed that we're not able to move forward with ACP, we will continue exploring ways to help our customers and communities, particularly in eastern North Carolina where the need is great," said Good.

Already a clean-energy leader, Duke Energy has reduced its carbon emissions by 39% from 2005 and remains on track to cut its carbon emissions by at least 50% by 2030, as peers like Alliant's carbon-neutral plan demonstrate broader industry momentum toward decarbonization. The company also has an ambitious clean energy goal of reaching net-zero emissions from electricity generation by 2050. 

In September 2020, Duke Energy plans to file its Integrated Resource Plans (IRP) for the Carolinas after an extensive process of working with the state's leaders, policymakers, customers and other stakeholders. The IRPs will include multiple scenarios to support a path to a cleaner energy future in the Carolinas, reflecting key utility trends shaping resource planning.

Since 2010, Duke Energy has retired 51 coal units totaling more than 6,500 megawatts (MW) and plans to retire at least an additional 900 MW by the end of 2024. In 2019, the company proposed to shorten the book lives of another approximately 7,700 MW of coal capacity in North Carolina and Indiana.

Duke Energy will host an analyst call in early August 2020 to discuss second quarter 2020 financial results and other business and financial updates. The company will also host its inaugural Environmental, Social and Governance (ESG) investor day in October 2020.


Duke Energy

Duke Energy is transforming its customers' experience, modernizing the energy grid, generating cleaner energy and expanding natural gas infrastructure to create a smarter energy future for the people and communities it serves. The Electric Utilities and Infrastructure unit's regulated utilities serve 7.8 million retail electric customers in six states: North Carolina, South Carolina, Florida, Indiana, Ohio and Kentucky. The Gas Utilities and Infrastructure unit distributes natural gas to 1.6 million customers in five states: North Carolina, South Carolina, Tennessee, Ohio and Kentucky. The Duke Energy Renewables unit operates wind and solar generation facilities across the U.S., as well as energy storage and microgrid projects.

Duke Energy was named to Fortune's 2020 "World's Most Admired Companies" list and Forbes' "America's Best Employers" list. More information about the company is available at duke-energy.com. The Duke Energy News Center contains news releases, fact sheets, photos, videos and other materials. Duke Energy's illumination features stories about people, innovations, community topics and environmental issues. Follow Duke Energy on Twitter, LinkedIn, Instagram and Facebook.


Forward-Looking Information

This document includes forward-looking statements within the meaning of Section 27A of the Securities Act of 1933 and Section 21E of the Securities Exchange Act of 1934. Forward-looking statements are based on management's beliefs and assumptions and can often be identified by terms and phrases that include "anticipate," "believe," "intend," "estimate," "expect," "continue," "should," "could," "may," "plan," "project," "predict," "will," "potential," "forecast," "target," "guidance," "outlook" or other similar terminology. Various factors may cause actual results to be materially different than the suggested outcomes within forward-looking statements; accordingly, there is no assurance that such results will be realized. These factors include, but are not limited to:

  • The impact of the COVID-19 electricity demand shift on operations and revenues;
  • State, federal and foreign legislative and regulatory initiatives, including costs of compliance with existing and future environmental requirements, including those related to climate change, as well as rulings that affect cost and investment recovery or have an impact on rate structures or market prices;
  • The extent and timing of costs and liabilities to comply with federal and state laws, regulations and legal requirements related to coal ash remediation, including amounts for required closure of certain ash impoundments, are uncertain and difficult to estimate;
  • The ability to recover eligible costs, including amounts associated with coal ash impoundment retirement obligations and costs related to significant weather events, and to earn an adequate return on investment through rate case proceedings and the regulatory process;
  • The costs of decommissioning nuclear facilities could prove to be more extensive than amounts estimated and all costs may not be fully recoverable through the regulatory process;
  • Costs and effects of legal and administrative proceedings, settlements, investigations and claims;
  • Industrial, commercial and residential growth or decline in service territories or customer bases resulting from sustained downturns of the economy and the economic health of our service territories or variations in customer usage patterns, including energy efficiency and demand response efforts and use of alternative energy sources, such as self-generation and distributed generation technologies;
  • Federal and state regulations, laws and other efforts designed to promote and expand the use of energy efficiency measures and distributed generation technologies, such as private solar and battery storage, in Duke Energy service territories could result in customers leaving the electric distribution system, excess generation resources as well as stranded costs;
  • Advancements in technology;
  • Additional competition in electric and natural gas markets and continued industry consolidation;
  • The influence of weather and other natural phenomena on operations, including the economic, operational and other effects of severe storms, hurricanes, droughts, earthquakes and tornadoes, including extreme weather associated with climate change;
  • The ability to successfully operate electric generating facilities and deliver electricity to customers including direct or indirect effects to the company resulting from an incident that affects the U.S. electric grid or generating resources;
  • The ability to obtain the necessary permits and approvals and to complete necessary or desirable pipeline expansion or infrastructure projects in our natural gas business;
  • Operational interruptions to our natural gas distribution and transmission activities;
  • The availability of adequate interstate pipeline transportation capacity and natural gas supply;
  • The impact on facilities and business from a terrorist attack, cybersecurity threats, data security breaches, operational accidents, information technology failures or other catastrophic events, such as fires, explosions, pandemic health events or other similar occurrences;
  • The inherent risks associated with the operation of nuclear facilities, including environmental, health, safety, regulatory and financial risks, including the financial stability of third-party service providers;
  • The timing and extent of changes in commodity prices and interest rates and the ability to recover such costs through the regulatory process, where appropriate, and their impact on liquidity positions and the value of underlying assets;
  • The results of financing efforts, including the ability to obtain financing on favorable terms, which can be affected by various factors, including credit ratings, interest rate fluctuations, compliance with debt covenants and conditions and general market and economic conditions;
  • Credit ratings of the Duke Energy Registrants may be different from what is expected;
  • Declines in the market prices of equity and fixed-income securities and resultant cash funding requirements for defined benefit pension plans, other post-retirement benefit plans and nuclear decommissioning trust funds;
  • Construction and development risks associated with the completion of the Duke Energy Registrants' capital investment projects, including risks related to financing, obtaining and complying with terms of permits, meeting construction budgets and schedules and satisfying operating and environmental performance standards, as well as the ability to recover costs from customers in a timely manner, or at all;
  • Changes in rules for regional transmission organizations, including FERC debates on coal and nuclear subsidies and new and evolving capacity markets, and risks related to obligations created by the default of other participants;
  • The ability to control operation and maintenance costs;
  • The level of creditworthiness of counterparties to transactions;
  • The ability to obtain adequate insurance at acceptable costs;
  • Employee workforce factors, including the potential inability to attract and retain key personnel;
  • The ability of subsidiaries to pay dividends or distributions to Duke Energy Corporation holding company (the Parent);
  • The performance of projects undertaken by our nonregulated businesses and the success of efforts to invest in and develop new opportunities;
  • The effect of accounting pronouncements issued periodically by accounting standard-setting bodies;
  • The impact of U.S. tax legislation to our financial condition, results of operations or cash flows and our credit ratings;
  • The impacts from potential impairments of goodwill or equity method investment carrying values; and
  • The ability to implement our business strategy, including enhancing existing technology systems.
  • Additional risks and uncertainties are identified and discussed in the Duke Energy Registrants' reports filed with the SEC and available at the SEC's website at sec.gov. In light of these risks, uncertainties and assumptions, the events described in the forward-looking statements might not occur or might occur to a different extent or at a different time than described. Forward-looking statements speak only as of the date they are made and the Duke Energy Registrants expressly disclaim an obligation to publicly update or revise any forward-looking statements, whether as a result of new information, future events or otherwise.


Related News

View more

Sign Up for Electricity Forum’s Newsletter

Stay informed with our FREE Newsletter — get the latest news, breakthrough technologies, and expert insights, delivered straight to your inbox.

Electricity Today T&D Magazine Subscribe for FREE

Stay informed with the latest T&D policies and technologies.
  • Timely insights from industry experts
  • Practical solutions T&D engineers
  • Free access to every issue

Live Online & In-person Group Training

Advantages To Instructor-Led Training – Instructor-Led Course, Customized Training, Multiple Locations, Economical, CEU Credits, Course Discounts.

Request For Quotation

Whether you would prefer Live Online or In-Person instruction, our electrical training courses can be tailored to meet your company's specific requirements and delivered to your employees in one location or at various locations.