Centauri Energy, LLC Receives Approval For 300-Megawatt Solar Project

By Business Wire


NFPA 70b Training - Electrical Maintenance

Our customized live online or in‑person group training can be delivered to your staff at your location.

  • Live Online
  • 12 hours Instructor-led
  • Group Training Available
Regular Price:
$599
Coupon Price:
$499
Reserve Your Seat Today
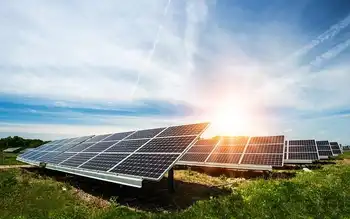
Centauri Energy, LLC today announced receiving approval from the California Independent System Operation CAISO to secure a queue position for Beltran Solar , the companyÂ’s 300-Megawatt MW solar project in Stanislaus County, California . The queue position will allow Beltran Solar to connect to the stateÂ’s power grid.

At 300 MW, Beltran Solar represents one of the largest solar projects under way in California . It spans approximately 1,600 acres near Interstate 5 , and is located approximately an hour southeast of the Bay Area . Beltran Solar will be built in three phases, with the first phase slated to deliver power in 2016 and 2017.

“Having Beltran Solar approved by CAISO for a queue position marks an important milestone for us,” said Jeff Irvine , Centauri Energy’s CEO and president. “Beltran Solar has been in development for more than five years. The permits have been issued, the environmental impact studies are finished and now the CAISO application is approved. These are some of the biggest hurdles for a large-scale project like this. With all of these complete, we’re ready to develop,” he said.

“The demand for renewable energy has never been greater, and adding 300 Megawatts of solar power to the grid is significant,” Irvine added. “We’re really pleased to be moving forward.” For more information, visit www.centaurienergyllc.com , call 925/308-4047 or email admin@CentauriEnergyllc.com.

Related News

Which of the cleaner states imports dirty electricity?

Hourly Electricity Emissions Tracking maps grid balancing areas, embodied emissions, and imports/exports, revealing carbon intensity shifts across PJM, ERCOT, and California ISO, and clarifying renewable energy versus coal impacts on health and climate.


Key Points

An hourly method tracing generation, flows, and embodied emissions to quantify carbon intensity across US balancing areas.

✅ Hourly traces of imports/exports and generation mix

✅ Consumption-based carbon intensity by balancing area

✅ Policy insights for renewables, coal, health costs


In the United States, electricity generation accounts for nearly 30% of our carbon emissions. Some states have responded to that by setting aggressive renewable energy standards; others are hoping to see coal propped up even as its economics get worse. Complicating matters further is the fact that many regional grids are integrated, and as America goes electric the stakes grow, meaning power generated in one location may be exported and used in a different state entirely.

Tracking these electricity exports is critical for understanding how to lower our national carbon emissions. In addition, power from a dirty source like coal has health and environment impacts where it's produced, and the costs of these aren't always paid by the parties using the electricity. Unfortunately, getting reliable figures on how electricity is produced and where it's used is challenging, even for consumers trying to find where their electricity comes from in the first place, leaving some of the best estimates with a time resolution of only a month.

Now, three Stanford researchers—Jacques A. de Chalendar, John Taggart, and Sally M. Benson—have greatly improved on that standard, and they have managed to track power generation and use on an hourly basis. The researchers found that, of the 66 grid balancing areas within the United States, only three have carbon emissions equivalent to our national average, and they have found that imports and exports of electricity have both seasonal and daily changes. de Chalendar et al. discovered that the net results can be substantial, with imported electricity increasing California's emissions/power by 20%.

Hour by hour
To figure out the US energy trading landscape, the researchers obtained 2016 data for grid features called balancing areas. The continental US has 66 of these, providing much better spatial resolution on the data than the larger grid subdivisions. This doesn't cover everything—several balancing areas in Canada and Mexico are tied in to the US grid—and some of these balancing areas are much larger than others. The PJM grid, serving Pennsylvania, New Jersey, and Maryland, for example, is more than twice as large as Texas' ERCOT, in a state that produces and consumes the most electricity in the US.

Despite these limitations, it's possible to get hourly figures on how much electricity was generated, what was used to produce it, and whether it was used locally or exported to another balancing area. Information on the generating sources allowed the researchers to attach an emissions figure to each unit of electricity produced. Coal, for example, produces double the emissions of natural gas, which in turn produces more than an order of magnitude more carbon dioxide than the manufacturing of solar, wind, or hydro facilities. These figures were turned into what the authors call "embodied emissions" that can be traced to where they're eventually used.

Similar figures were also generated for sulfur dioxide and nitrogen oxides. Released by the burning of fossil fuels, these can both influence the global climate and produce local health problems.

Huge variation
The results were striking. "The consumption-based carbon intensity of electricity varies by almost an order of magnitude across the different regions in the US electricity system," the authors conclude. The low is the Bonneville Power grid region, which is largely supplied by hydropower; it has typical emissions below 100kg of carbon dioxide per megawatt-hour. The highest emissions come in the Ohio Valley Electric region, where emissions clear 900kg/MW-hr. Only three regional grids match the overall grid emissions intensity, although that includes the very large PJM (where capacity auction payouts recently fell), ERCOT, and Southern Co balancing areas.

Most of the low-emissions power that's exported comes from the Pacific Northwest's abundant hydropower, while the Rocky Mountains area exports electricity with the highest associated emissions. That leads to some striking asymmetries. Local generation in the hydro-rich Idaho Power Company has embodied emissions of only 71kg/MW-hr, while its imports, coming primarily from Rocky Mountain states, have a carbon content of 625kg/MW-hr.

The reliance on hydropower also makes the asymmetry seasonal. Local generation is highest in the spring as snow melts, but imports become a larger source outside this time of year. As solar and wind can also have pronounced seasonal shifts, similar changes will likely be seen as these become larger contributors to many of these regional grids. Similar things occur daily, as both demand and solar production (and, to a lesser extent, wind) have distinct daily profiles.

The Golden State
California's CISO provides another instructive case. Imports represent less than 30% of its total electric use in 2016, yet California electricity imports provided 40% of its embodied emissions. Some of these, however, come internally from California, provided by the Los Angeles Department of Water and Power. The state itself, however, has only had limited tracking of imported emissions, lumping many of its sources as "other," and has been exporting its energy policies to Western states in ways that shape regional markets.

Overall, the 2016 inventory provides a narrow picture of the US grid, as plenty of trends are rapidly changing our country's emissions profile, including the rise of renewables and the widespread adoption of efficiency measures and other utility trends in 2017 that continue to evolve. The method developed here can, however, allow for annual updates, providing us with a much better picture of trends. That could be quite valuable to track things like how the rapid rise in solar power is altering the daily production of clean power.

More significantly, it provides a basis for more informed policymaking. States that wish to promote low-emissions power can use the information here to either alter the source of their imports or to encourage the sites where they're produced to adopt more renewable power. And those states that are exporting electricity produced primarily through fossil fuels could ensure that the locations where the power is used pay a price that includes the health costs of its production.


Related News

View more

COVID-19 closures: It's as if Ottawa has fallen off the electricity grid

Ontario Electricity Demand Drop During COVID-19 reflects a 1,000-2,000 MW decline as IESO balances the grid, shifts peak demand later, throttles generators and baseload nuclear, and manages exports amid changing load curves.


Key Points

An about 10% reduction in Ontario's load, shifting peaks and requiring IESO grid balancing measures.

✅ Demand down 1,000-2,000 MW; roughly 10% below normal.

✅ Peak shifts later in morning as home use rises.

✅ IESO throttles generators; baseload nuclear stays online.


It’s as if the COVID-19 epidemic had tripped a circuit breaker, shutting off all power to a city the size of Ottawa.

Virus-induced restrictions that have shut down large swaths of normal commercial life across Canada has led to a noticeable drop in demand for power in Ontario and reflect a global demand dip according to reports, insiders said on Friday.

Terry Young, vice-president with the Independent Electricity System Operator, said planning was underway for further declines in usage and for whether Ontario will embrace more clean power in the long term, given the delicate balance that needs to be maintained between supply and demand.

“We’re now seeing demand that is running about 1,000 to 2,000 megawatts less than we would normally see,” Young said. “You’re essentially seeing a city the size of Ottawa drop off demand during the day.”

At the high end, a 2,000 megawatt reduction would be close to the equivalent peak demand of Ottawa and London, Ont., combined.

The decline, in the order of 10 per cent from the 17,000 to 18,000 megawatts of usage that might normally be expected and similar to the UK’s 10% drop reported during lockdowns, began last week, Young said. The downward trend became more noticeable as governments and health authorities ordered non-essential businesses to close and people to stay home. However, residential and hospital usage has climbed.

Experts say frequent hand-washing and staying away from others is the most effective way to curb the spread of the highly contagious coronavirus, which poses a special risk to older people and those with underlying health conditions. As a result, factories and other big users have reduced production or closed entirely.

Because electricity cannot be stored, generators need to throttle back their output as domestic demand shrinks and exports to places such as the United States, including New York City, which is also being hit hard by the coronavirus, fall.

“We’re watching this carefully,” Young said. “We’re able to manage this drop, but it’s something we obviously have to keep watching…and making sure we’re not over-generating electricity.”

Turning off generation, especially for nuclear plants, is an intensive process, as are restarts and would likely happen only if the downward demand trend intensifies significantly, amid concerns over Ontario’s electricity getting dirtier if baseload is displaced. However, one of North America’s largest generators, Bruce Power near Kincardine, Ont., said it had a large degree of flexibility to scale down or up.

“We have the ability to provide one-third of our output as a dynamic response, which is unique to our facility,” said James Scongack, an executive vice-president with Bruce Power. “We developed this coming out of the 2008 downturn and it’s been a critical system asset for the last decade.”

“We don’t see there being a scenario where our baseload will not be needed,” he said, even as some warn Ontario may be short of electricity in the coming years.

The province’s publicly owned Ontario Power Generation said it was also in conversations with the system operator, which provides direction to generators, and is often cited in the Ontario election discussion.

One clear shift in normal work-day usage with so many people staying at home has been the change in demand patterns. Typically, Young said, there’s a peak from about 7 a.m. to 8 a.m. as people wake and get ready to go to work or school. The peak is now occurring later in the morning, Young said.


Related News

View more

Overturning statewide vote, Maine court energizes Hydro-Quebec's bid to export power

Maine Hydropower Transmission Line revived by high court after referendum challenge, advancing NECEC, Hydro-Quebec supply, Central Maine Power partnership, clean energy integration, grid reliability, and lower rates across New England pending land-lease ruling.


Key Points

A court-revived NECEC line delivering 1,200 MW of Hydro-Quebec hydropower via CMP to strengthen the New England grid.

✅ Maine high court deems retroactive referendum unconstitutional

✅ Pending state land lease case may affect final route

✅ Project could lower rates and cut emissions in New England


Maine's highest court on Tuesday breathed new life into a $1-billion US transmission line that aims to serve as conduit for Canadian hydropower, after construction starts drew scrutiny, ruling that a statewide vote rebuking the project was unconstitutional.

The Supreme Judicial Court ruled that the retroactive nature of the referendum last year violated the project developer's constitutional rights, sending it back to a lower court for further proceedings.

The court did not rule in a separate case that focuses on a lease for a 1.6-kilometre portion of the proposed power line that crosses state land.

Central Maine Power's parent company and Hydro-Québec teamed up on the project that would supply up to 1,200 megawatts of Canadian hydropower, amid the ongoing Maine-Quebec corridor debate in the region. That's enough electricity for one million homes.

Most of the proposed 233-kilometre power transmission line would be built along existing corridors, but a new 85-kilometre section was needed to reach the Canadian border, echoing debates around the Northern Pass clash in New Hampshire.

Workers were already clearing trees and setting poles when the governor asked for work to be suspended after the referendum in November 2021, mirroring New Hampshire's earlier rejection of a Quebec-Massachusetts proposal that rerouted regional plans. The Maine Department of Environmental Protection later suspended its permit, but that could be reversed depending on the outcome of legal proceedings.

The high court was asked to weigh in on two separate lawsuits. Developers sought to declare the referendum unconstitutional while another lawsuit focused on a lease allowing transmission lines to cross a short segment of state-owned land.

Supporters say bold projects such as this one, funded by ratepayers in Massachusetts, are necessary to battle climate change and introduce additional electricity into a region that's heavily reliant on natural gas, which can cause spikes in energy costs, as seen with Nova Scotia rate increases recently across the Atlantic region.

Critics say the project's environmental benefits are overstated — and that it would harm the woodlands in western Maine.

It was the second time the Supreme Judicial Court was asked to weigh in on a referendum aimed at killing the project. The first referendum proposal never made it onto the ballot after the court raised constitutional concerns.

Although the project is funded by Massachusetts ratepayers, the introduction of so much electricity to the grid would serve to stabilize or reduce electricity rates for all consumers, proponents contend, even as Manitoba Hydro rate hikes face opposition elsewhere.

The referendum on the project was the costliest in Maine history, topping $90 million US and underscoring deep divisions.

The high-stakes campaign put environmental and conservation groups at odds, and pitted utilities backing the project, amid the Hydro One-Avista backlash, against operators of fossil fuel-powered plants that stand to lose money.


Related News

View more

The Phillipines wants nuclear power to be included in the country's energy mix as the demand for electricity is expected to rise.

Philippines Nuclear Energy Policy aims to add nuclear power to the energy mix via executive order, meeting rising electricity demand with 24/7 baseload while balancing safety, renewables, and imported fuel dependence in the Philippines.


Key Points

A government plan to include nuclear power in the energy mix to meet demand, ensure baseload, and uphold safety.

✅ Executive order proposed by Energy Secretary Alfonso Cusi

✅ Targets 24/7 baseload, rising electricity demand

✅ Balances safety, renewables, and energy security


Phillipines Presidential spokesman Salvador Panelo said Energy Secretary Alfonso Cusi made the proposal during last Monday's Cabinet meeting in Malacaaang. "Secretary Cusi likewise sought the approval of the issuance of a proposed executive order for the inclusion of nuclear power, including next-gen nuclear options in the country's energy mix as the Philippines is expected to the rapid growth in electricity and electricity demand, in which, 24/7 power is essential and necessary," Panelo said in a statement.

Panelo said Duterte would study the energy chief's proposal, as China's nuclear development underscores regional momentum. In the 1960s until the mid 80s, the late president Ferdinand Marcos adopted a nuclear energy program and built the Bataan Nuclear Plant.

The nuclear plant was mothballed after Corazon Aquino became president in 1986. There have been calls to revive the nuclear plant, saying it would help address the Philippines' energy supply issues. Some groups, however, said such move would be expensive and would endanger the lives of people living near the facility, citing Three Mile Island as a cautionary example.

Panelo said proposals to revive the Bataan Nuclear Plant were not discussed during the Cabinet meeting, even as debates like California's renewable classification continue to shape perceptions. Indigenous energy sources natural gas, hydro, coal, oil, geothermal, wind, solar, biomassand ethanol constitute more than half or 59.6%of the Philippines' energy mix.

Imported oil make up 31.7% while imported coal, reflecting the country's coal dependency, contribute about 8.7%.

Imported ethanol make up 0.1% of the energy mix, even as interest in atomic energy rises globally.

In 2018, Duterte said safety should be the priority when deciding whether to tap nuclear energy for the country's power needs, as countries like India's nuclear restart proceed with their own safeguards.


Related News

View more

Was there another reason for electricity shutdowns in California?

PG&E Wind Shutdown and Renewable Reliability examines PSPS strategy, wildfire risk, transmission line exposure, wind turbine cut-out speeds, grid stability, and California's energy mix amid historic high-wind events and supply constraints across service areas.


Key Points

An overview of PG&E's PSPS decisions, wildfire mitigation, and how wind cut-out limits influence grid reliability.

✅ Wind turbines reach cut-out near 55 mph, reducing generation.

✅ PSPS mitigates ignition from damaged transmission infrastructure.

✅ Baseload diversity improves resilience during high-wind events.


According to the official, widely reported story, Pacific Gas & Electric (PG&E) initiated power shutoffs across substantial portions of its electric transmission system in northern California as a precautionary measure.

Citing high wind speeds they described as “historic,” the utility claims that if it didn’t turn off the grid, wind-caused damage to its infrastructure could start more wildfires.

Perhaps that’s true. Perhaps. This tale presumes that the folks who designed and maintain PG&E’s transmission system are unaware of or ignored the need to design it to withstand severe weather events, and that the Federal Energy Regulatory Commission (FERC) and North American Electric Reliability Corp. (NERC) allowed the utility to do so.

Ignorance and incompetence happens, to be sure, but there’s much about this story that doesn’t smell right—and it’s disappointing that most journalists and elected officials are apparently accepting it without question.

Take, for example, this statement from a Fox News story about the Kincade Fires: “A PG&E meteorologist said it’s ‘likely that many trees will fall, branches will break,’ which could damage utility infrastructure and start a fire.”

Did you ever notice how utilities cut wide swaths of trees away when transmission lines pass through forests? There’s a reason for that: When trees fall and branches break, the grid can still function, and even as the electric rhythms of New York City shifted during COVID-19, operators planned for variability.

So, if badly designed and poorly maintained infrastructure isn’t the reason PG&E cut power to millions of Californians, what might have prompted them to do so? Could it be that PG&E’s heavy reliance on renewable energy means they don’t have the power to send when a “historic” weather event occurs, especially as policymakers weigh the postponed closure of three power plants elsewhere in California?


Wind Speed Limits

The two most popular forms of renewable energy come with operating limitations, which is why some energy leaders urge us to keep electricity options open when planning the grid. With solar power, the constraint is obvious: the availability of sunlight. One doesn’t generate solar power at night and energy generation drops off with increasing degrees of cloud cover during the day.

The main operating constraint of wind power is, of course, wind speed, and even in markets undergoing 'transformative change' in wind generation, operators adhere to these technical limits. At the low end of the scale, you need about a 6 or 7 miles-per-hour wind to get a turbine moving. This is called the “cut-in speed.” To generate maximum power, about a 30 mph wind is typically required. But, if the wind speed is too high, the wind turbine will shut down. This is called the “cut-out speed,” and it’s about 55 miles per hour for most modern wind turbines.

It may seem odd that wind turbines have a cut-out speed, but there’s a very good reason for it. Each wind turbine rotor is connected to an electric generator housed in the turbine nacelle. The connection is made through a gearbox that is sized to turn the generator at the precise speed required to produce 60 Hertz AC power.

The blades of the wind turbine are airfoils, just like the wings of an airplane. Adjusting the pitch (angle) of the blades allows the rotor to maintain constant speed, which, in turn, allows the generator to maintain the constant speed it needs to safely deliver power to the grid. However, there’s a limit to blade pitch adjustment. When the wind is blowing so hard that pitch adjustment is no longer possible, the turbine shuts down. That’s the cut-out speed.

Now consider how California’s power generation profile has changed. According to Energy Information Administration data, the state generated 74.3 percent of its electricity from traditional sources—fossil fuels and nuclear, amid debates over whether to classify nuclear as renewable—in 2001. Hydroelectric, geothermal, and biomass-generated power accounted for most of the remaining 25.7 percent, with wind and solar providing only 1.98 percent of the total.

By 2018, the state’s renewable portfolio had jumped to 43.8 percent of total generation, with clean power increasing and wind and solar now accounting for 17.9 percent of total generation. That’s a lot of power to depend on from inherently unreliable sources. Thus, it wouldn’t be at all surprising to learn that PG&E didn’t stop delivering power out of fear of starting fires, but because it knew it wouldn’t have power to deliver once high winds shut down all those wind turbines


Related News

View more

Net-zero roadmap can cut electricity costs by a third in Germany - Wartsila

Germany net-zero roadmap charts coal phase-out by 2030, rapid renewables buildout, energy storage, and hydrogen-ready gas engines to cut emissions and lower LCOE by 34%, unlocking a resilient, flexible, low-cost power system by 2040.


Key Points

Plan to phase out coal by 2030 and gas by 2040, scaling renewables, storage, and hydrogen to cut LCOE and emissions.

✅ Coal out by 2030; gas phased 2040 with hydrogen-ready engines

✅ Add 19 GW/yr renewables; 30 GW storage by 2040

✅ 34% lower LCOE, 23% fewer emissions vs slower path


Germany can achieve significant reductions in emissions and the cost of electricity by phasing out coal in 2030 under its coal phase-out plan but must have a clear plan to ramp up renewables and pivot to sustainable fuels in order to achieve net-zero, according to a new whitepaper from Wartsila.

The modelling, published in Wärtsilä new white paper ‘Achieving net-zero power system in Germany by 2040’, compares the current plan to phase out coal by 2030 and gas by 2045 with an accelerated plan, where gas is phased out by 2040. By accelerating the path to net-zero, Germany can unlock a 34% reduction in the levelised cost of energy, as well as a 23% reduction in the total emissions, or 562 million tonnes of carbon dioxide in real terms.

The modelling offers a clear, three-step roadmap to achieve net-zero: rapidly increase renewables, energy storage and begin future-proofing gas engines in this decade; phase out coal by 2030; and phase out gas by 2040, converting remaining engines to run on sustainable fuels.

The greatest rewards are available if Germany front-loads decarbonisation. This can be done by rapidly increasing renewable capacity, adding 19 GW of wind and solar PV capacity per year. It must also add a total of 30GW of energy storage by 2040.

Håkan Agnevall, President and CEO of Wärtsilä Corporation said: “Germany stands on the precipice of a new, sustainable energy era. The new Federal Government has indicated its plans to consign coal to history by 2030. However, this is only step one. Our white paper demonstrates the need to implement a three-step roadmap to achieve net-zero. It is time to put a deadline on fossil fuels and create a clear plan to transition to sustainable fuels.”

While a rapid coal phase-out has been at the centre of recent climate policy debates, including the ongoing nuclear debate over Germany’s energy mix, the pathway to net-zero is less clear. Wärtsilä’s modelling shows that gas engines should be used to accelerate the transition by providing a short-term bridge to enable net zero and navigate the energy transition while balancing the intermittency of renewables until sustainable fuels are available at scale.

However, if Germany follows the slower pathway and reaches net-zero by 2045, it risks becoming reliant on gas as baseload power for much of the 2030s amid renewable expansion challenges that persist, potentially harming its ability to reach its climate goals. 

Creating the infrastructure to pivot to sustainable fuels is one of the greatest challenges facing the German system. The ability to convert existing capacity to run purely on hydrogen via hydrogen-ready power plants will be key to reaching net-zero by 2040 and unlocking the significant system-wide benefits on offer.

Jan Andersson, General Manager of Market Development in Germany, Wärtsilä Energy added: “To reach the 2040 target and unlock the greatest benefits, the most important thing that Germany can do is build renewables now. 19 GW is an ambitious target, but Germany can do it. History shows us that Germany has been able to achieve high levels of renewable buildout in previous years. It must now reach those levels consistently.

“Creating a clear plan which sets out the steps to net zero is essential. Renewable energy is inherently intermittent, so flexible energy capacity will play a vital role. While batteries provide effective short-term flexibility, gas is currently the only practical long-term option. If Germany is to unlock the greatest benefits from decarbonisation, it must have a clear plan to integrate sustainable fuel. From 2030, all new thermal capacity must run solely on hydrogen.”

Analysis of the last decade demonstrates that the rapid expansion of renewable energy is possible, and that renewables overtook coal and nuclear in generation. Previously, Germany has built large amounts of renewable capacity, including 8GW of solar PV in 2010 and 2011, 5.3 GW of onshore wind in 2017, and 2.5 GW of offshore wind in 2015.

The significant reductions in the cost of electricity demonstrated in the modelling are driven by the fact that renewables are far cheaper to run than coal or gas plants, even as coal still provides about a third of electricity in Germany. The initial capital investment is far outweighed by the ongoing operational expense of fossil fuel-based power.

As well as reducing emissions and costs, Germany’s rapid path to net-zero can also unlock a series of additional benefits. If coal is phased out by 2030 but capacity is not replaced by high levels of renewable energy, Germany risks becoming a significant energy importer, peaking at 162 TWh in 2035. The accelerated pathway would reduce imports by a third.

Likewise, more renewable energy will help to electrify district heating, meaning Germany can move away from carbon-intensive fuels sooner. If Germany follows the accelerated path, 57% of Germany’s heating could be electrified in 2045, compared to 10% under the slower plan.

Jan Andersson concluded: “The opportunities on offer are vast. Germany can provide the blueprint for net zero and galvanise an entire continent. Now is the time for the new government to seize the initiative.”


Related News

View more

Sign Up for Electricity Forum’s Newsletter

Stay informed with our FREE Newsletter — get the latest news, breakthrough technologies, and expert insights, delivered straight to your inbox.

Electricity Today T&D Magazine Subscribe for FREE

Stay informed with the latest T&D policies and technologies.
  • Timely insights from industry experts
  • Practical solutions T&D engineers
  • Free access to every issue

Download the 2025 Electrical Training Catalog

Explore 50+ live, expert-led electrical training courses –

  • Interactive
  • Flexible
  • CEU-cerified