EVs donÂ’t make sense in Canada

By Gwyn Morgan, former CEO of EnCana Corp.


NFPA 70e Training

Our customized live online or in‑person group training can be delivered to your staff at your location.

  • Live Online
  • 6 hours Instructor-led
  • Group Training Available
Regular Price:
$199
Coupon Price:
$149
Reserve Your Seat Today
Only one week after the much-hyped rollout of electric cars at the Los Angeles Auto Show, Canadian news media carried reports about how Ontario electricity costs are expected to double over the next 20 years.

That forecast must have Ontarians questioning whether buying an electric car is a good idea. But there are other questions all Canadians would be wise to ask about electric cars, and the electricity needed to power them.

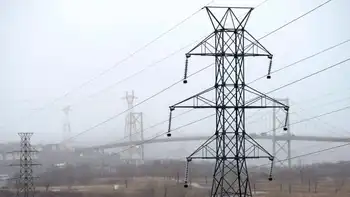
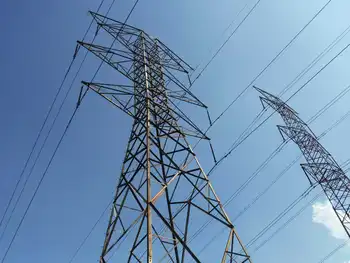
Even the staggering electricity rate increases announced by Ontario would not generate nearly enough power to handle a large auto-recharge load, nor could already stretched power grids handle it. In other provinces also, costly retooling of power generation, mainline transmission and local distribution grids would be required.

Wind and solar generate less than one per cent of Canada's power supply, and most provinces have subsidies aimed at increasing that portion. The most spectacular example of the skyrocketing cost of subsidies can be seen in Ontario, where the Liberal government forces consumers to pay 16 times as much for solar power, and three times more for wind, as the current average electricity rate.

Ontario's 20-year power plan calls for $23 billion in subsidies to the wind and solar industry, which supposedly would allow coal-fired power to be phased out. But its own numbers show that with wind and solar capacity available less than 30 per cent of the time, these costly projects still won't bring about the end of coal.

Meanwhile, electricity consumers will be hit with price increases of 46 per cent over the next five years, making Ontario industry uncompetitive with almost all provinces and American states.

Are electric cars really "green?" That depends on how the electricity is generated.

Water generates most of the electricity in Newfoundland and Labrador, Quebec, Manitoba and British Columbia, while Alberta and Saskatchewan generate nearly all power from coal and natural gas. Over all, about 75 per cent of Canada's electricity comes from water and nuclear power, and 25 per cent from fossil fuels.

When measured by fossil-fuel emissions, use of electric cars in Canada can generally be considered green.

Besides their high price tag, limited range and the inconvenience of long charging cycles, there's another factor Canadians need to consider before buying an electric car: our northern climate. Anyone who has had trouble starting a car in cold weather knows that battery performance plummets with temperature. In our dark, cold winters, we also need battery power to heat the car and run headlights. The combined result is a much shorter driving range than they'll be touting in the electric-car showroom.

The green-car race is imploding as beleaguered citizens, struggling to deal with tough economies, see their electricity rates soar and expensive wind and solar power missing in action when most needed. Other jurisdictions are rapidly changing direction, but Ontario keeps whistling merrily in the wind, bound for uncompetitive green oblivion.

Recently, U.S. Energy Secretary Steven Chu said the development of an electric-car battery to be competitive with the internal combustion engine might be five years away.

Related News

Thermal power plants’ PLF up on rising demand, lower hydro generation

India Coal Power PLF rose as capacity utilisation improved on rising peak demand and hydropower shortfall; thermal plants lifted plant load factor, IPPs lagged, and generation beat program targets amid weak rainfall and slower snowmelt.


Key Points

Coal plant load factor in India rose in May on higher demand and weak hydropower, with generation beating targets.

✅ PLF rose to 65.3% as demand climbed

✅ Hydel generation fell 14% YoY on poor rainfall

✅ IPP PLF at 57.8%, below 60% debt comfort


Capacity utilisation levels of coal-based power plants improved in May because of a surge in electricity demand and lower generation from hydroelectric sources. The plant load factor (PLF) of thermal power plants went up to 65.3% in the month, 1.7 percentage points higher than the year-ago period.

While PLFs of central and state government-owned plants were 75.5% and 64.5%, respectively, the same for independent power producers (IPPs) stood at 57.8%, even as coal and electricity shortages eased across the market. Though PLFs of IPPs were higher than May 2017 levels, it failed to cross the 60% mark, which eases debt servicing capabilities of power generation assets.

Thermal power plants generated 96,580 million units (MU) in May, 4% more than the programme set for the month and 5.2% higher than last year, partly supported by higher imported coal volumes in the market. On the other hand, hydel plants produced 10,638 MU, 10% lower than the target, reflecting a 14% decline from last year.

#google#

Peak demand of power on the last day of the month was 1,62,132 MW, 4.3% higher than the demand registered in the same day a year ago, underscoring India's position as the third-largest electricity producer globally.

According to sources, hydropower plants have been generating lesser than expected electricity due to inadequate rainfall and snow melting at a slower pace than previous years, even as the US reported a power generation jump year on year. Data for power generation from renewable sources have not been made available yet.


Related News

View more

Net-zero roadmap can cut electricity costs by a third in Germany - Wartsila

Germany net-zero roadmap charts coal phase-out by 2030, rapid renewables buildout, energy storage, and hydrogen-ready gas engines to cut emissions and lower LCOE by 34%, unlocking a resilient, flexible, low-cost power system by 2040.


Key Points

Plan to phase out coal by 2030 and gas by 2040, scaling renewables, storage, and hydrogen to cut LCOE and emissions.

✅ Coal out by 2030; gas phased 2040 with hydrogen-ready engines

✅ Add 19 GW/yr renewables; 30 GW storage by 2040

✅ 34% lower LCOE, 23% fewer emissions vs slower path


Germany can achieve significant reductions in emissions and the cost of electricity by phasing out coal in 2030 under its coal phase-out plan but must have a clear plan to ramp up renewables and pivot to sustainable fuels in order to achieve net-zero, according to a new whitepaper from Wartsila.

The modelling, published in Wärtsilä new white paper ‘Achieving net-zero power system in Germany by 2040’, compares the current plan to phase out coal by 2030 and gas by 2045 with an accelerated plan, where gas is phased out by 2040. By accelerating the path to net-zero, Germany can unlock a 34% reduction in the levelised cost of energy, as well as a 23% reduction in the total emissions, or 562 million tonnes of carbon dioxide in real terms.

The modelling offers a clear, three-step roadmap to achieve net-zero: rapidly increase renewables, energy storage and begin future-proofing gas engines in this decade; phase out coal by 2030; and phase out gas by 2040, converting remaining engines to run on sustainable fuels.

The greatest rewards are available if Germany front-loads decarbonisation. This can be done by rapidly increasing renewable capacity, adding 19 GW of wind and solar PV capacity per year. It must also add a total of 30GW of energy storage by 2040.

Håkan Agnevall, President and CEO of Wärtsilä Corporation said: “Germany stands on the precipice of a new, sustainable energy era. The new Federal Government has indicated its plans to consign coal to history by 2030. However, this is only step one. Our white paper demonstrates the need to implement a three-step roadmap to achieve net-zero. It is time to put a deadline on fossil fuels and create a clear plan to transition to sustainable fuels.”

While a rapid coal phase-out has been at the centre of recent climate policy debates, including the ongoing nuclear debate over Germany’s energy mix, the pathway to net-zero is less clear. Wärtsilä’s modelling shows that gas engines should be used to accelerate the transition by providing a short-term bridge to enable net zero and navigate the energy transition while balancing the intermittency of renewables until sustainable fuels are available at scale.

However, if Germany follows the slower pathway and reaches net-zero by 2045, it risks becoming reliant on gas as baseload power for much of the 2030s amid renewable expansion challenges that persist, potentially harming its ability to reach its climate goals. 

Creating the infrastructure to pivot to sustainable fuels is one of the greatest challenges facing the German system. The ability to convert existing capacity to run purely on hydrogen via hydrogen-ready power plants will be key to reaching net-zero by 2040 and unlocking the significant system-wide benefits on offer.

Jan Andersson, General Manager of Market Development in Germany, Wärtsilä Energy added: “To reach the 2040 target and unlock the greatest benefits, the most important thing that Germany can do is build renewables now. 19 GW is an ambitious target, but Germany can do it. History shows us that Germany has been able to achieve high levels of renewable buildout in previous years. It must now reach those levels consistently.

“Creating a clear plan which sets out the steps to net zero is essential. Renewable energy is inherently intermittent, so flexible energy capacity will play a vital role. While batteries provide effective short-term flexibility, gas is currently the only practical long-term option. If Germany is to unlock the greatest benefits from decarbonisation, it must have a clear plan to integrate sustainable fuel. From 2030, all new thermal capacity must run solely on hydrogen.”

Analysis of the last decade demonstrates that the rapid expansion of renewable energy is possible, and that renewables overtook coal and nuclear in generation. Previously, Germany has built large amounts of renewable capacity, including 8GW of solar PV in 2010 and 2011, 5.3 GW of onshore wind in 2017, and 2.5 GW of offshore wind in 2015.

The significant reductions in the cost of electricity demonstrated in the modelling are driven by the fact that renewables are far cheaper to run than coal or gas plants, even as coal still provides about a third of electricity in Germany. The initial capital investment is far outweighed by the ongoing operational expense of fossil fuel-based power.

As well as reducing emissions and costs, Germany’s rapid path to net-zero can also unlock a series of additional benefits. If coal is phased out by 2030 but capacity is not replaced by high levels of renewable energy, Germany risks becoming a significant energy importer, peaking at 162 TWh in 2035. The accelerated pathway would reduce imports by a third.

Likewise, more renewable energy will help to electrify district heating, meaning Germany can move away from carbon-intensive fuels sooner. If Germany follows the accelerated path, 57% of Germany’s heating could be electrified in 2045, compared to 10% under the slower plan.

Jan Andersson concluded: “The opportunities on offer are vast. Germany can provide the blueprint for net zero and galvanise an entire continent. Now is the time for the new government to seize the initiative.”


Related News

View more

Alberta Electricity market needs competition

Alberta Electricity Market faces energy-only vs capacity debate as transmission, distribution, and administration fees surge; rural rates rise amid a regulated duopoly of investor-owned utilities, prompting calls for competition, innovation, and lower bills.


Key Points

Alberta's electricity market is an energy-only system with rising delivery charges and limited rural competition.

✅ Energy-only design; capacity market scrapped

✅ Delivery charges outpace energy on monthly bills

✅ Rural duopoly limits competition and raises rates


Last week, Alberta’s new Energy Minister Sonya Savage announced the government, through its new electricity rules, would be scrapping plans to shift Alberta’s electricity to a capacity market and would instead be “restoring certainty in the electricity system.”


The proposed transition from energy only to a capacity market is a contentious subject as a market reshuffle unfolds across the province that many Albertans probably don’t know much about. Our electricity market is not a particularly glamorous subject. It’s complicated and confusing and what matters most to ordinary Albertans is how it affects their monthly bills.


What they may not realize is that the cost of their actual electricity used is often just a small fraction of their bill amid rising electricity prices across the province. The majority on an average electricity bill is actually the cost of delivering that electricity from the generator to your house. Charges for transmission, distribution and franchise and administration fees are quickly pushing many Alberta households to the limit with soaring bills.


According to data from Alberta’s Utilities Consumer Advocate (UCA), and alongside policy changes, in 2004 the average monthly transmission costs for residential regulated-rate customers was below $2. In 2018 that cost was averaging nearly $27 a month. The increase is equally dramatic in distribution rates which have more than doubled across the province and range wildly, averaging from as low as $10 a month in 2004 to over $80 a month for some residential regulated-rate customers in 2018.


Where you live determines who delivers your electricity. In Alberta’s biggest cities and a handful of others the distribution systems are municipally owned and operated. Outside those select municipalities most of Alberta’s electricity is delivered by two private companies which operate as a regulated duopoly. In fact, two investor-owned utilities deliver power to over 95 per cent of rural Alberta and they continue to increase their share by purchasing the few rural electricity co-ops that remained their only competition in the market. The cost of buying out their competition is then passed on to the customers, driving rates even higher.


As the CEO of Alberta’s largest remaining electricity co-op, I know very well that as the price of materials, equipment and skilled labour increase, the cost of operating follows. If it costs more to build and maintain an electricity distribution system there will inevitably be a cost increase passed on to the consumer. The question Albertans should be asking is how much is too much and where is all that money going with these private- investor-owned utilities, as the sector faces profound change under provincial leadership?


The reforms to Alberta’s electricity system brought in by Premier Klein in the late 1900s and early 2000s contributed to a surge in investment in the sector and led to an explosion of competition in both electricity generation and retail. 


More players entered the field which put downward pressure on electricity rates, encouraged innovation and gave consumers a competitive choice, even as a Calgary electricity retailer urged the government to scrap the overhaul. But the legislation and regulations that govern rural electricity distribution in Alberta continue to facilitate and even encourage the concentration of ownership among two players which is certainly not in the interests of rural Albertans.


It is also not in the spirit of the United Conservative Party platform commitment to a “market-based” system. A market-based system suggests more competition. Instead, what we have is something approaching a monopoly for many Albertans. The UCP promised a review of the transition to a capacity market that would determine which market would be best for Alberta, and through proposed electricity market changes has decided that we will remain an energy-only market.
Consumers in rural Alberta need electricity to produce the goods that power our biggest industries. Instead of regulating and approving continued rate increases from private multinational corporations, we need to drive competition and innovation that can push rates down and encourage growth and investment in rural-based industries and communities.


Related News

View more

Are we ready for electric tractors?

Electric tractors are surging, with battery-powered models, grid-tethered JD GridCON, and solar-charged designs delivering autonomous guidance, high efficiency, low maintenance, quiet operation, robust PTO compatibility, and durability for sustainable, precision agriculture.


Key Points

Electric tractors use battery or grid power to run implements with high efficiency, low noise, and minimal maintenance.

✅ Battery, grid-tethered, or solar-charged power options

✅ Lower operating costs, reduced noise, fewer moving parts

✅ Autonomous guidance, PTO compatibility, and quick charging


Car and truck manufacturers are falling off the fossil fuel bandwagon in droves and jumping on the electric train.

Now add tractors to that list.

Every month, another e-tractor announcement comes across our desks. Environmental factors drive this trend, along with energy efficiency, lower maintenance, lower noise level and motor longevity, and even autonomous weed-zapping robots are emerging.

Let’s start with the Big Daddy of them all, the 400 horsepower JD GridCON. This tractor is not a hybrid and it has no hassle with batteries. The 300 kilowatts of power come to the GridCON through a 1,000 metre extension cord connected to the grid, including virtual power plants or an off-field generator. A reel on the tractor rolls the cable in and out. The cable is guided by a robotic arm to prevent the tractor from running over it.

It uses a 700 volt DC bus for electric power distribution onboard and for auxiliary implements. It uses a cooling infrastructure for off-board electrical use. Total efficiency of the drive train is around 85 percent. A 100 kilowatt electric motor runs the IVT transmission. There’s an auxiliary outlet for implements powered by an electric motor up to 200 kW.

GridCON autonomously follows prescribed routes in the field at speeds up to 12 m.p.h., leveraging concepts similar to fleet management solutions for coordination. It can also be guided manually with a remote control when manoeuvring the tractor to enter a field. Empty weight is 8.5 tonnes, which is about the same as a 6195R but with double the power. Deere engineers say it will save about 50 percent in operating costs compared to battery powered tractors.

Solectrac
Two California-built all-battery powered tractors are finally in full production. While the biggest is only 40 horsepower, these are serious tractors that may foretell the future of farm equipment.

The all-electric 40 h.p. eUtility tractor is based on a 1950s Ford built in India. Solectrac is able to buy the bare tractor without an engine, so it can create a brand new electric tractor with no used components for North American customers. One tractor has already been sold to a farmer in Ontario. | Solectrac photo
The tractors are built by Solectrac, owned by inventor Steve Heckeroth, who has been doing electric conversions on cars, trucks, race cars and tractors for 25 years. He said there are three main reasons to take electric tractors seriously: simplicity, energy efficiency and longevity.

“The electric motor has only one moving part, unlike small diesel engines, which have over 300 moving parts,” Heckeroth said, adding that Solectrac tractors are not halfway compromise hybrids but true electric machines that get their power from the sun or the grid, particularly in hydro-rich regions like Manitoba where clean electricity is abundant, whichever is closest.

Neither tractor uses hydraulics. Instead, Heckeroth uses electric linear actuators. The ones he installs provide 1,000 pounds of dynamic load and 3,000 lb. static loads. He uses linear actuators because they are 20 times more efficient than hydraulics.

The eUtility and eFarmer are two-wheel drive only, but engineers are working on compact four-wheel drive electric tractors. Each tractor carries a price tag of US$40,000. Because production numbers are still limited, both tractors are available on a first to deposit basis. One e-tractor has already been sold and delivered to a farmer in Ontario.

The eUtility is a 40 h.p. yard tractor that accepts all Category 1, 540 r.p.m. power take-off implements on the rear three-point hitch, except those requiring hydraulics. An optional hydraulic pump can be installed for $3,000 for legacy implements that require hydraulics. For that price, a dedicated electricity believer might instead consider converting the implement to electric.

“The eUtility is actually a converted new 1950s Ford tractor made in a factory in India that was taken over after the British were kicked out in 1948,” Heckeroth said.

“I am able to buy only the parts I need and then add the motor, controller and batteries. I had to go to India because it’s one of the few places that still makes geared transmissions. These transmissions work the best for electric tractors. Gear reduction is necessary to keep the motor in the most efficient range of about 2,000 r.p.m. It has four gears with a high and low range, which covers everything from creep to 25 m.p.h.

On his eUtility, a single 30 kWh onboard battery pack provides five to eight hours of run time, depending on loads. It can carry two battery packs. The Level 2 quick charge gives an 80 percent charge for one pack in three hours. Two packs can receive a full charge overnight with support from home batteries like Powerwall for load management.

The integrated battery management system protects the batteries during charging and discharging, while backup fuel cell chargers can keep storage healthy in remote deployments. Batteries are expected to last about 10 years, depending on the number of operating cycles and depth of discharge.

Exchangeable battery packs are available to keep the tractor running through the full work day. These smaller 20 kWh packs can be mounted on the rear hitch to balance the weight of the optional front loader or carried in the optional front loader to balance the weight of heavy implements mounted on the rear hitch.

The second tractor is the 20 kWh eFarmer, which features high visibility for row crop farms at a fraction of the cost of diesel fuel tractors. The 30 h.p. eFarmer is basically just a tube frame with the necessary components attached. A simple joystick controls steering, speed and brakes.

Harvest
Introduced to the North American public this spring by Motivo Engineering in California, the Harvest tractor is simply a big battery on wheels. The complex electrical system takes power in through a variety of renewable energy sources, such as solar panels with smart solar inverters enabling optimized PV integration, water wheels, wind turbines or even intermittent electrical grids. It stores electrical power on-board and delivers it when and where required, putting power out to a large number of electrical tools and farm implements. It operates in AC or DC modes.


Related News

View more

Saudis set to 'boost wind by over 6GW'

Saudi Arabia Wind Power Market set to lead the Middle East, driven by Vision 2030 renewables goals, REPDO tenders, and PIF backing, adding 6.2GW wind capacity by 2028 alongside solar PV diversification.


Key Points

It is the emerging national segment leading Middle East wind growth, targeting 6.2GW by 2028 under Vision 2030 policies.

✅ Adds 6.2GW, 46% of regional wind capacity by 2028

✅ REPDO tenders and PIF funding underpin pipeline

✅ Targets: 16GW wind, 40GW solar under Vision 2030


Saudi Arabia will become a regional heavyweight in the Middle East's wind power market adding over 6GW in the next 10 years, according to new research by Wood Mackenzie Power & Renewables.

The report – 'Middle East Wind Power Market Outlook, 2019-2028’ – said developers will build 6.2GW of wind capacity in the country or 46% of the region’s total wind capacity additions between 2019 and 2028.

Wood Mackenzie Power & Renewables senior analyst Sohaib Malik said: “The integration of renewables in Vision 2030’s objectives underlines strong political commitment within Saudi Arabia.

“The level of Saudi ambition for wind and solar PV varies significantly, despite the cost parity between both technologies during the first round of tenders in 2018.”

Saudi Arabia has set a 16GW target for wind by 2030 and 40GW for solar, plans to solicit 60 GW of clean energy over the next decade, Wood Mackenzie added.

“Moving forward, the Renewable Energy Project Development Office will award 850MW of wind capacity in 2019, which is expected to be commissioned in 2021-2022, and increase the local content requirement in future tendering rounds,” Malik said.

However, Saudi Arabia will fall short of its current 2030 renewables target, despite growth projections and regional leadership, the report said.

Some 70% of the renewables capacity target is to be supported by the Public Investment Fund (PIF), the Saudi sovereign wealth fund, while the remaining capacity is to be awarded through REPDO.

“A central concern is the PIF’s lack of track record in the renewables sector and its limited in-house sectoral expertise,” said Malik

“REPDO, on the other hand, completed two renewables request for proposals after pre-developing the sites,” he said.

PIF is estimated to have $230bn of assets – targeted to reach $2 trillion under Vision 2030 – driven by investments in a variety of sectors ranging from electric vehicles to public infrastructure, Wood Mackenzie said.

“There is little doubt about the fund’s financial muscle, however, its past investment strategy focused on established firms in traditional industries,” Malik added.

“Aspirations to develop a value chain for wind and PV technologies locally is a different ball game and requires the PIF to acquire new capabilities for effective oversight of these ventures,” he said.

The report noted that regional volatility is expected to remain, with strong positive growth, driven by Jordan and Iran in 2018 expected to reverse in 2019, and policy shifts, as in Canada’s scaled-back projections, can influence outcomes.

Post-2020 Wood Mackenzie Power & Renewables sees regional demand returning to steady growth as global renewables set more records elsewhere.

“In 2018, developers added 185MW and 63MW of wind capacity in Jordan and Iran, respectively, compared to 53MW of capacity across the entire region in 2017, following a record year for renewables in 2016,” said Malik.

“The completion of the 89MW Al Fujeij and the 86MW Al Rajef projects in 2018 indicates that Jordan has 375MW of the region’s operational 675MW wind capacity.

“Iran followed with 278MW of installed capacity at the end of 2018. A slowdown in 2019 is expected, as project development activity softens in Iran.

“Additionally, delays in awarding the 400MW Dumat Al Jandal project in Saudi Arabia will limit annual capacity additions to 184MW.”

He added that a maturing project pipeline in the region supports the 2020-2021 outlook, even as wind power grew despite Covid-19 globally.

“Saudi Arabian demand serves as the foundation for regional demand. Regional demand diversification is also occurring, with Lebanon set to add 200-400MW to its existing permitted capacity pipeline of 202MW in 2019,” he said

“These developments pave the way for the addition of 2GW of wind capacity between 2019 and 2021.”

Wood Mackenzie Power & Renewables added that the outlook for solar in the region is “much more positive” than wind.

“Compared to only 6GW of wind power capacity, developers will add 53GW of PV capacity through 2024,” said Malik.

He added: “Solar PV, supported by trends such as China’s rapid PV growth in 2016, has become a natural choice for many countries in the region, which is endowed with world class solar energy resources.

“The increased focus on solar energy is demonstrated by ambitious PV targets across the region.”


Related News

View more

U.S. Electricity and natural gas prices explained

Energy Pricing Factors span electricity generation, transmission, and distribution costs, plus natural gas supply-demand, renewables, seasonal peaks, and wholesale pricing effects across residential, commercial, and industrial customers, usage patterns, weather, and grid constraints.


Key Points

They are the costs and market forces driving electricity and natural gas prices, from generation to delivery and demand.

✅ Generation, transmission, distribution shape electricity rates

✅ Gas prices hinge on supply, storage, imports/exports

✅ Demand shifts: weather, economy, and fuel alternatives


There are a lot of factors that affect energy prices globally. What’s included in the price to heat homes and supply them with electricity may be a lot more than some people may think.

Electricity
Generating electricity is the largest component of its price, according to the U.S. Energy Information Administration (EIA). Generation accounts for 56% of the price of electricity, while distribution and transmission account for 31% and 13% respectively.

Homeowners and businesses pay more for electricity than industrial companies, and U.S. electricity prices have recently surged, highlighting broader inflationary pressures. This is because industrial companies can take electricity at higher voltages, reducing transmission costs for energy companies.

“Industrial consumers use more electricity and can receive it at higher voltages, so supplying electricity to these customers is more efficient and less expensive. The price of electricity to industrial customers is generally close to the wholesale price of electricity,” EIA explains.

NYSEG said based on the average use of 600 kilowatt-hours per month, its customers spent the most money on delivery and transition charges in 2020, 57% or about $42, and residential electricity bills increased 5% in 2022 after inflation, according to national data. They also spent on average 35% (~$26) on supply charges and 8% (~$6) on surcharges.

Electricity prices are usually higher in the summer. Why? Because energy companies use sources of electricity that cost more money. It used to be that renewable sources, like solar and wind, were the most expensive sources of energy but increased technological advances have changed this, according to the International Energy Agency’s 2021 World Energy Outlook.

“In most markets, solar PV or wind now represents the cheapest available source of new electricity generation. Clean energy technology is becoming a major new area for investment and employment – and a dynamic arena for international collaboration and competition,” the report said.

Natural gas
The price of natural gas is driven by supply and demand. If there is more supply, prices are generally lower. If there is not as much supply, prices are generally higher the EIA explains. On the other side of the equation, more demand can also increase the price and less demand can decrease the price.

High natural gas prices mean people turn their home thermostats down a few degrees to save money, so the EIA said reduced demand can encourage companies to produce more natural gas, which would in turn help lower the cost. Lower prices will sometimes cause companies to reduce their production, therefore causing the price to rise.

The three major supply factors that affect prices: the amount of natural gas produced, how much is stored, and the volume of gas imported and exported. The three major demand factors that affect price are: changes in winter/summer weather, economic growth, and the broader energy crisis dynamics, as well as how much other fuels are available and their price, said EIA.

To think the price of natural gas is higher when the economy is thriving may sound counterintuitive but that’s exactly what happens. The EIA said this is because of increases in demand.


Related News

View more

Sign Up for Electricity Forum’s Newsletter

Stay informed with our FREE Newsletter — get the latest news, breakthrough technologies, and expert insights, delivered straight to your inbox.

Electricity Today T&D Magazine Subscribe for FREE

Stay informed with the latest T&D policies and technologies.
  • Timely insights from industry experts
  • Practical solutions T&D engineers
  • Free access to every issue

Download the 2025 Electrical Training Catalog

Explore 50+ live, expert-led electrical training courses –

  • Interactive
  • Flexible
  • CEU-cerified