Denmark 2019 electricity CO2 intensity shows record-low emissions as renewable energy surges, wind power dominates, offshore wind expands, and coal phase-out accelerates Denmark's energy transition and grid decarbonization, driven by higher CO2 prices and flexibility.
Key Points
It is 135 g CO2/kWh, a record low enabled by wind power growth, offshore wind, and a sharp coal decline.
✅ Average emissions fell to 135 g CO2/kWh, the lowest on record
✅ Wind and solar supplied 49.9% of national electricity use
✅ Coal consumption dropped 46% as CO2 allowance prices rose
Danish electricity producers set a new green record in 2019, when an average produced kilowatt-hour emitted 135 gr CO2 / kWh.
It is the lowest CO2 emission ever measured in Denmark and about one-seventh of what the electricity producers emitted in 1990.
Never has a kilowatt-hour produced emitted as little CO2 as it did in 2019. And that's according to Energinet's recently published annual Environmental Report on Danish electricity generation and cogeneration, two primary causes.
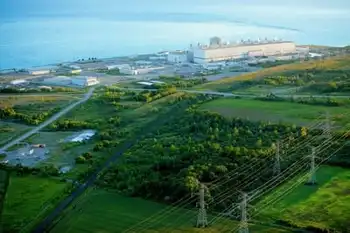
One reason is that more green power has been produced because the Horns Rev 3 offshore wind farm, which can produce electricity for 425,000 households, was commissioned in 2019. The other is that Danish coal consumption fell by 46 percent from 2018 to 2019, as coal phase-out plans gathered pace across the sector. the dramatic decline in coal consumption is partly due a significant increase in the price of CO2 quotas, and thus also the price of CO2 emissions.
'Historically, 135 gr CO2 / kWh is a really, really low figure, showing the impressive green travel that the Danish electricity system has been on. In 1990, a kilowatt-hour produced emitted over 1000 grams of CO2, ie about seven times as much as today, 'says Hanne Storm Edlefsen, area manager in Energinet Power Systems Responsibility.
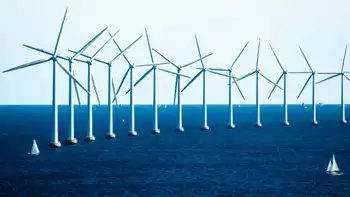
Wind energy is the dominant form of electricity generation in Denmark, a pattern the UK wind beat coal in 2016 when shifting away from fossil fuels.
17.1 TWh. Danish wind turbines and solar cells generated so much electricity in 2019, corresponding to 49.9 per cent. of Danish electricity consumption, reflecting broader EU wind and solar growth trends as well. An increase of 15 per cent. The wind turbines alone produced 16 TWh, which is not only a new green record, but also puts a thick line that wind energy is by far the most dominant form of electricity generation in Denmark.
'Thanks to our large wind resources, turbines are by far the largest supplier of renewable energy in Denmark, and this will be for many years to come. The large price drop in new wind energy in recent years - for both onshore and offshore winds - will ensure that wind energy will drive a large part of the growth in renewable energy in the coming years, as new wind generation records are set in markets like the UK, 'says Soren Klinge, electricity market manager at Wind Denmark.
Conversely, total electricity generation from fossil and bio-based fuels decreased by 26 PJ (petajoule ed.), Corresponding to 34 per cent. from 2018 to 2019, mirroring renewables overtaking coal in Germany. Nevertheless, net electricity generation was just under 30 TWh both years.
'It is worth noting that while fossil fuels are being phased out, Denmark maintains its annual net production of electricity. The green, so to speak, replaces the black. It once again underpins that green conversion, high security of supply and an affordable electricity price can go hand in hand, 'says Hanne Storm Edlefsen.
Danish power system is ready for a green future
Including trade in electricity with neighboring countries, 1 kWh in a Danish outlet generates 145 gr CO2 / kWh.
'There has been a very significant development in the Danish electricity system in recent years, where the electricity system can now be operated solely on the renewable energy. It is a remarkable development, also from an international perspective where low-carbon progress stalled in the UK in 2019, that one would not have thought possible for just a few years ago, 'he says.
More than expected have phased out coal
The electricity from the Danish sockets will be greener , predicts Energinet's environmental report , which expects CO2 intensity in the coming years. This is explained by an expectation of increased electrification of energy consumption, together with a continued expansion with wind and solar.
'Wind energy is the cornerstone of the green transition. With the commissioning of the Kriegers Flak offshore wind farm and several major onshore wind turbine projects within the next few years, we can well expect that only the wind's share of electricity consumption will exceed 50 per cent hopefully as early as 2021,' concludes Soren Klinge.
Related News