Utility towers protested in Santa Clarita

By LA Daily News


NFPA 70e Training

Our customized live online or in‑person group training can be delivered to your staff at your location.

  • Live Online
  • 6 hours Instructor-led
  • Group Training Available
Regular Price:
$199
Coupon Price:
$149
Reserve Your Seat Today
From his home in the Belcaro senior housing development, Brian Smith can see the 200-foot-plus steel tower from his backyard, from inside his home and outside his garage.

"I feel like I am living in an industrial center, not a suburban, residential environment," said Smith, 64.

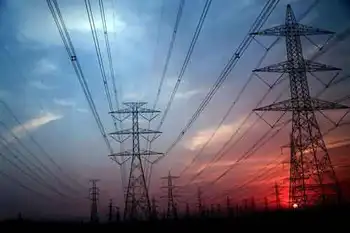
Smith is one of more than 100 seniors who are fighting with Southern California Edison to have the towers removed and replaced with smaller, less obtrusive poles.

The structures are far larger, they say, than what they expected Edison would build when state officials first approved the project.

But it's a request Edison says it can't fill because the smaller tubular steel poles just aren't feasible in the area.

More than 100 residents staged a rally inside their gated community to protest the towers.

Santa Clarita Mayor Bob Kellar and Los Angeles County Supervisor Michael Antonovich fired off a letter to Edison's chairman and chief executive officer, Alan J. Fohrer, asking that the towers be removed.

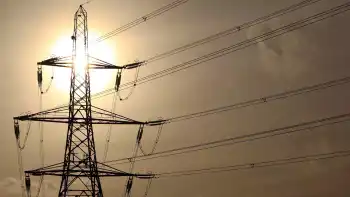
"The lattice steel towers create significant visual blight and are in direct contrast to commitments made by (Edison) to the residents of the Santa Clarita Valley," according to the letter.

But Southern California Edison spokesman Steve Conroy said no such commitments were made to the Santa Clarita community.

The poles were an option, he said, but they won't work.

"The steel tubular poles were not technically feasible in order to complete this project to meet reliability and engineering design criteria associated with a project of this scale," Conroy said.

The project — called the Antelope-Pardee Transmission Line Project — will eventually transmit power generated by wind and solar projects from Tehachapi to the Inland Empire.

When the California Public Utilities Commission approved the project in 2007, it specified that Edison would use the poles in Santa Clarita, unless the company could show it wasn't feasible, said Andrew Kotch, a commission spokesman.

Last January, Edison submitted a report to the commission declaring that the poles weren't feasible and the commission allowed the towers to be used in Santa Clarita, Kotch said.

Hunt Braly, an attorney for the Belcaro residents, says the commission's staff approved the towers with no peer review and no independent engineering study.

Plus, the citizens, who had relied on the belief that poles would be used, were not notified, Braly said. In an April letter from Edison notifying residents about impending construction, there was no mention of the type of structures that would be built, he said.

"They don't know until the monstrosities begin to be built, which is about a month ago," Braly said.

Belcaro homeowners talk about little else, said 72-year-old resident Maynard Davis.

Davis says he can see several towers from his home.

"It has taken over our lives here," he said. "Absolutely."

He and his wife Judy moved from Burbank about four years ago and invested their life savings into their Santa Clarita home, in the hopes of leaving a nest egg for their children and grandchildren. Now, he says, no one will buy his home.

"That's our legacy," Davis said. "And, it's gone."

Related News

Physicists Just Achieved Conduction of Electricity at Close to The Speed of Light

Attosecond Electron Transport uses ultrafast lasers and single-cycle light pulses to drive tunneling in bowtie gold nanoantennas, enabling sub-femtosecond switching in optoelectronic nanostructures and surpassing picosecond silicon limits for next-gen computing.


Key Points

A light-driven method that manipulates electrons with ultrafast pulses to switch currents within attoseconds.

✅ Uses single-cycle light pulses to drive electron tunneling

✅ Achieves 600 attosecond current switching in nano-gaps

✅ Enables optoelectronic, plasmonic devices beyond silicon


When it comes to data transfer and computing, the faster we can shift electrons and conduct electricity the better – and scientists have just been able to transport electrons at sub-femtosecond speeds (less than one quadrillionth of a second) in an experimental setup.

The trick is manipulating the electrons with light waves that are specially crafted and produced by an ultrafast laser. It might be a long while before this sort of setup makes it into your laptop, but similar precision is seen in noninvasive interventions where targeted electrical stimulation can boost short-term memory for limited periods, and the fact they pulled it off promises a significant step forward in terms of what we can expect from our devices.

Right now, the fastest electronic components can be switched on or off in picoseconds (trillionths of a second), a pace that intersects with debates over 5G electricity use as systems scale, around 1,000 times slower than a femtosecond.

With their new method, the physicists were able to switch electric currents at around 600 attoseconds (one femtosecond is 1,000 attoseconds).

"This may well be the distant future of electronics," says physicist Alfred Leitenstorfer from the University of Konstanz in Germany. "Our experiments with single-cycle light pulses have taken us well into the attosecond range of electron transport."

Leitenstorfer and his colleagues were able to build a precise setup at the Centre for Applied Photonics in Konstanz. Their machinery included both the ability to carefully manipulate ultrashort light pulses, and to construct the necessary nanostructures, including graphene architectures, where appropriate.

The laser used by the team was able to push out one hundred million single-cycle light pulses every single second in order to generate a measurable current. Using nanoscale gold antennae in a bowtie shape (see the image above), the electric field of the pulse was concentrated down into a gap measuring just six nanometres wide (six thousand-millionths of a metre).

As a result of their specialist setup and the electron tunnelling and accelerating it produced, the researchers could switch electric currents at well under a femtosecond – less than half an oscillation period of the electric field of the light pulses.

Getting beyond the restrictions of conventional silicon semiconductor technology has proved a challenge for scientists, but using the insanely fast oscillations of light to help electrons pick up speed could provide new avenues for pushing the limits on electronics, as our power infrastructure is increasingly digitized and integrated with photonics.

And that's something that could be very advantageous in the next generation of computers: scientists are currently experimenting with the way that light and electronics could work together in all sorts of different ways, from noninvasive brain stimulation to novel sensors.

Eventually, Leitenstorfer and his team think that the limitations of today's computing systems could be overcome using plasmonic nanoparticles and optoelectronic devices, using the characteristics of light pulses to manipulate electrons at super-small scales, with related work even exploring electricity from snowfall under specific conditions.

"This is very basic research we are talking about here and may take decades to implement," says Leitenstorfer.

The next step is to experiment with a variety of different setups using the same principle. This approach might even offer insights into quantum computing, the researchers say, although there's a lot more work to get through yet - we can't wait to see what they'll achieve next.


Related News

View more

Independent power project announced by B.C. Hydro now in limbo

Siwash Creek Hydroelectric Project faces downsizing under a BC Hydro power purchase agreement, with run-of-river generation, high grid interconnection costs, First Nations partnership, and surplus electricity from Site C reshaping clean energy procurement.


Key Points

A downsized run-of-river plant in BC, co-owned by Kanaka Bar and Green Valley, selling power via a BC Hydro PPA.

✅ Approved at 500 kW under a BC Hydro clean-energy program

✅ Grid interconnection initially quoted at $2.1M

✅ Joint venture: Kanaka Bar and Green Valley Power


A small run-of-river hydroelectric project recently selected by B.C. Hydro for a power purchase agreement may no longer be financially viable.

The Siwash Creek project was originally conceived as a two-megawatt power plant by the original proponent Chad Peterson, who holds a 50-per-cent stake through Green Valley Power, with the Kanaka Bar Indian Band holding the other half.

The partners were asked by B.C. Hydro to trim the capacity back to one megawatt, but by the time the Crown corporation announced its approval, it agreed to only half that — 500 kilowatts — under its Standing Order clean-energy program.

“Hydro wanted to charge us $2.1 million to connect to the grid, but then they said they could reduce it if we took a little trim on the project,” said Kanaka Bar Chief Patrick Michell.

The revenue stream for the band and Green Valley Power has been halved to about $250,000 a year. The original cost of running the $3.7-million plant, including financing, was projected to be $273,000 a year, according to the Kanaka Bar economic development plan.

“By our initial forecast, we will have to subsidize the loan for 20 years,” said Michell. “It doesn’t make any sense.”

The Kanaka Band has already invested $450,000 in feasibility, hydrology and engineering studies, with a similar investment from Green Valley.

B.C. Hydro announced it would pursue five purchase agreements last March with five First Nations projects — including Siwash Creek — including hydro, solar and wind energy projects, as two new generating stations were being commissioned at the time. A purchase agreement allows proponents to sell electricity to B.C. Hydro at a set price.

However, at least ten other “shovel-ready” clean energy projects may be doomed while B.C. Hydro completes a review of its own operations and its place in the energy sector, where legal outcomes like the Squamish power project ruling add uncertainty, including B.C.’s future power needs.

With the 1,100-megawatt Site C Dam planned for completion in 2024, and LNG demand cited to justify it, B.C. Hydro now projects it will have a surplus of electricity until the early 2030s.

Even if British Columbians put 300,000 electric vehicles on the road over the next 12 years, amid BC Hydro’s first call for power, they will require only 300 megawatts of new capacity, the company said.

A long-term surplus could effectively halt all small-scale clean energy development, according to Clean Energy B.C., even as Hydro One’s U.S. coal plant remains online in the region.

“(B.C. Hydro) dropped their offer down to 500 kilowatts right around the time they announced their review,” said Michell. “So we filled out the paperwork at 500 kilowatts and (B.C. Hydro) got to make its announcement of five projects.”

In the new few weeks, Kanaka and Green Valley will discuss whether they can move forward with a new financial model or shelve the project, he said.

B.C. Hydro declined to comment on the rationale for downsizing Siwash Creek’s power purchase agreement.

The Kanaka Bar Band successfully operates a 49.9-megawatt run-of-river plant on Kwoiek Creek with partners Innergex Renewable Energy.


Related News

View more

Swiss Earthquake Service and ETH Zurich aim to make geothermal energy safer

Advanced Traffic Light System for Geothermal Safety models fracture growth and friction with rock physics, geophones, and supercomputers to predict induced seismicity during hydraulic stimulation, enabling real-time risk control for ETH Zurich and SED.


Key Points

ATLS uses rock physics, geophones, and HPC to forecast induced seismicity in real time during geothermal stimulation.

✅ Real-time seismic risk forecasts during hydraulic stimulation

✅ Uses rock physics, friction, and fracture modeling on HPC

✅ Supports ETH Zurich and SED field tests in Iceland and Bedretto


The Swiss Earthquake Service and ETH Zurich want to make geothermal energy safer, so news piece from Switzerland earlier this month. This is to be made possible by new software, including machine learning, and the computing power of supercomputers. The first geothermal tests have already been carried out in Iceland, and more will follow in the Bedretto laboratory.

In areas with volcanic activity, the conditions for operating geothermal plants are ideal. In Iceland, the Hellisheidi power plant makes an important contribution to sustainable energy use, alongside innovations like electricity from snow in cold regions.

Deep geothermal energy still has potential. This is the basis of the 2050 energy strategy. While the inexhaustible source of energy in volcanically active areas along fault zones of the earth’s crust can be tapped with comparatively little effort and, where viable, HVDC transmission used to move power to demand centers, access on the continents is often much more difficult and risky. Because the geology of Switzerland creates conditions that are more difficult for sustainable energy production.

Improve the water permeability of the rock

On one hand, you have to drill four to five kilometers deep to reach the correspondingly heated layers of earth in Switzerland. It is only at this depth that temperatures between 160 and 180 degrees Celsius can be reached, which is necessary for an economically usable water cycle. On the other hand, the problem of low permeability arises with rock at these depths. “We need a permeability of at least 10 millidarcy, but you can typically only find a thousandth of this value at a depth of four to five kilometers,” says Thomas Driesner, professor at the Institute of Geochemistry and Petrology at ETH Zurich.

In order to improve the permeability, water is pumped into the subsurface using the so-called “fracture”. The water acts against friction, any fracture surfaces shift against each other and tensions are released. This hydraulic stimulation expands fractures in the rock so that the water can circulate in the hot crust. The fractures in the earth’s crust originate from tectonic tensions, caused in Switzerland by the Adriatic plate, which moves northwards and presses against the Eurasian plate.

In addition to geothermal energy, the “Advanced Traffic Light System” could also be used in underground construction or in construction projects for the storage of carbon dioxide.

Quake due to water injection

The disadvantage of such hydraulic stimulations are vibrations, which are often so weak or cannot be perceived without measuring instruments. But that was not the case with the geothermal projects in St. Gallen 2013 and Basel 2016. A total of around 11,000 cubic meters of water were pumped into the borehole in Basel, causing the pressure to rise. Using statistical surveys, the magnitudes 2.4 and 2.9 defined two limit values ??for the maximum permitted magnitude of the earthquakes generated. If these are reached, the water supply is stopped.

In Basel, however, there was a series of vibrations after a loud bang, with a time delay there were stronger earthquakes, which startled the residents. In both cities, earthquakes with a magnitude greater than 3 have been recorded. Since then it has been clear that reaching threshold values ??determines the stop of the water discharge, but this does not guarantee safety during the actual drilling process.

Simulation during stimulation

The Swiss Seismological Service SED and the ETH Zurich are now pursuing a new approach that can be used to predict in real time, building on advances by electricity prediction specialists in Europe, during a hydraulic stimulation whether noticeable earthquakes are expected in the further course. This is to be made possible by the so-called “Advanced Traffic Light System” based on rock physics, a software developed by the SED, which carries out the analysis on a high-performance computer.

Geophones measure the ground vibrations around the borehole, which serve as indicators for the probability of noticeable earthquakes. The supercomputer then runs through millions of possible scenarios, similar to algorithms to prevent power blackouts during ransomware attacks, based on the number and type of fractures to be expected, the friction and tensions in the rock. Finally, you can filter out the scenario that best reflects the underground.

Further tests in the mountain

However, research is currently still lacking any real test facility for the system, because incorrect measurements must be eliminated and a certain data format adhered to before the calculations on the supercomputer. The first tests were carried out in Iceland last year, with more to follow in the Bedretto geothermal laboratory in late summer, where reliable backup power from fuel cell solutions can keep instrumentation running. An optimum can now be found between increasing the permeability of rock layers and an adequate water supply.

The new approach could make geothermal energy safer and ultimately help this energy source to become more accepted, while grid upgrades like superconducting cables improve efficiency. Research also sees areas of application wherever artificially caused earthquakes can occur, such as in underground mining or in the storage of carbon dioxide underground.


Related News

View more

Bitcoin mining uses so much electricity that 1 city could curtail facility's power during heat waves

Medicine Hat Bitcoin Mining Facility drives massive electricity demand and energy use, leveraging natural gas and nearby wind power; Hut 8 touts economic growth, while critics cite carbon emissions, renewables integration, and climate impact.


Key Points

A Hut 8 project in Alberta that mines bitcoin at scale, consuming up to 60 MW and impacting energy and emissions.

✅ Consumes more than 60 MW, rivaling citywide electricity use

✅ Sited by natural gas plant; wind turbines nearby

✅ Economic gains vs. carbon emissions and climate risks


On the day of the grand opening of the largest bitcoin mining project in the country, the weather was partly cloudy and 15 C. On a Friday afternoon like this one, the new facility uses as much electricity as all of Medicine Hat, Alta., a city of more than 60,000 people and home to several large industrial plants.

The vast amount of electricity needed for bitcoin mining is why the city of Medicine Hat has championed the economic benefits of the project, while environmentalists say they are wary of the significant energy use.

Toronto-based Hut 8 has spent more than $100 million to develop the 4½-hectare site on the northern edge of the city. It has 56 shipping containers, each filled with 180 computer servers that digitally mine for bitcoin around the clock.

The company said it has already mined more than 3,300 bitcoins in Alberta, including at its much smaller site in Drumheller. On average, the Medicine Hat facility mines about 20 bitcoins per day. The value of bitcoin can fluctuate daily, but has sold recently for around $9,000.

The bitcoin mining facility is located right beside the city of Medicine Hat's new natural gas-fired power plant and four wind turbines are a short distance away. The bitcoin plant can consume more than 60 megawatts of power, more than 10 times more electricity used by any other facility in the city, according to the mayor.

That's why, in the event of a summer heat wave, the city has provisions in place to pull the plug on the electricity it provides to Hut 8, mirroring utility pauses on crypto loads seen elsewhere, so there won't be any blackouts for residents, according to the mayor.

Still, some say the bitcoin mining industry wastes far too much energy

"It's a huge magnitude when you talk about the carbon emissions," said Saeed Kaddoura, an analyst with the Pembina Institute, an environmental think-tank. "Moving forward, there needs to be some consideration on what the environmental impact of this is."

Medicine Hat owns its own natural gas and electricity generation and distribution businesses. The city leases the land to Hut 8 and the facility employs 40 full-time workers. Add up the economic benefits and the city of Medicine Hat will receive a significant financial boost from the new project, says Ted Clugston, the city's mayor.

Financial details of the city's deal with Hut 8 are not disclosed.

For more than a century, the city has attracted business by offering low-cost energy, and the mayor said this project is no different.

"They could have gone anywhere in the world and they chose Medicine Hat," said Clugston. "[Hut 8] is not here for renewable energy because it is not reliable. They need gas-fired generation and we have it in spades."

Environmental groups are concerned by the sheer amount of energy consumed by bitcoin mining, with some utilities warning they can't serve new energy-intensive customers right now, especially in places like Medicine Hat where most of the electricity is produced by fossil fuels.

The bitcoin system is designed, so only a limited number of the cryptocurrency can be mined everyday. Over time, as more miners compete for a decreasing number of available bitcoins, facilities will have to use more electricity compared to the amount of the cryptocurrency they collect.

"The way the bitcoin algorithm works is that it's designed to waste as much electricity as possible. And the more popular bitcoin becomes, the more electricity it wastes," said Keith Stewart, a spokesperson for Greenpeace.

Stewart questions whether natural gas should be used to produce a digital product.

"If you live in Alberta, you want to have heat and light, those types of things. I don't think bitcoin is a necessity of life for anyone," he said.

The CEO of Hut 8 completely disagrees, arguing the cryptocurrency is essential.  

"Bitcoin was created during the financial crisis. It has really served a purpose in terms of providing the opportunity for people who don't necessarily trust their government or their central banks," said Andrew Kiguel.


Related News

View more

UK low-carbon electricity generation stalls in 2019

UK low-carbon electricity 2019 saw stalled growth as renewables rose slightly, wind expanded, nuclear output fell, coal hit record lows, and net-zero targets demand faster deployment to cut CO2 intensity below 100gCO2/kWh.


Key Points

Low-carbon sources supplied 54% of UK power in 2019, up just 1TWh; wind grew, nuclear fell, and coal dropped to 2%.

✅ Wind up 8TWh; nuclear down 9TWh amid outages

✅ Fossil fuels 43% of generation; coal at 2%

✅ Net-zero needs 15TWh per year added to 2030


The amount of electricity generated by low-carbon sources in the UK stalled in 2019, Carbon Brief analysis shows.

Low-carbon electricity output from wind, solar, nuclear, hydro and biomass rose by just 1 terawatt hour (TWh, less than 1%) in 2019. It represents the smallest annual increase in a decade, where annual growth averaged 9TWh. This growth will need to double in the 2020s to meet UK climate targets while replacing old nuclear plants as they retire.

Some 54% of UK electricity generation in 2019 came from low-carbon sources, including 37% from renewables and 20% from wind alone, underscoring wind's leading role in the power mix during key periods. A record-low 43% was from fossil fuels, with 41% from gas and just 2% from coal, also a record low. In 2010, fossil fuels generated 75% of the total.

Carbon Brief’s analysis of UK electricity generation in 2019 is based on figures from BM Reports and the Department for Business, Energy and Industrial Strategy (BEIS). See the methodology at the end for more on how the analysis was conducted.

The numbers differ from those published earlier in January by National Grid, which were for electricity supplied in Great Britain only (England, Wales and Scotland, but excluding Northern Ireland), including via imports from other countries.

Low-carbon low
In 2019, the UK became the first major economy to target net-zero greenhouse gas emissions by 2050, increasing the ambition of its legally binding Climate Change Act.

To date, the country has cut its emissions by around two-fifths since 1990, with almost all of its recent progress coming from the electricity sector.

Emissions from electricity generation have fallen rapidly in the decade since 2010 as coal power has been almost phased out and even gas output has declined. Fossil fuels have been displaced by falling demand and by renewables, such as wind, solar and biomass.

But Carbon Brief’s annual analysis of UK electricity generation shows progress stalled in 2019, with the output from low-carbon sources barely increasing compared to a year earlier.

The chart below shows low-carbon generation in each year since 2010 (grey bars) and the estimated level in 2019 (red). The pale grey bars show the estimated future output of existing low-carbon sources after old nuclear plants retire and the pale red bars show the amount of new generation needed to keep electricity sector emissions to less than 100 grammes of CO2 per kilowatt hour (gCO2/kWh), the UK’s nominal target for the sector.

 Annual electricity generation in the UK by fuel, terawatt hours, 2010-2019. Top panel: fuel by fuel. Bottom panel: cumulative total generation from all sources. Source: BEIS energy trends, BM Reports and Carbon Brief analysis. Chart by Carbon Brief using Highcharts.
As the chart shows, the UK will require significantly more low-carbon electricity over the next decade as part of meeting its legally binding climate goals.

The nominal 100gCO2/kWh target for 2030 was set in the context of the UK’s less ambitious goal of cutting emissions to 80% below 1990 levels by 2050. Now that the country is aiming to cut emissions to net-zero by 2050, that 100gCO2/kWh indicator is likely to be the bare minimum.

Even so, it would require a rapid step up in the pace of low-carbon expansion, compared to the increases seen over the past decade. On average, low-carbon generation has risen by 9TWh each year in the decade since 2010 – including a rise of just 1TWh in 2019.

Given scheduled nuclear retirements and rising demand expected by the Committee on Climate Change (CCC) – with some electrification of transport and heating – low-carbon generation would need to increase by 15TWh each year until 2030, just to meet the benchmark of 100gCO2/kWh.

For context, the 3.2 gigawatt (GW) Hinkley C new nuclear plant being built in Somerset will generate around 25TWh once completed around 2026. The world’s largest offshore windfarm, the 1.2GW Hornsea One scheme off the Yorkshire coast, will generate around 5TWh each year.

The new Conservative government is targeting 40GW of offshore wind by 2030, up from today’s figure of around 8GW. If policies are put in place to meet this goal, then it could keep power sector emissions below 100gCO2/kWh, depending on the actual performance of the windfarms built.

However, new onshore wind and solar, further new nuclear or other low-carbon generation, such as gas with carbon capture and storage (CCS), is likely to be needed if demand is higher than expected, or if the 100gCO2/kWh benchmark is too weak in the context of net-zero by 2050.

The CCC says it is “likely” to “reflect the need for more rapid deployment” of low-carbon towards net-zero emissions in its advice on the sixth UK carbon budget for 2033-2037, due in September.

Trading places
Looking more closely at UK electricity generation in 2019, Carbon Brief’s analysis shows why there was so little growth for low-carbon sources compared to the previous year.

There was another increase for wind power in 2019 (up 8TWh, 14%), with record wind generation as several large new windfarms were completed including the 1.2GW Hornsea One project in October and the 0.6GW Beatrice offshore windfarm in Q2 of 2019. But this was offset by a decline for nuclear (down 9TWh, 14%), due to ongoing outages for reactors at Hunterston in Scotland and Dungeness in Kent.

(Analysis of data held by trade organisation RenewableUK suggests some 0.6GW of onshore wind capacity also started operating in 2019, including the 0.2GW Dorenell scheme in Moray, Scotland.)

As a result of these movements, the UK’s windfarms overtook nuclear for the first time ever in 2019, becoming the country’s second-largest source of electricity generation, and earlier, wind and solar together surpassed nuclear in the UK as momentum built. This is shown in the figure below, with wind (green line, top panel) trading places with nuclear (purple) and gas (dark blue) down around 25% since 2010 but remaining the single-largest source.

 Annual electricity generation in the UK by fuel, terawatt hours, 2010-2019. Top panel: fuel by fuel. Bottom panel: cumulative total generation from all sources. Source: BEIS energy trends, BM Reports and Carbon Brief analysis. Chart by Carbon Brief using Highcharts.
The UK’s currently suspended nuclear plants are due to return to service in January and March, according to operator EDF, the French state-backed utility firm. However, as noted above, most of the UK’s nuclear fleet is set to retire during the 2020s, with only Sizewell B in Suffolk due to still be operating by 2030. Hunterston is scheduled to retire by 2023 and Dungeness by 2028.

Set against these losses, the UK has a pipeline of offshore windfarms, secured via “contracts for difference” with the government, at a series of auctions. The most recent auction, in September 2019, saw prices below £40 per megawatt hour – similar to current wholesale electricity prices.

However, the capacity contracted so far is not sufficient to meet the government’s target of 40GW by 2030, meaning further auctions – or some other policy mechanism – will be required.

Coal zero
As well as the switch between wind and nuclear, 2019 also saw coal fall below solar for the first time across a full year, echoing the 2016 moment when wind outgenerated coal across the UK, after it suffered another 60% reduction in electricity output. Just six coal plants remain in the UK, with Aberthaw B in Wales and Fiddlers Ferry in Cheshire closing in March.

Coal accounted for just 2% of UK generation in 2019, a record-low coal share since centralised electricity supplies started to operate in 1882. The fuel met 40% of UK needs as recently as 2012, but has plummeted thanks to falling demand, rising renewables, cheaper gas and higher CO2 prices.

The reduction in average coal generation hides the fact that the fuel is now often not required at all to meet the UK’s electricity needs. The chart below shows the number of days each year when coal output was zero in 2019 (red line) and the two previous years (blue).

 Cumulative number of days when UK electricity generation from renewable sources has been higher than that from fossil fuels. Source: BEIS energy trends, BM Reports and Carbon Brief analysis. Chart by Carbon Brief using Highcharts.
The 83 days in 2019 with zero coal generation amount to nearly a quarter of the year and include the record-breaking 18-day stretch without the fuel.

Great Britain has been running for a record TWO WEEKS without using coal to generate electricity – the first time this has happened since 1882.

The country’s grid has been coal-free for 45% of hours in 2019 so far.https://www.carbonbrief.org/countdown-to-2025-tracking-the-uk-coal-phase-out …

Coal generation was set for significant reductions around the world in 2019 – including a 20% reduction for the EU as a whole – according to analysis published by Carbon Brief in November.

Notably, overall UK electricity generation fell by another 9TWh in 2019 (3%), bringing the total decline to 58TWh since 2010. This is equivalent to more than twice the output from the Hinkley C scheme being built in Somerset. As Carbon Brief explained last year, falling demand has had a similar impact on electricity-sector CO2 emissions as the increase in output from renewables.

This is illustrated by the fact that the 9TWh reduction in overall generation translated into a 9TWh (6%) cut in fossil-fuel generation during 2019, with coal falling by 10TWh and gas rising marginally.

Increasingly renewable
As fossil-fuel output and overall generation have declined, the UK’s renewable sources of electricity have continued to increase. Their output has risen nearly five-fold in the past decade and their share of the UK total has increased from 7% in 2010 to 37% in 2019.

As a result, the UK’s increasingly renewable grid is seeing more minutes, hours and days during which the likes of wind, solar and biomass collectively outpace all fossil fuels put together, and on some days wind is the main source as well.

The chart below shows the number of days during each year when renewables generated more electricity than fossil fuels in 2019 (red line) and each of the previous four years (blue lines). In total, nearly two-fifths of days in 2019 crossed this threshold.

 Cumulative number of days when the UK has not generated any electricity from coal. Source: BEIS energy trends, BM Reports and Carbon Brief analysis. Chart by Carbon Brief using Highcharts.
There were also four months in 2019 when renewables generated more of the UK’s electricity than fossil fuels: March, August, September and December. The first ever such month came in September 2018 and more are certain to follow.

National Grid, which manages Great Britain’s high-voltage electricity transmission network, is aiming to be able to run the system without fossil fuels by 2025, at least for short periods. At present, it sometimes has to ask windfarm operators to switch off and gas plants to start running in order to keep the electricity grid stable.

Note that biomass accounted for 11% of UK electricity generation in 2019, nearly a third of the total from all renewables. Some two-thirds of the biomass output is from “plant biomass”, primarily wood pellets burnt at Lynemouth in Northumberland and the Drax plant in Yorkshire. The remainder was from an array of smaller sites based on landfill gas, sewage gas or anaerobic digestion.

The CCC says the UK should “move away” from large-scale biomass power plants, once existing subsidy contracts for Drax and Lynemouth expire in 2027.

Using biomass to generate electricity is not zero-carbon and in some circumstances could lead to higher emissions than from fossil fuels. Moreover, there are more valuable uses for the world’s limited supply of biomass feedstock, the CCC says, including carbon sequestration and hard-to-abate sectors with few alternatives.

Methodology
The figures in the article are from Carbon Brief analysis of data from BEIS Energy Trends chapter 5 and chapter 6, as well as from BM Reports. The figures from BM Reports are for electricity supplied to the grid in Great Britain only and are adjusted to include Northern Ireland.

In Carbon Brief’s analysis, the BM Reports numbers are also adjusted to account for electricity used by power plants on site and for generation by plants not connected to the high-voltage national grid. This includes many onshore windfarms, as well as industrial gas combined heat and power plants and those burning landfill gas, waste or sewage gas.

By design, the Carbon Brief analysis is intended to align as closely as possible to the official government figures on electricity generated in the UK, reported in BEIS Energy Trends table 5.1.

Briefly, the raw data for each fuel is in most cases adjusted with a multiplier, derived from the ratio between the reported BEIS numbers and unadjusted figures for previous quarters.

Carbon Brief’s method of analysis has been verified against published BEIS figures using “hindcasting”. This shows the estimates for total electricity generation from fossil fuels or renewables to have been within ±3% of the BEIS number in each quarter since Q4 2017. (Data before then is not sufficient to carry out the Carbon Brief analysis.)

For example, in the second quarter of 2019, a Carbon Brief hindcast estimates gas generation at 33.1TWh, whereas the published BEIS figure was 34.0TWh. Similarly, it produces an estimate of 27.4TWh for renewables, against a BEIS figure of 27.1TWh.

National Grid recently shared its own analysis for electricity in Great Britain during 2019 via its energy dashboard, which differs from Carbon Brief’s figures.


Related News

View more

Six key trends that shaped Europe's electricity markets in 2020

European Electricity Market Trends 2020 highlight decarbonisation, rising renewables, EV adoption, shifting energy mix, COVID-19 impacts, fuel switching, hydro, wind and solar growth, gas price dynamics, and wholesale electricity price increases.


Key Points

EU power in 2020 saw lower emissions, more renewables, EV growth, demand shifts, and higher wholesale prices.

✅ Power sector CO2 down 14% on higher renewables, lower coal

✅ Renewables 39% vs fossil 36%; hydro, wind, solar expanded

✅ EV share hit 17%; wholesale prices rose with gas, ETS costs


According to the Market Observatory for Energy DG Energy report, the COVID-19 pandemic and favorable weather conditions are the two key drivers of the trends experienced within the European electricity market in 2020. However, the two drivers were exceptional or seasonal.

The key trends within Europe’s electricity market include:


1. Decrease in power sector’s carbon emissions

As a result of the increase in renewables generation and decrease in fossil-fueled power generation in 2020, the power sector was able to reduce its carbon footprint by 14% in 2020. The decrease in the sector’s carbon footprint in 2020 is similar to trends witnessed in 2019 when fuel switching was the main factor behind the decarbonisation trend.

However, most of the drivers in 2020 were exceptional or seasonal (the pandemic, warm winter, high
hydro generation). However, the opposite is expected in 2021, with the first months of 2021 having relatively cold weather, lower wind speeds and higher gas prices, with stunted hydro and nuclear output also cited, developments which suggest that the carbon emissions and intensity of the power sector could rise.

The European Union is targeting to completely decarbonise its power sector by 2050 through the introduction of supporting policies such as the EU Emissions Trading Scheme, the Renewable Energy Directive and legislation addressing air pollutant emissions from industrial installations, with expectations that low-emissions sources will cover most demand growth in the coming years.

According to the European Environment Agency, Europe halved its power sector’s carbon emissions in 2019 from 1990 levels.


2. Changes in energy consumption

EU consumption of electricity fell by -4% as majority of industries did not operate at full level during the first half of 2020. Although majority of EU residents stayed at home, meaning an increase in residential energy use, rising demand by households could not reverse falls in other sectors of the economy.

However, as countries renewed COVID-19 restrictions, energy consumption during the 4th quarter was closer to the “normal levels” than in the first three quarters of 2020. 

The increase in energy consumption in the fourth quarter of 2020 was also partly due to colder temperatures compared to 2019 and signs of surging electricity demand in global markets.


3. Increase in demand for EVs

As the electrification of the transport system intensifies, the demand for electric vehicles increased in 2020 with almost half a million new registrations in the fourth quarter of 2020. This was the highest figure on record and translated into an unprecedented 17% market share, more than two times higher than in China and six times higher than in the United States.

However, the European Environment Agency (EEA)argues that the EV registrations were lower in 2020 compared to 2019. EEA states that in 2019, electric car registrations were close to 550 000 units, having reached 300 000 units in 2018.


4. Changes in the region’s energy mix and increase in renewable energy generation

The structure of the region’s energy mix changed in 2020, according to the report.

Owing to favorable weather conditions, hydro energy generation was very high and Europe was able to expand its portfolio of renewable energy generation such that renewables (39%) exceeded the share of fossil fuels (36%) for the first time ever in the EU energy mix.

Rising renewable generation was greatly assisted by 29 GW of wind and solar capacity additions in 2020, which is comparable to 2019 levels. Despite disrupting the supply chains of wind and solar resulting in project delays, the pandemic did not significantly slow down renewables’ expansion.

In fact, coal and lignite energy generation fell by 22% (-87 TWh) and nuclear output dropped by 11% (-79 TWh). On the other hand, gas energy generation was not significantly impacted owing to favorable prices which intensified coal-to-gas and lignite-to-gas switching, even as renewables crowd out gas in parts of the market.


5. Retirement of coal energy generation intensify

 As the outlook for emission-intensive technologies worsens and carbon prices rise, more and more early coal retirements have been announced. Utilities in Europe are expected to continue transitioning from coal energy generation under efforts to meet stringent carbon emissions reduction targets and as they try to prepare themselves for future business models that they anticipate to be entirely low-carbon reliant.

6. Increase in wholesale electricity prices

In recent months, more expensive emission allowances, along with rising gas prices, have driven up wholesale electricity prices on many European markets to levels last seen at the beginning of 2019. The effect was most pronounced in countries that are dependent on coal and lignite. The wholesale electricity prices dynamic is expected to filter through to retail prices.

The rapid sales growth in the EVs sector was accompanied by expanding charging infrastructure. The number of high-power charging points per 100 km of highways rose from 12 to 20 in 2020.


Related News

View more

Sign Up for Electricity Forum’s Newsletter

Stay informed with our FREE Newsletter — get the latest news, breakthrough technologies, and expert insights, delivered straight to your inbox.

Electricity Today T&D Magazine Subscribe for FREE

Stay informed with the latest T&D policies and technologies.
  • Timely insights from industry experts
  • Practical solutions T&D engineers
  • Free access to every issue

Download the 2025 Electrical Training Catalog

Explore 50+ live, expert-led electrical training courses –

  • Interactive
  • Flexible
  • CEU-cerified