'Dead-end' Austrian town blossoms with green energy

By International Herald Tribune


NFPA 70b Training - Electrical Maintenance

Our customized live online or in‑person group training can be delivered to your staff at your location.

  • Live Online
  • 12 hours Instructor-led
  • Group Training Available
Regular Price:
$599
Coupon Price:
$499
Reserve Your Seat Today
For decades, the Austrian town of Güssing was a forgotten outpost not far from the rusting barbed-wire border of the Iron Curtain.

Now it's at the edge of a greener frontier: alternative energy. Güssing is the first community in the European Union to cut carbon emissions by more than 90 percent, helping it attract a steady stream of scientists, politicians and eco-tourists.

"This was a dead-end town and now we're the center of attention," said Maria Hofer, a lifelong resident, as she bought organic vegetables at a farmer's market. "It seems like every week we read about new jobs from renewable energy."

Güssing's transformation started 15 years ago when, struggling to pay its electricity bill, the town ordered that all public buildings would stop using fossil fuels. Since then, Güssing has fostered a whole renewable energy industry, with 50 companies creating more than 1,000 jobs and producing heat, power and fuels from the sun, sawdust, corn and cooking oil.

Signs reading "Eco-Energy Land" greet people entering the town, located 130 kilometers, or 80 miles, southeast of Vienna. Visitors are as diverse as Scottish farmers, Japanese investors and a delegation from the Organization for Security and Cooperation in Europe.

"The town is combining growth in tourism revenue with being in the vanguard of environmental sustainability," said Bernard Snoy, who, as economic director at the Vienna-based OSCE, brought a group of 50 diplomats from 30 countries to Güssing in June.

Güssing used to rely on agriculture, with farmers selling their corn, sunflower oil and timber. As for tourism, the main attraction was a 12th-century castle built by Hungarian nobles.

The town could hardly afford its 6 million euro, or $8.1 million, fuel bill when Peter Vadasz was first elected mayor in 1992. The turnaround started after he hired Rheinhard Koch, an electrical engineer and Güssing native, to assess how the town of 4,000 people could benefit from its natural resources.

Today, Güssing generates 22 megawatt hours of power a year, including an 8 megawatt surplus that is sold to the national grid, said Koch, who now runs the European Center for Renewable Energy, based in the town and funded by Güssing, the EU and the Austrian government. Sales of excess power generate about 4.7 million euro in annual revenue and a 500,000 euro profit that is plowed back into alternative energy projects.

"Just to turn to renewable energy brought advantages we didn't dream of before," said Vadasz, a former schoolteacher. "A lot of money that left before, now stays in the region."

Güssing began building its energy network in 1992 with a wood-burning plant that provided heat for 27 homes. The second step was a facility that made car fuel from rapeseed. By 1996, Güssing had started to generate electricity and expanded its heating system to the whole town.

The breakthrough came in 1998, when Koch and Vadasz saw a presentation by a Viennese scientist, Hermann Hofbauer, about a technology he had developed to make an alternative fuel from wood.

They asked Hofbauer and Vienna's Technical University to build a pilot project. A local company later licensed the technology, which uses steam to separate carbon and hydrogen from scrap lumber, then recombines the molecules to make a form of natural gas. The gas in turn fuels the city's power plant.

Güssing has reduced carbon dioxide emissions by 93 percent from 1995 levels, according to the renewable energy center. Vaxjo, the Swedish town that won the EU's "Sustainable Community" award this year, has cut emissions by 25 percent during the past decade.

Former Vice President Al Gore last month called for 90 percent cuts worldwide by 2050.

The European Environment Agency, which tracks renewable energy projects in the 27-member EU, doesn't know of any other town that has achieved similar reductions in carbon emissions, said Brendan Killeen, a spokesman for the agency, which is based in Copenhagen.

Still, Güssing must protect the surrounding forest land to maintain its supply of renewable energy, said Raphael Rindler, a Franciscan priest who has preached in the town for four years.

"People here take the forests for granted, the way people thought about oil 50 years ago," he said.

Rindler said he was more hopeful about the solar power that is scheduled to start being produced in Güssing next year when Solon AG Fuer Solartechnik of Germany finishes a 50 million euro plant.

Meanwhile, Güssing is preparing for more tourism, building new sidewalks and widening the road to include parking spaces.

Related News

27 giant parts from China to be transported to wind farm in Saskatchewan

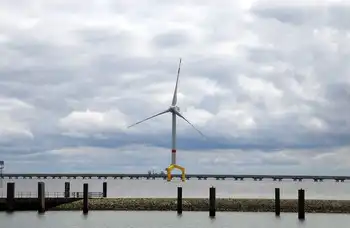
Port of Vancouver Wind Turbine Blades arrive from China for a Saskatchewan wind farm, showcasing record oversized cargo logistics, tandem crane handling, renewable energy capacity, and North America's longest blades from Goldwind.


Key Points

Record-length blades for a Canadian wind farm, boosting renewable energy and requiring heavy-lift logistics at the port.

✅ 27 blades unloaded via tandem cranes with cage supports

✅ 50 turbines headed to Assiniboia over 21 weeks

✅ Largest 250 ft blades to arrive; reduced CO2 vs coal


A set of 220-foot-long wind turbine blades arrived at the Port of Vancouver from China over the weekend as part a shipment bound for a wind farm in Canada, alongside BC generating stations coming online in the region.

They’re the largest blades ever handled by the port, and this summer, even larger blades will arrive as companies expand production such as GE’s blade factory in France to meet demand — the largest North America has ever seen.

Alex Strogen described the scene as crews used two tandem cranes to unload 27 giant white blades from the MV Star Kilimanjaro, which picked up the wind turbine assemblies in China. They were manufactured by Goldwind Co.

“When you see these things come off and put onto these trailers, it’s exceptional in the sheer length of them,” Strogen said. “It looks as long as an airplane.”

In fact, each blade is about as long as the wingspan of a Boeing 747.

Groups of longshoremen attached the cranes to each blade and hoisted it into the air and onto a waiting truck. Metal cage-like devices on both ends kept the blades from touching the ground. Once loaded onto the trucks, the blades and shaft parts head to a terminal to be unloaded by another group of workers.

Another fleet of trucks will drive the wind turbines, towers and blades to Assiniboia, Saskatchewan, Canada, over the course of 21 weeks. Potentia Renewables of Toronto is erecting the turbines on 34,000 acres of leased agriculture land, amid wind farm expansion in PEI elsewhere in the country, according to a news release from the Port of Vancouver.

Potentia’s project, called the Golden South Wind Project, will generate approximately 900,000 megawatt-hours of electricity. It also has greatly reduced CO2 emissions compared with a coal-fired plant, and complements tidal power in Nova Scotia in Canada’s clean energy mix, according to the news release.

The project is expected to be operating in 2021, similar to major UK offshore wind additions coming online.

The Port of Vancouver will receive 50 full turbines of two models for the project, as Manitoba invests in new turbines across Canada. In August, the larger of the models, with blades measuring 250 feet, will arrive. They’ll be the longest blades ever imported into any port in North America.

“It’s an exciting year for the port,” said Ryan Hart, chief external affairs officer.

The Port of Vancouver is following all the recommended safety precautions during the COVID-19 pandemic, including social distancing and face masks, Strogen said, with support from initiatives like Bruce Power’s PPE donation across Canada.
As for crews onboard the ships, the U.S. Coast Guard is the agency in charge, and it is monitoring the last port-of-call for all vessels seeking to enter the Columbia River, Hart wrote in an email.

Vessel masters on each ship are responsible for monitoring the health of the crew and are required to report sick or ill crew members to the USCG prior to arrival or face fines and potential arrest.


Related News

View more

Here are 3 ways to find out where your electricity comes from

US energy mix shows how the electric grid blends renewables, fossil fuels, nuclear, and hydro, varying by ISO/RTO markets, utilities, and state policies, affecting carbon emissions, pricing, reliability, and access.


Key Points

The US energy mix is the grid's source breakdown by region: fossil fuels, renewables, nuclear, and hydro.

✅ Check ISO or RTO dashboards for real-time generation by fuel source.

✅ Utilities may offer green power plans or RECs at modest premiums.

✅ Energy mix shifts with policy, pricing, and grid reliability needs.


There are few resources more important than energy. Sure, you may die if you don't eat for days. But your phone will die if you go too long without charging it. Energy feeds tech, the internet, city infrastructure, refrigerators, lights, and has evolved throughout U.S. history in profound ways. You get the idea. Yet unlike our other common needs, such as food, energy sources aren't exactly front of mind for most people. 

"I think a lot of people don't put a lot of bandwidth into thinking about this part of their lives," said Richard McMahon, the SVP of energy supply and finance at Edison Electric Institute, a trade group that represents investor-owned electric companies in the US. 

It makes sense. For most Americans, electricity is always there, and in many locations, there's not much of a choice involved, even as electricity demand is flat across the U.S. today. You sign up with a utility when you move into a new residence and pay your bills when they're due. 

But there's an important reality that indifference eschews: In 2018, a third of the energy-related carbon-dioxide emissions in the US came from the electric power sector, according to the US Energy Information Administration (EIA). 

A good chunk of that is from the residential sector, which consistently uses more energy than commercial customers, per EIA data.

Just as many people exercise choice when they eat, you typically also have a choice when it comes to your energy supply. That's not to say your current offering isn't what you want, or that switching will be easy or affordable, but "if you're a customer and want power with a certain attribute," McMahon said, "you can pretty much get it wherever you are." 

But first, you need to know the energy mix you have right now. As it turns out, it's not so straightforward. At all.

This brief guide may help. 

For some utility providers, you can find out if it publishes the energy mix online. Dominion Energy, which serves Idaho, North Carolina, Ohio, South Carolina, Utah, Virginia, West Virginia, and Wyoming, provides this information in a colored graphic. 

"Once you figure out who your utility is you can figure out what mix of resources they use," said Heidi Ratz, an electricity markets researcher at the World Resources Institute.

But not all utilities publish this information.

It has to do with their role in the grid and reflects utility industry trends in structure and markets. Some utility companies are vertically integrated; they generate power through nuclear plants or wind farms and distribute those electrons directly to their customers. Other utilities just distribute the power that different companies produce. 

Consider Consolidated Edison, or Con Ed, which distributes energy to parts of New York City. While reporting this story, Business Insider could not find information about the utility's energy mix online. When reached for comment, a spokesperson said, "we're indifferent to where it comes from."

That's because, in New York, distribution utilities like Con Ed often buy energy through a wholesale marketplace.

Take a look at this map. If you live in one of the colored regions, your electricity is sold on a wholesale market regulated by an organization called a regional transmission organization (RTO) or independent system operator (ISO). Distribution utilities like Con Ed often buy their energy through these markets, based on availability and cost, while raising questions about future utility revenue models as prices shift. 

Still, it's pretty easy to figure out where your energy comes from. Just look up the ISO or RTO website (such as NYISO or CAISO). Usually, these organizations will provide energy supply information in near-real time. 

That's exactly what Con Edison (which buys energy on the NYISO marketplace) suggested. As of Friday morning, roughly 40% of the energy on the market place was natural gas or other fossil fuels, 34% was nuclear, and about 22% was hydro. 

If you live in another region governed by an ISO or RTO, such as in most of California, you can do the same thing. Like NYISO, CAISO has a dashboard that shows (again, as of Friday morning) about 36% of the energy on the market comes from natural gas and more than 20% comes from renewables. 

In the map linked above, you'll notice that some of the ISOs and RTOs like MISO encompass enormous regions. That means that even if you figure out where the energy in your market comes from, it's not going to be geographically specific. But there are a couple of ways to drill down even further. 

The Environmental Protection Agency has a straightforward tool called Power Profiler. You can enter your zip code to see the fuel mix in your area. But it's not perfect. The data are from 2016 and, in some regions of the country like the upper Midwest, they aren't much more localized, and some import dirty electricity due to regional trading. 

The World Resources Institute also has a tool that allows you to see the electricity mix by state, based on 2017 data from EIA. These numbers represent power generation, not the electricity actually flowing into your sockets, but they offer a rough idea of what energy resources are operating in your state. 

One option is to check with your utility to see if it has a "green power" offering. Over 600 utilities across the country have one, according to the Climate Reality Project, though they often come at a slightly higher cost. It's typically on the scale of just a few more cents per kilowatt-hour. 

There are also independent, consumer-facing companies like Arcadia and Green Mountain Energy that allow you to source renewable energy, by virtually connecting you to community solar projects or purchasing Renewable Energy Certificates, or RECs, on your behalf, as America goes electric and more options emerge. 

"RECs measure an investment in a clean energy resource," Ratz said, in an email. "The goal of putting that resource on the grid is to push out the need for dirtier resources."

The good news: Even if you do nothing, your energy mix will get cleaner. Coal production has fallen to lows not seen since the 1980s, amid disruptions in coal and nuclear sectors that affect reliability and costs, while renewable electricity generation has doubled since 2008. So whether you like it or not, you'll be roped into the clean energy boom one way or another. 


Related News

View more

Trump Is Seen Replacing Obama’s Power Plant Overhaul With a Tune-Up

Clean Power Plan Rollback signals EPA's shift to inside-the-fence efficiency at coal plants, emphasizing heat-rate improvements over sector-wide decarbonization, renewables, natural gas switching, demand-side efficiency, and carbon capture under Clean Air Act constraints.


Key Points

A policy shift by the EPA to replace broad emissions rules with plant-level efficiency standards, limiting CO2 cuts.

✅ Inside-the-fence heat-rate improvements at coal units

✅ Potential CO2 cuts limited to about 6% per plant

✅ Alternatives: fuel switching, renewables, carbon capture


President Barack Obama’s signature plan to reduce carbon dioxide emissions from electrical generation took years to develop and touched every aspect of power production and use, from smokestacks to home insulation.

The Trump administration is moving to scrap that plan and has signaled that any alternative it might adopt would take a much less expansive approach, possibly just telling utilities to operate their plants more efficiently.

That’s a strategy environmentalists say is almost certain to fall short of what’s needed.

The Trump administration is making "a wholesale retreat from EPA’s legal, scientific and moral obligation to address the threats of climate change," said former Environmental Protection Agency head Gina McCarthy, the architect of Obama’s Clean Power Plan.

President Donald Trump promised to rip up the initiative, echoing an end to the 'war on coal' message from his campaign, which mandated that states change their overall power mix, displacing coal-fired electricity with that from wind, solar and natural gas. The EPA is about to make it official, arguing the prior administration violated the Clean Air Act by requiring those broad changes to the electricity sector, according to a draft obtained by Bloomberg.


Possible Replacements

Later, the agency will also ask the public to weigh in on possible replacements. The administration will ask whether the EPA can or should develop a replacement rule -- and, if so, what actions can be mandated at individual power plants, though some policymakers favor a clean electricity standard to drive broader decarbonization.


Follow the Trump Administration’s Every Move

Such changes -- such as adding automation or replacing worn turbine seals -- would yield at most a 6 percent gain in efficiency, along with a corresponding fall in greenhouse gas emissions, according to earlier modeling by the Environmental Protection Agency and other analysts. That compares to the 32 percent drop in emissions by 2030 under Obama’s Clean Power Plan.

"In these existing plants, there’s only so many places to look for savings," said John Larsen, a director of the Rhodium Group, a research firm. "There’s only so many opportunities within a big spinning machine like that."

EPA Administrator Scott Pruitt outlined such an "inside-the-fence-line" approach in 2014, later embodied in the Affordable Clean Energy rule that industry groups backed, when he served as Oklahoma’s attorney general. Under his blueprint, states would set emissions standards after a detailed unit-by-unit analysis, looking at what reductions are possible given "the engineering limits of each facility."

The EPA has not decided whether it will promulgate a new rule at all, though it has also proposed new pollution limits for coal and gas plants in separate actions. In a forthcoming advanced notice of proposed rulemaking, the EPA will ask "what inside-the-fence-line options are legal, feasible and appropriate," according to a document obtained by Bloomberg.

Increased efficiency at a coal plant -- known as heat-rate improvement -- translates into fewer carbon-dioxide emissions per unit of electric power generated.

Under Obama, the EPA envisioned utilities would make some straightforward efficiency improvements at coal-fired power plants as the first step to comply with the Clean Power Plan. But that was expected to coincide with bigger, broader changes -- such as using more cleaner-burning natural gas, adding more renewable power projects and simply encouraging customers to do a better job turning down their thermostats and turning off their lights.

Obama’s EPA didn’t ask utilities to wring every ounce of efficiency they could out of coal-fired power plants because they saw the other options as cheaper. A plant-specific approach "would be grossly insufficient to address the public health and environmental impacts from CO2 emissions," Obama’s EPA said.

That approach might yield modest emissions reductions and, in a perverse twist, might event have the opposite effect. If utilities make coal plants more efficient -- thereby driving down operating costs -- they also make them more competitive with natural gas and renewables, "so they might run more and pollute more," said Conrad Schneider, advocacy director for the Clean Air Task Force.  

In a competitive market, any improvement in emissions produced for each unit of energy could be overwhelmed by an increase in electrical output, and debates over changes to electricity pricing under Trump and Perry added further uncertainty.

"A very minor heat rate improvement program would very likely result in increased emissions," Schneider said. "It might be worse than nothing."

Power companies want to get as much electricity as possible from every pound of coal, so they already have an incentive to keep efficiency high, said Jeff Holmstead, a former assistant EPA administrator now at Bracewell LLP. But an EPA regulation known as “new source review” has discouraged some from making those changes, for fear of triggering other pollution-control requirements, he said.

"If EPA’s replacement rule allows companies to improve efficiency without triggering new source review, it would make a real difference in terms of reducing carbon-dioxide emissions," Holmstead said.


Modest Impact

A plant-specific approach doesn’t have to mean modest impact.

"If you’re thinking about what can be done at the power plants by themselves, you don’t stop at efficiency tune-ups," said David Doniger, director of the Natural Resources Defense Council’s climate and clean air program. "You look at things like switching to natural gas or installing carbon capture and storage."

Requirements that facilities use carbon capture technology or swap in natural gas for coal could actually come close to hitting the same goals as in Obama’s Clean Power Plan -- if not go even further, Schneider said. They just would cost more.

The benefit of the Clean Power Plan "is that it enabled states to create programs and enabled companies to find a reduction strategy that was the most efficient and made the most sense for their own content," said Kathryn Zyla, deputy director of the Georgetown Climate Center. "And that flexibility was really important for the states and companies."

Some utilities, including Houston-based Calpine Corp., PG&E Corp. and Dominion Resources Inc., backed the Obama-era approach. And they are still pushing the Trump administration to be creative now.

"The Clean Power Plan achieved a thoughtful, balanced approach that gave companies and states considerable flexibility on how best to pursue that goal," said Melissa Lavinson, vice president of federal affairs and policy for PG&E’s Pacific Gas and Electric utility. “We look forward to working with the administration to devise an alternative plan for decarbonizing the U.S. economy."


Related News

View more

Electricity prices may go up by 15 per cent

Jersey Electricity Standby Charge proposes a grid-backup fee for commercial self-generators of renewable energy, with a review delaying implementation; potential tariff impacts include 10-15 percent price rises, cost recovery, and network reliability.


Key Points

A grid-backup fee for Jersey self-generating businesses to share network costs fairly and curb electricity price rises.

✅ Applies to commercial self-generation using renewables or not

✅ Excludes full exporters and pre-charge installations

✅ Aims to recover grid costs and avoid 10-15% price rises


Electricity prices could rise by ten to 15 per cent if a standby charge for some commercial customers is not implemented, the chief executive of Jersey Electricity has warned.

Jersey Electricity has proposed extending a monthly fee to commercial customers who generate their own power through renewable means but still wish to be connected to Jersey’s grid as a back-up, echoing Ontario energy storage efforts to shore up reliability.

The States recently unanimously backed a proposal lodged by Deputy Carolyn Labey to delay administering the levy until a review could be carried out, as seen in the UK grid's net-zero transformation debates influencing policy. The charge, was due to be implemented next month but will now not be introduced until May, or later if the review has not concluded.

But Chris Ambler, JE chief executive, warned that failing to implement the standby charge could lead to additional costs for customers.

Some of JE’s commercial customers have already been charged a standby fee after generating their own power through non-renewable means.

The charge does not apply to businesses which export all of their electricity back into the system as part of a buy-back scheme or those which install self-generation facilities before the charge is implemented.

Deputy Labey argued that the Island had done ‘absolutely nothing’ to support the use of renewable energies and instead were discouraging locally generated power by allowing JE to set a standby charge.

She added that she was pleased that the Council of Ministers had already starting reviewing the charges but the debate needed to go ahead to ensure the work continued after the May election.

During a States debate last month, she said: ‘It is increasingly concerning that we, as an island in the 21st century, are happy for our electricity to be provided to us by an unregulated, publicly listed for-profit company with a monopoly on energy.

‘I also think that introducing a charge on renewables at a time when the world is experiencing a revolution in renewable energies, including offshore vessel charging solutions, which are becoming increasingly economic, is something that needs to be investigated.

‘Jersey should be looking to diversify our electricity production and supply, to help protect us from price and currency fluctuations and to ensure that we, as an island, receive the best deal possible for Islanders.’

Mr Ambler said that any price increase would be dependent on the future take-up and use of renewable-energy technology in Jersey.

He said: ‘The cost impact would not be significant in the short term but in the long term it could be significant. I think that we are obliged to let our customers know that.

‘It is very difficult to assess but if we are not able to levy a fair charge, then, as electricity shortages in Canada have shown, we could see prices rise by ten to 15 per cent over time.’

Mr Ambler added that his company was in favour of the use of renewable energy, with a third of the company’s electricity being generated by hydroelectric sources, but that the costs of implementing it needed to be fairly distributed, given how big battery rule changes can affect project viability elsewhere in the market.

And he said that, while it was difficult to quantify how much could be lost if the standby charge was not implemented, it could cost the company over £10 million.

‘In 2014, we only increased our prices by one per cent,’ he said. ‘We are reviewing our prices at the moment but if we did put an increase in place it would be modest and it would not be linked to the standby charge.’


Related News

View more

UK low-carbon electricity generation stalls in 2019

UK low-carbon electricity 2019 saw stalled growth as renewables rose slightly, wind expanded, nuclear output fell, coal hit record lows, and net-zero targets demand faster deployment to cut CO2 intensity below 100gCO2/kWh.


Key Points

Low-carbon sources supplied 54% of UK power in 2019, up just 1TWh; wind grew, nuclear fell, and coal dropped to 2%.

✅ Wind up 8TWh; nuclear down 9TWh amid outages

✅ Fossil fuels 43% of generation; coal at 2%

✅ Net-zero needs 15TWh per year added to 2030


The amount of electricity generated by low-carbon sources in the UK stalled in 2019, Carbon Brief analysis shows.

Low-carbon electricity output from wind, solar, nuclear, hydro and biomass rose by just 1 terawatt hour (TWh, less than 1%) in 2019. It represents the smallest annual increase in a decade, where annual growth averaged 9TWh. This growth will need to double in the 2020s to meet UK climate targets while replacing old nuclear plants as they retire.

Some 54% of UK electricity generation in 2019 came from low-carbon sources, including 37% from renewables and 20% from wind alone, underscoring wind's leading role in the power mix during key periods. A record-low 43% was from fossil fuels, with 41% from gas and just 2% from coal, also a record low. In 2010, fossil fuels generated 75% of the total.

Carbon Brief’s analysis of UK electricity generation in 2019 is based on figures from BM Reports and the Department for Business, Energy and Industrial Strategy (BEIS). See the methodology at the end for more on how the analysis was conducted.

The numbers differ from those published earlier in January by National Grid, which were for electricity supplied in Great Britain only (England, Wales and Scotland, but excluding Northern Ireland), including via imports from other countries.

Low-carbon low
In 2019, the UK became the first major economy to target net-zero greenhouse gas emissions by 2050, increasing the ambition of its legally binding Climate Change Act.

To date, the country has cut its emissions by around two-fifths since 1990, with almost all of its recent progress coming from the electricity sector.

Emissions from electricity generation have fallen rapidly in the decade since 2010 as coal power has been almost phased out and even gas output has declined. Fossil fuels have been displaced by falling demand and by renewables, such as wind, solar and biomass.

But Carbon Brief’s annual analysis of UK electricity generation shows progress stalled in 2019, with the output from low-carbon sources barely increasing compared to a year earlier.

The chart below shows low-carbon generation in each year since 2010 (grey bars) and the estimated level in 2019 (red). The pale grey bars show the estimated future output of existing low-carbon sources after old nuclear plants retire and the pale red bars show the amount of new generation needed to keep electricity sector emissions to less than 100 grammes of CO2 per kilowatt hour (gCO2/kWh), the UK’s nominal target for the sector.

 Annual electricity generation in the UK by fuel, terawatt hours, 2010-2019. Top panel: fuel by fuel. Bottom panel: cumulative total generation from all sources. Source: BEIS energy trends, BM Reports and Carbon Brief analysis. Chart by Carbon Brief using Highcharts.
As the chart shows, the UK will require significantly more low-carbon electricity over the next decade as part of meeting its legally binding climate goals.

The nominal 100gCO2/kWh target for 2030 was set in the context of the UK’s less ambitious goal of cutting emissions to 80% below 1990 levels by 2050. Now that the country is aiming to cut emissions to net-zero by 2050, that 100gCO2/kWh indicator is likely to be the bare minimum.

Even so, it would require a rapid step up in the pace of low-carbon expansion, compared to the increases seen over the past decade. On average, low-carbon generation has risen by 9TWh each year in the decade since 2010 – including a rise of just 1TWh in 2019.

Given scheduled nuclear retirements and rising demand expected by the Committee on Climate Change (CCC) – with some electrification of transport and heating – low-carbon generation would need to increase by 15TWh each year until 2030, just to meet the benchmark of 100gCO2/kWh.

For context, the 3.2 gigawatt (GW) Hinkley C new nuclear plant being built in Somerset will generate around 25TWh once completed around 2026. The world’s largest offshore windfarm, the 1.2GW Hornsea One scheme off the Yorkshire coast, will generate around 5TWh each year.

The new Conservative government is targeting 40GW of offshore wind by 2030, up from today’s figure of around 8GW. If policies are put in place to meet this goal, then it could keep power sector emissions below 100gCO2/kWh, depending on the actual performance of the windfarms built.

However, new onshore wind and solar, further new nuclear or other low-carbon generation, such as gas with carbon capture and storage (CCS), is likely to be needed if demand is higher than expected, or if the 100gCO2/kWh benchmark is too weak in the context of net-zero by 2050.

The CCC says it is “likely” to “reflect the need for more rapid deployment” of low-carbon towards net-zero emissions in its advice on the sixth UK carbon budget for 2033-2037, due in September.

Trading places
Looking more closely at UK electricity generation in 2019, Carbon Brief’s analysis shows why there was so little growth for low-carbon sources compared to the previous year.

There was another increase for wind power in 2019 (up 8TWh, 14%), with record wind generation as several large new windfarms were completed including the 1.2GW Hornsea One project in October and the 0.6GW Beatrice offshore windfarm in Q2 of 2019. But this was offset by a decline for nuclear (down 9TWh, 14%), due to ongoing outages for reactors at Hunterston in Scotland and Dungeness in Kent.

(Analysis of data held by trade organisation RenewableUK suggests some 0.6GW of onshore wind capacity also started operating in 2019, including the 0.2GW Dorenell scheme in Moray, Scotland.)

As a result of these movements, the UK’s windfarms overtook nuclear for the first time ever in 2019, becoming the country’s second-largest source of electricity generation, and earlier, wind and solar together surpassed nuclear in the UK as momentum built. This is shown in the figure below, with wind (green line, top panel) trading places with nuclear (purple) and gas (dark blue) down around 25% since 2010 but remaining the single-largest source.

 Annual electricity generation in the UK by fuel, terawatt hours, 2010-2019. Top panel: fuel by fuel. Bottom panel: cumulative total generation from all sources. Source: BEIS energy trends, BM Reports and Carbon Brief analysis. Chart by Carbon Brief using Highcharts.
The UK’s currently suspended nuclear plants are due to return to service in January and March, according to operator EDF, the French state-backed utility firm. However, as noted above, most of the UK’s nuclear fleet is set to retire during the 2020s, with only Sizewell B in Suffolk due to still be operating by 2030. Hunterston is scheduled to retire by 2023 and Dungeness by 2028.

Set against these losses, the UK has a pipeline of offshore windfarms, secured via “contracts for difference” with the government, at a series of auctions. The most recent auction, in September 2019, saw prices below £40 per megawatt hour – similar to current wholesale electricity prices.

However, the capacity contracted so far is not sufficient to meet the government’s target of 40GW by 2030, meaning further auctions – or some other policy mechanism – will be required.

Coal zero
As well as the switch between wind and nuclear, 2019 also saw coal fall below solar for the first time across a full year, echoing the 2016 moment when wind outgenerated coal across the UK, after it suffered another 60% reduction in electricity output. Just six coal plants remain in the UK, with Aberthaw B in Wales and Fiddlers Ferry in Cheshire closing in March.

Coal accounted for just 2% of UK generation in 2019, a record-low coal share since centralised electricity supplies started to operate in 1882. The fuel met 40% of UK needs as recently as 2012, but has plummeted thanks to falling demand, rising renewables, cheaper gas and higher CO2 prices.

The reduction in average coal generation hides the fact that the fuel is now often not required at all to meet the UK’s electricity needs. The chart below shows the number of days each year when coal output was zero in 2019 (red line) and the two previous years (blue).

 Cumulative number of days when UK electricity generation from renewable sources has been higher than that from fossil fuels. Source: BEIS energy trends, BM Reports and Carbon Brief analysis. Chart by Carbon Brief using Highcharts.
The 83 days in 2019 with zero coal generation amount to nearly a quarter of the year and include the record-breaking 18-day stretch without the fuel.

Great Britain has been running for a record TWO WEEKS without using coal to generate electricity – the first time this has happened since 1882.

The country’s grid has been coal-free for 45% of hours in 2019 so far.https://www.carbonbrief.org/countdown-to-2025-tracking-the-uk-coal-phase-out …

Coal generation was set for significant reductions around the world in 2019 – including a 20% reduction for the EU as a whole – according to analysis published by Carbon Brief in November.

Notably, overall UK electricity generation fell by another 9TWh in 2019 (3%), bringing the total decline to 58TWh since 2010. This is equivalent to more than twice the output from the Hinkley C scheme being built in Somerset. As Carbon Brief explained last year, falling demand has had a similar impact on electricity-sector CO2 emissions as the increase in output from renewables.

This is illustrated by the fact that the 9TWh reduction in overall generation translated into a 9TWh (6%) cut in fossil-fuel generation during 2019, with coal falling by 10TWh and gas rising marginally.

Increasingly renewable
As fossil-fuel output and overall generation have declined, the UK’s renewable sources of electricity have continued to increase. Their output has risen nearly five-fold in the past decade and their share of the UK total has increased from 7% in 2010 to 37% in 2019.

As a result, the UK’s increasingly renewable grid is seeing more minutes, hours and days during which the likes of wind, solar and biomass collectively outpace all fossil fuels put together, and on some days wind is the main source as well.

The chart below shows the number of days during each year when renewables generated more electricity than fossil fuels in 2019 (red line) and each of the previous four years (blue lines). In total, nearly two-fifths of days in 2019 crossed this threshold.

 Cumulative number of days when the UK has not generated any electricity from coal. Source: BEIS energy trends, BM Reports and Carbon Brief analysis. Chart by Carbon Brief using Highcharts.
There were also four months in 2019 when renewables generated more of the UK’s electricity than fossil fuels: March, August, September and December. The first ever such month came in September 2018 and more are certain to follow.

National Grid, which manages Great Britain’s high-voltage electricity transmission network, is aiming to be able to run the system without fossil fuels by 2025, at least for short periods. At present, it sometimes has to ask windfarm operators to switch off and gas plants to start running in order to keep the electricity grid stable.

Note that biomass accounted for 11% of UK electricity generation in 2019, nearly a third of the total from all renewables. Some two-thirds of the biomass output is from “plant biomass”, primarily wood pellets burnt at Lynemouth in Northumberland and the Drax plant in Yorkshire. The remainder was from an array of smaller sites based on landfill gas, sewage gas or anaerobic digestion.

The CCC says the UK should “move away” from large-scale biomass power plants, once existing subsidy contracts for Drax and Lynemouth expire in 2027.

Using biomass to generate electricity is not zero-carbon and in some circumstances could lead to higher emissions than from fossil fuels. Moreover, there are more valuable uses for the world’s limited supply of biomass feedstock, the CCC says, including carbon sequestration and hard-to-abate sectors with few alternatives.

Methodology
The figures in the article are from Carbon Brief analysis of data from BEIS Energy Trends chapter 5 and chapter 6, as well as from BM Reports. The figures from BM Reports are for electricity supplied to the grid in Great Britain only and are adjusted to include Northern Ireland.

In Carbon Brief’s analysis, the BM Reports numbers are also adjusted to account for electricity used by power plants on site and for generation by plants not connected to the high-voltage national grid. This includes many onshore windfarms, as well as industrial gas combined heat and power plants and those burning landfill gas, waste or sewage gas.

By design, the Carbon Brief analysis is intended to align as closely as possible to the official government figures on electricity generated in the UK, reported in BEIS Energy Trends table 5.1.

Briefly, the raw data for each fuel is in most cases adjusted with a multiplier, derived from the ratio between the reported BEIS numbers and unadjusted figures for previous quarters.

Carbon Brief’s method of analysis has been verified against published BEIS figures using “hindcasting”. This shows the estimates for total electricity generation from fossil fuels or renewables to have been within ±3% of the BEIS number in each quarter since Q4 2017. (Data before then is not sufficient to carry out the Carbon Brief analysis.)

For example, in the second quarter of 2019, a Carbon Brief hindcast estimates gas generation at 33.1TWh, whereas the published BEIS figure was 34.0TWh. Similarly, it produces an estimate of 27.4TWh for renewables, against a BEIS figure of 27.1TWh.

National Grid recently shared its own analysis for electricity in Great Britain during 2019 via its energy dashboard, which differs from Carbon Brief’s figures.


Related News

View more

Latvia eyes electricity from Belarus nuclear plant

Latvia Astravets electricity imports weigh AST purchases from the Belarusian nuclear plant, impacting the Baltic grid, Lithuania market, energy security, and cross-border trading as Latvia seeks to mitigate supply risks and stabilize power flows.


Key Points

Proposed AST purchases of power from Belarus's Astravets plant to bolster Baltic grid supply via Lithuania.

✅ AST evaluates imports to mitigate supply risk

✅ Energy could enter Lithuania via existing trading route

✅ Debate centers on nuclear safety and Baltic grid impacts


Latvia’s electricity transmission system operator, AST, is looking at the possibility of purchasing electricity from the soon-to-be completed Belarusian nuclear power plant in Astravets, at a time when Ukraine's electricity exports have resumed in the region, long criticised by the Lithuanian government, Belsat TV has reported.

According to the Latvian media, the Latvian government is seeking to mitigate the risk of a possible drop in electricity supplies amid price spikes in Ireland highlighting dispatchable power concerns, given that energy trading between the Baltic states and third parties is currently carried out only through the Belarusian-Lithuanian border, including Latvian imports from Lithuania.

If AST starts importing electricity from the Belarusian plant to Latvia, in a pattern similar to Georgia's electricity imports during peak demand, the energy is expected to enter the Lithuanian market as well.

Such cross-border flows also mirror responses to Central Asia's electricity shortages seen recently.

The Lithuanian government has repeatedly criticised the nuclear power over national security and environmental safety concerns, as well as a number of emergencies that took place during construction, particularly as Europe is losing nuclear power and confronting energy security challenges.

Debates over infrastructure and safety have also intensified by projects like power lines to reactivate Zaporizhzhia in Ukraine.

The first Astravets reactor, which is being built close to the Lithuanian border in the Hrodno region, is expected to be operational by the end of 2019, a year that saw Belgium's nuclear exports rise across Europe.


Related News

View more

Sign Up for Electricity Forum’s Newsletter

Stay informed with our FREE Newsletter — get the latest news, breakthrough technologies, and expert insights, delivered straight to your inbox.

Electricity Today T&D Magazine Subscribe for FREE

Stay informed with the latest T&D policies and technologies.
  • Timely insights from industry experts
  • Practical solutions T&D engineers
  • Free access to every issue

Live Online & In-person Group Training

Advantages To Instructor-Led Training – Instructor-Led Course, Customized Training, Multiple Locations, Economical, CEU Credits, Course Discounts.

Request For Quotation

Whether you would prefer Live Online or In-Person instruction, our electrical training courses can be tailored to meet your company's specific requirements and delivered to your employees in one location or at various locations.