Chalk River reactor down until spring

By Toronto Star


CSA Z462 Arc Flash Training - Electrical Safety Essentials

Our customized live online or in‑person group training can be delivered to your staff at your location.

  • Live Online
  • 6 hours Instructor-led
  • Group Training Available
Regular Price:
$249
Coupon Price:
$199
Reserve Your Seat Today
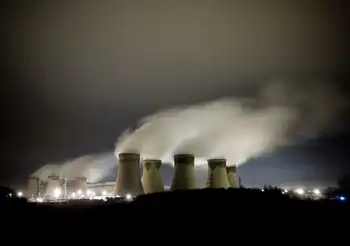
Atomic Energy of Canada Ltd. says its aging nuclear reactor at Chalk River, Ont., won't be back up and running until the spring of 2010.

In a statement, AECL says a detailed analysis has found nine sites at the reactor needing repair.

AECL says the repairs are not a public safety issue, adding there is no threat to workers on site or the environment.

Meantime, the ministers of health and natural resources issued a joint statement saying they're disappointed the Chalk River facility won't be back online until the first quarter of 2010.

Leona Aglukkaq and Lisa Raitt say in the statement that Ottawa is working with the provinces, territories, the medical community and international partners to address Canadian medical isotope needs during this outage.

Doctors have scrambled to make do with an erratic supply of isotopes since AECL powered down Chalk River in May after finding a leak of radioactive water.

Related News

Siemens Energy to unlock a new era of offshore green hydrogen production

Offshore Wind-to-Hydrogen Integration enables green hydrogen by embedding an electrolyzer in offshore turbines. Siemens Gamesa and Siemens Energy align under H2Mare to decarbonize industry, advance the Paris Agreement, and unlock scalable, off-grid renewable production.


Key Points

A method integrating electrolyzers into offshore wind turbines to generate green hydrogen and reduce carbon emissions.

✅ Integrated electrolyzer at turbine base for off-grid operation

✅ Enables scalable, cost-efficient green hydrogen production

✅ Supports decarbonization targets under Paris Agreement


To reach the Paris Agreement goals, the world will need vast amounts of green hydrogen and, with offshore wind growth accelerating, wind will provide a large portion of the power needed for its production.

Siemens Gamesa and Siemens Energy announced today that they are joining forces combining their ongoing wind-to-hydrogen developments to address one of the major challenges of our decade - decarbonizing the economy to solve the climate crisis.

The companies are contributing with their developments to an innovative solution that fully integrates an electrolyzer into an offshore wind turbine as a single synchronized system to directly produce green hydrogen. The companies intend to provide a full-scale offshore demonstration of the solution by 2025/2026. The German Federal Ministry of Education and Research, reflecting Germany's clean energy progress, announced today that the developments can be implemented as part of the ideas competition 'Hydrogen Republic of Germany'.

'Our more than 30 years of experience and leadership in the offshore wind industry, coupled with Siemens Energy's expertise in electrolyzers, brings together brilliant minds and cutting-edge technologies to address the climate crisis. Our wind turbines play a huge role in the decarbonization of the global energy system, and the potential of wind to hydrogen means that we can do this for hard-to-abate industries too. It makes me very proud that our people are a part of shaping a greener future,' said Andreas Nauen, Siemens Gamesa CEO.

Christian Bruch, CEO of Siemens Energy, explains: 'Together with Siemens Gamesa, we are in a unique position to develop this game changing solution. We are the company that can leverage its highly flexible electrolyzer technology and create and redefine the future of sustainable offshore energy production. With these developments, the potential of regions with abundant offshore wind, such as the UK offshore wind sector, will become accessible for the hydrogen economy. It is a prime example of enabling us to store and transport wind energy, thus reducing the carbon footprint of economy.'

Over a time frame of five years, Siemens Gamesa plans to invest EUR 80 million and Siemens Energy is targeting to invest EUR 40 million in the developments. Siemens Gamesa will adapt its development of the world's most powerful turbine, the SG 14-222 DD offshore wind turbine to integrate an electrolysis system seamlessly into the turbine's operations. By leveraging Siemens Gamesa's intricate knowledge and decades of experience with offshore wind, electric losses are reduced to a minimum, while a modular approach ensures a reliable and efficient operational set-up for a scalable offshore wind-to-hydrogen solution. Siemens Energy will develop a new electrolysis product to not only meet the needs of the harsh maritime offshore environment and be in perfect sync with the wind turbine, but also to create a new competitive benchmark for green hydrogen.

The ultimate fully integrated offshore wind-to-hydrogen solution will produce green hydrogen using an electrolyzer array located at the base of the offshore wind turbine tower, blazing a trail towards offshore hydrogen production. The solution will lower the cost of hydrogen by being able to run off grid, much like solar-powered hydrogen in Dubai showcases for desert environments, opening up more and better wind sites. The companies' developments will serve as a test bed for making large-scale, cost-efficient hydrogen production a reality and will prove the feasibility of reliable, effective implementation of wind turbines in systems for producing hydrogen from renewable energy.

The developments are part of the H2Mare initiative which is a lighthouse project likely to be supported by the German Federal Ministry of Education and Research ideas competition 'Hydrogen Republic of Germany'. The H2mare initiative under the consortium lead of Siemens Energy is a modular project consisting of multiple sub-projects to which more than 30 partners from industry, institutes and academia are contributing. Siemens Energy and Siemens Gamesa will contribute to the H2Mare initiative with their own developments in separate modular building blocks.

About hydrogen and its role in the green energy transition

Currently 80 million tons of hydrogen are produced each year and production is expected to increase by about 20 million tons by 2030. Just 1% of that hydrogen is currently generated from green energy sources. The bulk is obtained from natural gas and coal, emitting 830 million tons of CO2 per year, more than the entire nation of Germany or the global shipping industry. Replacing this current polluting consumption would require 820 GW of wind generating capacity, 26% more than the current global installed wind capacity. Looking further ahead, many studies suggest that by 2050 production will have grown to about 500 million tons, with a significant shift to green hydrogen already signaled by projects like Brazil's green hydrogen plant now underway. The expected growth will require between 1,000 GW and 4,000 GW of renewable capacity by 2050 to meet demand, and in the U.S. initiatives like DOE hydrogen hubs aim to catalyze this build-out, which highlights the vast potential for growth in wind power.


Related News

View more

Effort to make Philippines among best power grids in Asia

NGCP-SGCC Partnership drives transmission grid modernization in the Philippines, boosting high-voltage capacity, reliability, and resilience, while developing engineering talent via the Trailblazers Program to meet Southeast Asia best practices and utility standards.


Key Points

A partnership to modernize the Philippines' grid, boost high-voltage capacity, and upskill NGCP engineers.

✅ Modernizes transmission assets and grid reliability nationwide

✅ Trailblazers Program develops NGCP's engineering leadership

✅ SGCC knowledge transfer on UHV, high-voltage, and best practices


The National Grid Corp. of the Philippines (NGCP) is building on its partnership with State Grid Corp of China (SGCC) to expand and modernize transmission facilities, as well as enhance the capabilities of its personnel to advance the country's grid network, aligning with smart grid transformation in Egypt seen in other markets. NGCP Internal Affairs Department head Edwin Natividad said the grid operator is implementing various development programs with SGCC to make the country's power grid among the best power utilities in Asia.

"We have to look at policies aligned with best global practices, including smart grid solutions increasingly adopted worldwide, that we can choose in adopting in the Philippines too," he said. One of NGCP's flagship development program is the Trailblazers Program, the company's strategy to further develop engineers "who will not just be technical experts, but also be the change agents and movers in the NGCP organization as well as in the Philippines' power sector," Natividad said.

"Having the support of the largest utility in the world gives us comfort that this program is designed and implemented by the best in the power industry," he said. Under the program, high performing personnel participating will be prepared for bigger roles later on in their careers at NGCP.

Business ( Article MRec ), pagematch: 1, sectionmatch: 1 "The advantage of such a pool is that it provides flexibility and, eventually, organizational self-sufficiency around the current and future talent needs of NGCP," Natividad said. Now on its third edition, the Trailblazers Program has already sent 76 personnel since it started in November 2016. Natividad said more than 16 of those who previously attended similar programs have already assumed higher roles in NGCP.

Apart from technical skills development, NGCP's partnership with SGCC also provides technical development to improve on the physical transmission assets. "If you will compare the facilities being handled by SGCC with other countries, in terms of handling high voltage capability, SGCC is way ahead.

The higher the voltage it's going to be more difficult to handle," Natividad said, adding they can handle more power to distribute to power distributors. As an example, SGCC's transmission facilities can handle high voltage to as much as 1,000 kiloVolts (kV), whereas the Philippines only has one high voltage facility, the interconnection between Luzon and Visayas, which can handle 500 kV, echoing proposals for macrogrids in Canada to improve reliability.

Natividad said NGCP was the first and biggest investment of SGCC outside of China before it made investments in other parts of the world, even as cybersecurity concerns in Britain have influenced supplier choices. A consortium among businessmen Henry Sy Jr., Robert Coyuito Jr., and SGCC as technical partner, NGCP holds a 25-year concession contract to operate and maintain the country's transmission grid.

Earlier, Sy, NGCP president and CEO, said the company is targeting to become the best utility firm in Southeast Asia. Since it took over the operations and maintenance of the country's power transmission network in 2009, the grid operator has introduced major physical and technological upgrades to ageing state-owned lines and facilities, while in Great Britain an independent operator model is being advanced to reshape system operations.


Related News

View more

UK low-carbon electricity generation stalls in 2019

UK low-carbon electricity 2019 saw stalled growth as renewables rose slightly, wind expanded, nuclear output fell, coal hit record lows, and net-zero targets demand faster deployment to cut CO2 intensity below 100gCO2/kWh.


Key Points

Low-carbon sources supplied 54% of UK power in 2019, up just 1TWh; wind grew, nuclear fell, and coal dropped to 2%.

✅ Wind up 8TWh; nuclear down 9TWh amid outages

✅ Fossil fuels 43% of generation; coal at 2%

✅ Net-zero needs 15TWh per year added to 2030


The amount of electricity generated by low-carbon sources in the UK stalled in 2019, Carbon Brief analysis shows.

Low-carbon electricity output from wind, solar, nuclear, hydro and biomass rose by just 1 terawatt hour (TWh, less than 1%) in 2019. It represents the smallest annual increase in a decade, where annual growth averaged 9TWh. This growth will need to double in the 2020s to meet UK climate targets while replacing old nuclear plants as they retire.

Some 54% of UK electricity generation in 2019 came from low-carbon sources, including 37% from renewables and 20% from wind alone, underscoring wind's leading role in the power mix during key periods. A record-low 43% was from fossil fuels, with 41% from gas and just 2% from coal, also a record low. In 2010, fossil fuels generated 75% of the total.

Carbon Brief’s analysis of UK electricity generation in 2019 is based on figures from BM Reports and the Department for Business, Energy and Industrial Strategy (BEIS). See the methodology at the end for more on how the analysis was conducted.

The numbers differ from those published earlier in January by National Grid, which were for electricity supplied in Great Britain only (England, Wales and Scotland, but excluding Northern Ireland), including via imports from other countries.

Low-carbon low
In 2019, the UK became the first major economy to target net-zero greenhouse gas emissions by 2050, increasing the ambition of its legally binding Climate Change Act.

To date, the country has cut its emissions by around two-fifths since 1990, with almost all of its recent progress coming from the electricity sector.

Emissions from electricity generation have fallen rapidly in the decade since 2010 as coal power has been almost phased out and even gas output has declined. Fossil fuels have been displaced by falling demand and by renewables, such as wind, solar and biomass.

But Carbon Brief’s annual analysis of UK electricity generation shows progress stalled in 2019, with the output from low-carbon sources barely increasing compared to a year earlier.

The chart below shows low-carbon generation in each year since 2010 (grey bars) and the estimated level in 2019 (red). The pale grey bars show the estimated future output of existing low-carbon sources after old nuclear plants retire and the pale red bars show the amount of new generation needed to keep electricity sector emissions to less than 100 grammes of CO2 per kilowatt hour (gCO2/kWh), the UK’s nominal target for the sector.

 Annual electricity generation in the UK by fuel, terawatt hours, 2010-2019. Top panel: fuel by fuel. Bottom panel: cumulative total generation from all sources. Source: BEIS energy trends, BM Reports and Carbon Brief analysis. Chart by Carbon Brief using Highcharts.
As the chart shows, the UK will require significantly more low-carbon electricity over the next decade as part of meeting its legally binding climate goals.

The nominal 100gCO2/kWh target for 2030 was set in the context of the UK’s less ambitious goal of cutting emissions to 80% below 1990 levels by 2050. Now that the country is aiming to cut emissions to net-zero by 2050, that 100gCO2/kWh indicator is likely to be the bare minimum.

Even so, it would require a rapid step up in the pace of low-carbon expansion, compared to the increases seen over the past decade. On average, low-carbon generation has risen by 9TWh each year in the decade since 2010 – including a rise of just 1TWh in 2019.

Given scheduled nuclear retirements and rising demand expected by the Committee on Climate Change (CCC) – with some electrification of transport and heating – low-carbon generation would need to increase by 15TWh each year until 2030, just to meet the benchmark of 100gCO2/kWh.

For context, the 3.2 gigawatt (GW) Hinkley C new nuclear plant being built in Somerset will generate around 25TWh once completed around 2026. The world’s largest offshore windfarm, the 1.2GW Hornsea One scheme off the Yorkshire coast, will generate around 5TWh each year.

The new Conservative government is targeting 40GW of offshore wind by 2030, up from today’s figure of around 8GW. If policies are put in place to meet this goal, then it could keep power sector emissions below 100gCO2/kWh, depending on the actual performance of the windfarms built.

However, new onshore wind and solar, further new nuclear or other low-carbon generation, such as gas with carbon capture and storage (CCS), is likely to be needed if demand is higher than expected, or if the 100gCO2/kWh benchmark is too weak in the context of net-zero by 2050.

The CCC says it is “likely” to “reflect the need for more rapid deployment” of low-carbon towards net-zero emissions in its advice on the sixth UK carbon budget for 2033-2037, due in September.

Trading places
Looking more closely at UK electricity generation in 2019, Carbon Brief’s analysis shows why there was so little growth for low-carbon sources compared to the previous year.

There was another increase for wind power in 2019 (up 8TWh, 14%), with record wind generation as several large new windfarms were completed including the 1.2GW Hornsea One project in October and the 0.6GW Beatrice offshore windfarm in Q2 of 2019. But this was offset by a decline for nuclear (down 9TWh, 14%), due to ongoing outages for reactors at Hunterston in Scotland and Dungeness in Kent.

(Analysis of data held by trade organisation RenewableUK suggests some 0.6GW of onshore wind capacity also started operating in 2019, including the 0.2GW Dorenell scheme in Moray, Scotland.)

As a result of these movements, the UK’s windfarms overtook nuclear for the first time ever in 2019, becoming the country’s second-largest source of electricity generation, and earlier, wind and solar together surpassed nuclear in the UK as momentum built. This is shown in the figure below, with wind (green line, top panel) trading places with nuclear (purple) and gas (dark blue) down around 25% since 2010 but remaining the single-largest source.

 Annual electricity generation in the UK by fuel, terawatt hours, 2010-2019. Top panel: fuel by fuel. Bottom panel: cumulative total generation from all sources. Source: BEIS energy trends, BM Reports and Carbon Brief analysis. Chart by Carbon Brief using Highcharts.
The UK’s currently suspended nuclear plants are due to return to service in January and March, according to operator EDF, the French state-backed utility firm. However, as noted above, most of the UK’s nuclear fleet is set to retire during the 2020s, with only Sizewell B in Suffolk due to still be operating by 2030. Hunterston is scheduled to retire by 2023 and Dungeness by 2028.

Set against these losses, the UK has a pipeline of offshore windfarms, secured via “contracts for difference” with the government, at a series of auctions. The most recent auction, in September 2019, saw prices below £40 per megawatt hour – similar to current wholesale electricity prices.

However, the capacity contracted so far is not sufficient to meet the government’s target of 40GW by 2030, meaning further auctions – or some other policy mechanism – will be required.

Coal zero
As well as the switch between wind and nuclear, 2019 also saw coal fall below solar for the first time across a full year, echoing the 2016 moment when wind outgenerated coal across the UK, after it suffered another 60% reduction in electricity output. Just six coal plants remain in the UK, with Aberthaw B in Wales and Fiddlers Ferry in Cheshire closing in March.

Coal accounted for just 2% of UK generation in 2019, a record-low coal share since centralised electricity supplies started to operate in 1882. The fuel met 40% of UK needs as recently as 2012, but has plummeted thanks to falling demand, rising renewables, cheaper gas and higher CO2 prices.

The reduction in average coal generation hides the fact that the fuel is now often not required at all to meet the UK’s electricity needs. The chart below shows the number of days each year when coal output was zero in 2019 (red line) and the two previous years (blue).

 Cumulative number of days when UK electricity generation from renewable sources has been higher than that from fossil fuels. Source: BEIS energy trends, BM Reports and Carbon Brief analysis. Chart by Carbon Brief using Highcharts.
The 83 days in 2019 with zero coal generation amount to nearly a quarter of the year and include the record-breaking 18-day stretch without the fuel.

Great Britain has been running for a record TWO WEEKS without using coal to generate electricity – the first time this has happened since 1882.

The country’s grid has been coal-free for 45% of hours in 2019 so far.https://www.carbonbrief.org/countdown-to-2025-tracking-the-uk-coal-phase-out …

Coal generation was set for significant reductions around the world in 2019 – including a 20% reduction for the EU as a whole – according to analysis published by Carbon Brief in November.

Notably, overall UK electricity generation fell by another 9TWh in 2019 (3%), bringing the total decline to 58TWh since 2010. This is equivalent to more than twice the output from the Hinkley C scheme being built in Somerset. As Carbon Brief explained last year, falling demand has had a similar impact on electricity-sector CO2 emissions as the increase in output from renewables.

This is illustrated by the fact that the 9TWh reduction in overall generation translated into a 9TWh (6%) cut in fossil-fuel generation during 2019, with coal falling by 10TWh and gas rising marginally.

Increasingly renewable
As fossil-fuel output and overall generation have declined, the UK’s renewable sources of electricity have continued to increase. Their output has risen nearly five-fold in the past decade and their share of the UK total has increased from 7% in 2010 to 37% in 2019.

As a result, the UK’s increasingly renewable grid is seeing more minutes, hours and days during which the likes of wind, solar and biomass collectively outpace all fossil fuels put together, and on some days wind is the main source as well.

The chart below shows the number of days during each year when renewables generated more electricity than fossil fuels in 2019 (red line) and each of the previous four years (blue lines). In total, nearly two-fifths of days in 2019 crossed this threshold.

 Cumulative number of days when the UK has not generated any electricity from coal. Source: BEIS energy trends, BM Reports and Carbon Brief analysis. Chart by Carbon Brief using Highcharts.
There were also four months in 2019 when renewables generated more of the UK’s electricity than fossil fuels: March, August, September and December. The first ever such month came in September 2018 and more are certain to follow.

National Grid, which manages Great Britain’s high-voltage electricity transmission network, is aiming to be able to run the system without fossil fuels by 2025, at least for short periods. At present, it sometimes has to ask windfarm operators to switch off and gas plants to start running in order to keep the electricity grid stable.

Note that biomass accounted for 11% of UK electricity generation in 2019, nearly a third of the total from all renewables. Some two-thirds of the biomass output is from “plant biomass”, primarily wood pellets burnt at Lynemouth in Northumberland and the Drax plant in Yorkshire. The remainder was from an array of smaller sites based on landfill gas, sewage gas or anaerobic digestion.

The CCC says the UK should “move away” from large-scale biomass power plants, once existing subsidy contracts for Drax and Lynemouth expire in 2027.

Using biomass to generate electricity is not zero-carbon and in some circumstances could lead to higher emissions than from fossil fuels. Moreover, there are more valuable uses for the world’s limited supply of biomass feedstock, the CCC says, including carbon sequestration and hard-to-abate sectors with few alternatives.

Methodology
The figures in the article are from Carbon Brief analysis of data from BEIS Energy Trends chapter 5 and chapter 6, as well as from BM Reports. The figures from BM Reports are for electricity supplied to the grid in Great Britain only and are adjusted to include Northern Ireland.

In Carbon Brief’s analysis, the BM Reports numbers are also adjusted to account for electricity used by power plants on site and for generation by plants not connected to the high-voltage national grid. This includes many onshore windfarms, as well as industrial gas combined heat and power plants and those burning landfill gas, waste or sewage gas.

By design, the Carbon Brief analysis is intended to align as closely as possible to the official government figures on electricity generated in the UK, reported in BEIS Energy Trends table 5.1.

Briefly, the raw data for each fuel is in most cases adjusted with a multiplier, derived from the ratio between the reported BEIS numbers and unadjusted figures for previous quarters.

Carbon Brief’s method of analysis has been verified against published BEIS figures using “hindcasting”. This shows the estimates for total electricity generation from fossil fuels or renewables to have been within ±3% of the BEIS number in each quarter since Q4 2017. (Data before then is not sufficient to carry out the Carbon Brief analysis.)

For example, in the second quarter of 2019, a Carbon Brief hindcast estimates gas generation at 33.1TWh, whereas the published BEIS figure was 34.0TWh. Similarly, it produces an estimate of 27.4TWh for renewables, against a BEIS figure of 27.1TWh.

National Grid recently shared its own analysis for electricity in Great Britain during 2019 via its energy dashboard, which differs from Carbon Brief’s figures.


Related News

View more

Should California Fund Biofuels or Electric Vehicles?

California Biofuels vs EV Subsidies examines tradeoffs in decarbonization, greenhouse gas reductions, clean energy deployment, charging infrastructure, energy security, lifecycle emissions, and transportation sector policy to meet climate goals and accelerate sustainable mobility.


Key Points

Policy tradeoffs weighing biofuels and EVs to cut GHGs, boost energy security, and advance clean transportation.

✅ Near-term blending cuts emissions from existing fleets

✅ EVs scale with a cleaner grid and charging buildout

✅ Lifecycle impacts and costs guide optimal subsidy mix


California is at the forefront of the transition to a greener economy, driven by its ambitious goals to reduce greenhouse gas emissions and combat climate change. As part of its strategy, the state is grappling with the question of whether it should subsidize out-of-state biofuels or in-state electric vehicles (EVs) to meet these goals. Both options come with their own sets of benefits and challenges, and the decision carries significant implications for the state’s environmental, economic, and energy landscapes.

The Case for Biofuels

Biofuels have long been promoted as a cleaner alternative to traditional fossil fuels like gasoline and diesel. They are made from organic materials such as agricultural crops, algae, and waste, which means they can potentially reduce carbon emissions in comparison to petroleum-based fuels. In the context of California, biofuels—particularly ethanol and biodiesel—are viewed as a way to decarbonize the transportation sector, which is one of the state’s largest sources of greenhouse gas emissions.

Subsidizing out-of-state biofuels can help California reduce its reliance on imported oil while promoting the development of biofuel industries in other states. This approach may have immediate benefits, as biofuels are widely available and can be blended with conventional fuels to lower carbon emissions right away. It also allows the state to diversify its energy sources, improving energy security by reducing dependency on oil imports.

Moreover, biofuels can be produced in many regions across the United States, including rural areas. By subsidizing out-of-state biofuels, California could foster economic development in these regions, creating jobs and stimulating agricultural innovation. This approach could also support farmers who grow the feedstock for biofuel production, boosting the agricultural economy in the U.S.

However, there are drawbacks. The environmental benefits of biofuels are often debated. Critics argue that the production of biofuels—particularly those made from food crops like corn—can contribute to deforestation, water pollution, and increased food prices. Additionally, biofuels are not a silver bullet in the fight against climate change, as their production and combustion still release greenhouse gases. When considering whether to subsidize biofuels, California must also account for the full lifecycle emissions associated with their production and use.

The Case for Electric Vehicles

In contrast to biofuels, electric vehicles (EVs) offer a more direct pathway to reducing emissions from transportation. EVs are powered by electricity, and when coupled with renewable energy sources like solar or wind power, they can provide a nearly zero-emission solution for personal and commercial transportation. California has already invested heavily in EV infrastructure, including expanding its network of charging stations and exploring how EVs can support grid stability through vehicle-to-grid approaches, and offering incentives for consumers to purchase EVs.

Subsidizing in-state EVs could stimulate job creation and innovation within California's thriving clean-tech industry, with other states such as New Mexico projecting substantial economic gains from transportation electrification, and the state has already become a hub for electric vehicle manufacturers, including Tesla, Rivian, and several battery manufacturers. Supporting the EV industry could further strengthen California’s position as a global leader in green technology, attracting investment and fostering growth in related sectors such as battery manufacturing, renewable energy, and smart grid technology.

Additionally, the environmental benefits of EVs are substantial. As the electric grid becomes cleaner with an increasing share of renewable energy, EVs will become even greener, with lower lifecycle emissions than biofuels. By prioritizing EVs, California could further reduce its carbon footprint while also achieving its long-term climate goals, including reaching carbon neutrality by 2045.

However, there are challenges. EV adoption in California remains a significant undertaking, requiring major investments in infrastructure as they challenge state power grids in the near term, technology, and consumer incentives. The cost of EVs, although decreasing, still remains a barrier for many consumers. Additionally, there are concerns about the environmental impact of lithium mining, which is essential for EV batteries. While renewable energy is expanding, California’s grid is still reliant on fossil fuels to some degree, and in other jurisdictions such as Canada's 2019 electricity mix fossil generation remains significant, meaning that the full emissions benefit of EVs is not realized until the grid is entirely powered by clean energy.

A Balancing Act

The debate between subsidizing out-of-state biofuels and in-state electric vehicles is ultimately a question of how best to allocate California’s resources to meet its climate and economic goals. Biofuels may offer a quicker fix for reducing emissions from existing vehicles, but their long-term benefits are more limited compared to the transformative potential of electric vehicles, even as some analysts warn of policy pitfalls that could complicate the transition.

However, biofuels still have a role to play in decarbonizing hard-to-abate sectors like aviation and heavy-duty transportation, where electrification may not be as feasible in the near future. Thus, a mixed strategy that includes both subsidies for EVs and biofuels may be the most effective approach.

Ultimately, California’s decision will likely depend on a combination of factors, including technological advancements, 2021 electricity lessons, and the pace of renewable energy deployment, and the state’s ability to balance short-term needs with long-term environmental goals. The road ahead is not easy, but California's leadership in clean energy will be crucial in shaping the nation’s response to climate change.


Related News

View more

During this Pandemic, Save Money - How To Better Understand Your Electricity Bill

Commercial Electric Tariffs explain utility rate structures, peak demand charges, kWh vs kW pricing, time-of-use periods, voltage, delivery, capacity ratchets, and riders, guiding facility managers in tariff analysis for accurate energy savings.


Key Points

Commercial electric tariffs define utility pricing for energy, demand, delivery, time-of-use periods, riders, and ratchet charges.

✅ Separate kWh charges from kW peak demand fees.

✅ Verify time-of-use windows and demand interval length.

✅ Review riders, capacity ratchets, and minimum demand clauses.


Especially during these tough economic times, as major changes to electric bills are debated in some states, facility executives who don’t understand how their power is priced have been disappointed when their energy projects failed to produce expected dollar savings. Here’s how not to be one of them.

Your electric rate is spelled out in a document called a “tariff” that can be downloaded from your utility’s web page. A tariff should clearly spell out the costs for each component that is part of your rate, reflecting cost allocation practices in your region. Don’t be surprised to learn that it contains a bunch of them. Unlike residential electric rates, commercial electric bills are not based solely on the quantity of kilowatt-hours (kWh) consumed in a billing period (in the United States, that’s a month). Instead, different rates may apply to how your power is supplied, how it is delivered via electricity delivery charges, when it was consumed, its voltage, how fast it was used (in kW), and other factors.

If a tariff’s lingo and word structure are too opaque, spend some time with a utility account rep to translate it. Many state utility commissions also have customer advocates that may assist as they explore new utility rate designs that affect customers. Alternatively, for a fee, facility managers can privately chat with an energy consultant.

Common mistakes

Many facility managers try to estimate savings based on an averaged electric rate, i.e., annual electric spend divided by annual kWh. However, in markets where electricity demand is flat, such a number may obscure the fastest rising cost component: monthly peak demand charges, measured in dollars per kW (or kilo-volt-amperes, kVA).

This charge is like a monthly speeding ticket, based solely on the highest speed you drove during that time. In some areas, peak demand charges now account for 30 to 60 percent of a facility’s annual electric spend. When projecting energy cost savings, failing to separately account for kW peak demand and kWh consumption may result in erroneous results, and a lot of questions from the C-suite.

How peak demand charges are calculated varies among utilities. Some base it on the highest average speed of use across one hour in a month, while others may use the highest average speed during a 15- or 30-minute period. Others may average several of the highest speeds within a defined time period (for example, 8 a.m. to 6 p.m. on weekdays). It is whatever your tariff says it is.

Because some power-consuming (or producing) devices, including those tied to smart home electricity networks, vary in their operation or abilities, they may save money on a few — but not all — of those rate components. If an equipment vendor calculates savings from its product by using an average electric rate, take pause. Tell the vendor to return after the proposal has been redone using tariff-based numbers.

When a vendor is the only person calculating potential savings from using a product, there’s also a built-in conflict of interest: The person profiting from an equipment sale should not also be the one calculating its expected financial return. Before signing any energy project contracts, it’s essential that someone independent of the deal reviews projected savings. That person (typically an energy or engineering consultant) should be quite familiar with your facility’s electric tariff, including any special provisions, riders, discounts, etc., that may pertain. When this doesn’t happen, savings often don’t occur as planned. 

For example, some utilities add another form of demand charge, based on the highest kW in a year. It has various names: capacity, contract demand, or the generic term “ratchet charge.” Some utilities also have a minimum ratchet charge which may be based on a percent of a facility’s annual kW peak. It ensures collection of sufficient utility revenue to cover the cost of installed transmission and distribution even when a customer significantly cuts its peak demand.


Related News

View more

Electricity Demand In The Time Of COVID-19

COVID-19 Impact on U.S. Power Demand shows falling electricity load, lower wholesale prices, and resilient utilities in competitive markets, with regional differences tied to weather, renewable energy, stay-at-home orders, and hedging strategies.


Key Points

It outlines reduced load and prices, while regulatory design and hedging support utility stability across regions.

✅ Load down in NY, New England, PJM; weather drives South up.

✅ Wholesale prices fall 8-10% in key markets.

✅ Decoupling, contracts, hedging support utility earnings.


On March 27, Bloomberg New Energy Finance (BNEF) released a report on electricity demand and wholesale market prices impact from COVID-19 fallout. The model compares expected load based largely on weather with actual observed electricity demand changes.

So far, the hardest hit power grid is New York, with load down 7 and prices off by 10 percent. That’s expected, given New York City is the current epicenter of the US health crisis.

Next is New England, with 5 percent lower demand and 8 percent reduced wholesale prices for the week from March 19-25. BNEF says the numbers could go higher following advisories and orders issued March 24 for some 70 percent of the region’s population to stay at home.

Demand on the biggest grid in the US, the PJM (Pennsylvania/Jersey/Maryland), is 4 percent lower, with prices dropping 8 percent, as recent capacity auction payouts fell sharply. BNEF believes there will be more impact as stay at home orders are ramped up in several states.

California’s power demand for March 19-25 was 5 percent below what BNEF’s model expects without COVID-19 impact. That reflects a full week of stay-at-home orders from Governor Newsom issued March 19.

Health officials in Los Angeles and elsewhere expect a spike in COVID-19 cases in coming weeks. But BNEF’s model now actually projects rising electricity load for the state, due to what it calls "freakishly mild weather a year ago."

Rounding out the report, power demand is up for a band of southern states stretching from Florida to the desert Southwest, with weather more than offsetting public response to COVID-19 so far. BNEF says the Northwest’s grid "has not yet been highly impacted," while the Southeast is "generally in line" with pre-virus expectations.

Clearly, all of this data can change quickly and radically. Only California and New York are currently in full shutdown mode. Following them are New England (70 percent), the Midwest (65 percent), Texas (50 percent), PJM (50 percent) and the Northwest (50 percent).

In contrast, only small parts of Florida, the Southeast and Southwest are restricting movement. That could mean a big future increase for shut-ins, with heightened risks of electricity shut-offs that burden households and a corresponding impact on power demand.

Also, weather will play a major role on what happens to actual electricity demand, just as it always does. A very hot summer, for example, could offset virus-related shut-ins, just as it apparently is now in states like Texas. And it should be pointed out that regions vary widely by exposure to recession-sensitive sources of demand, such as heavy industry.

Most important for investors, however, is the built in protection US utility earnings enjoy from declining power demand, even amid broader energy crisis pressures facing the sector. For one thing, US power grids in California, ERCOT (Texas), MISO (Midwest), New England, New York and PJM have wholesale power markets, where producers compete for sales and the lowest bidder sets the price.

In those states, most regulated utilities don’t produce power at all. In fact, companies’ revenue is decoupled entirely from demand in California, as well as much of New England. In the roughly three-dozen states where utilities still operate as integrated monopolies, demand does affect revenue, and in many regions flat electricity demand already persists. But the cost of electricity is passed through directly to customers, whether produced or purchased.

A number of US electric companies have invested in renewable energy facilities as part of broader electrification trends nationwide. These sell their output under long-term contracts primarily with other utilities and government entities.

This isn’t a risk free business: For the past year, generators selling electricity to bankrupt PG&E Corp (PCG) have had their cash trapped at the power plant level as surety for lenders. But even PG&E has honored its contracts. And with states continuing aggressive mandates for renewable energy adoption, growth doesn’t appear at risk to COVID-19 fallout either.

The wholesale price of power from natural gas, coal and many nuclear plants was already sliding before COVID-19, due to renewables adoption and low natural gas prices, even as coal and nuclear disruptions raise reliability concerns. But here too, big producers like Exelon Corp (EXC) and Vistra Energy (VST) have employed aggressive price hedging near term, with regulated utilities and retail businesses protecting long-term health, respectively.

Bottom line: It’s early days for the COVID-19 crisis and much can still change. But so far at least, the US power industry is absorbing the blow of reduced demand, just as it’s done in previous crises.

That means future selloffs in the ongoing bear market are buying opportunities for best in class electric utilities, not a reason to sell. For top candidates, see the Conrad’s Utility Investor Portfolios and Dream Buy List in the March issue. 


Related News

View more

Sign Up for Electricity Forum’s Newsletter

Stay informed with our FREE Newsletter — get the latest news, breakthrough technologies, and expert insights, delivered straight to your inbox.

Electricity Today T&D Magazine Subscribe for FREE

Stay informed with the latest T&D policies and technologies.
  • Timely insights from industry experts
  • Practical solutions T&D engineers
  • Free access to every issue

Download the 2025 Electrical Training Catalog

Explore 50+ live, expert-led electrical training courses –

  • Interactive
  • Flexible
  • CEU-cerified