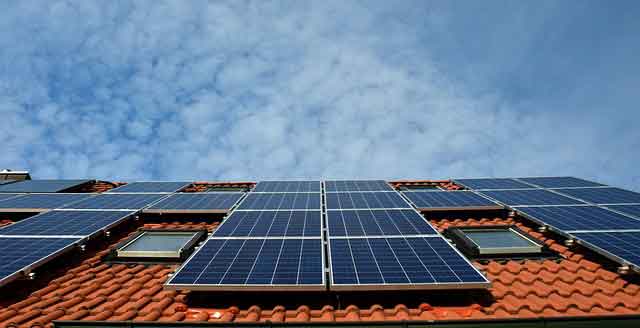
EV demand outstrips supplyÂ… again

By The Independent


CSA Z462 Arc Flash Training - Electrical Safety Essentials

Our customized live online or in‑person group training can be delivered to your staff at your location.

  • Live Online
  • 6 hours Instructor-led
  • Group Training Available
Regular Price:
$249
Coupon Price:
$199
Reserve Your Seat Today
Preorders for Nissan's LEAF electric car have already surpassed the planned capacity for the car's first year, Nissan has said.

Already 19,000 LEAF vehicles have been ordered in the United States and Japan, although the Japanese carmaker plans to produce only 10,000 by March 2011, according to auto industry website Automotive News.

Nissan will now screen customers who have preordered the vehicle to ensure that their proposed use of the vehicle is suited to the LEAF, Nissan EV chief Andy Palmer told Automotive News.

"We'll even be advising some people not to buy," he told the website. "We don't want them to be driving 300 miles 482 km a day. It's all about managing expectations. Electric cars aren't for everyone."

The Nissan LEAF is set for a launch in late 2010 in Japan, the U.S. and in Europe, where it will be available first in the UK, the Netherlands, the Republic of Ireland and Portugal.

Earlier this year, Mitsubishi announced that it was ramping up production of its competing iMiEV electric vehicle, saying that it expected to sell 9,000 units in 2010.

It will now aim to produce 18,000 units in 2011 and 30,000 in 2012.

Pricing announcements suggest that the iMiEV will be more expensive than the Nissan LEAF in all markets when it hits the roads next year.

Related News

The Netherlands Outpaces Canada in Solar Power Generation

Netherlands vs Canada Solar Power compares per capita capacity, renewable energy policies, photovoltaics adoption, rooftop installations, grid integration, and incentives like feed-in tariffs and BIPV, highlighting efficiency, costs, and public engagement.


Key Points

Concise comparison of per capita capacity, policies, technology, and engagement in Dutch and Canadian solar adoption.

✅ Dutch per capita PV capacity exceeds Canada's by wide margin.

✅ Strong incentives: net metering, feed-in tariffs, rooftop focus.

✅ Climate, grid density, and awareness drive higher yields.


When it comes to harnessing solar power, the Netherlands stands as a shining example of efficient and widespread adoption, far surpassing Canada in solar energy generation per capita. Despite Canada's vast landmass and abundance of sunlight, the Netherlands has managed to outpace its North American counterpart, which some experts call a solar power laggard in solar energy production. This article explores the factors behind the Netherlands' success in solar power generation and compares it to Canada's approach.

Solar Power Capacity and Policy Support

The Netherlands has rapidly expanded its solar power capacity in recent years, driven by a combination of favorable policies, technological advancements, and public support. According to recent data, the Netherlands boasts a significantly higher per capita solar power capacity compared to Canada, where demand for solar electricity lags relative to deployment in many regions, leveraging its smaller geographical size and dense population centers to maximize solar panel installations on rooftops and in urban areas.

In contrast, Canada's solar energy development has been slower, despite having vast areas of suitable land for solar farms. Challenges such as regulatory hurdles, varying provincial policies, and the high initial costs of solar installations have contributed to a more gradual adoption of solar power across the country. However, provinces like Ontario have seen significant growth in solar installations due to supportive government incentives and favorable feed-in tariff programs, though growth projections were scaled back after Ontario scrapped a key program.

Innovation and Technological Advancements

The Netherlands has also benefited from ongoing innovations in solar technology and efficiency improvements. Dutch companies and research institutions have been at the forefront of developing new solar panel technologies, improving efficiency rates, and exploring innovative applications such as building-integrated photovoltaics (BIPV). These advancements have helped drive down the cost of solar energy and increase its competitiveness with traditional fossil fuels.

In contrast, while Canada has made strides in solar technology research and development, commercialization and widespread adoption have been more restrained due to factors like market fragmentation and the country's reliance on other energy sources such as hydroelectricity.

Public Awareness and Community Engagement

Public awareness and community engagement play a crucial role in the Netherlands' success in solar power adoption. The Dutch government has actively promoted renewable energy through public campaigns, educational programs, and financial incentives for homeowners and businesses to install solar panels. This proactive approach has fostered a culture of energy conservation and sustainability among the Dutch population.

In Canada, while there is growing public support for renewable energy, varying levels of awareness and engagement across different provinces have impacted the pace of solar energy adoption. Provinces like British Columbia and Alberta have seen increasing interest in solar power, driven by environmental concerns, technological advancements, and economic benefits, as the country is set to hit 5 GW of installed capacity in the near term.

Climate and Geographic Considerations

Climate and geographic considerations also influence the disparity in solar power generation between the Netherlands and Canada. The Netherlands, despite its northern latitude, benefits from relatively mild winters and a higher average annual sunlight exposure compared to most regions of Canada. This favorable climate has facilitated higher solar energy yields and made solar power a more viable option for electricity generation.

In contrast, Canada's diverse climate and geography present unique challenges for solar energy deployment. Northern regions experience extended periods of darkness during winter months, limiting the effectiveness of solar panels in those areas. Despite these challenges, advancements in energy storage technologies and hybrid solar-diesel systems are making solar power increasingly feasible in remote and off-grid communities across Canada, even as Alberta faces expansion challenges related to grid integration and policy.

Future Prospects and Challenges

Looking ahead, both the Netherlands and Canada face opportunities and challenges in expanding their respective solar power capacities. In the Netherlands, continued investments in solar technology, grid infrastructure upgrades, and policy support will be crucial for maintaining momentum in renewable energy development.

In Canada, enhancing regulatory consistency, scaling up solar installations in urban and rural areas, and leveraging emerging technologies will be essential for narrowing the gap with global leaders in solar energy generation and for seizing opportunities in the global electricity market as the energy transition accelerates.

In conclusion, while the Netherlands currently generates more solar power per capita than Canada, with the Prairie Provinces poised to lead growth in the Canadian market, both countries have unique strengths and challenges in their pursuit of a sustainable energy future. By learning from each other's successes and leveraging technological advancements, both nations can further accelerate the adoption of solar power and contribute to global efforts to combat climate change.


Related News

View more

California’s Solar Power Cost Shift: A Misguided Policy Threatening Energy Equity

California Rooftop Solar Cost Shift examines PG&E rate hikes, net metering changes, and utility infrastructure spending impacts on low-income households, distributed generation, and clean energy adoption, potentially raising bills and undermining grid resilience.


Key Points

A claim that rooftop solar shifts fixed grid costs to others; critics cite PG&E rates, avoided costs, and impacts.

✅ PG&E rates outpace national average, underscoring cost drivers.

✅ Net metering cuts risk burdening low- and middle-income homes.

✅ Distributed generation avoids infrastructure spend and grid strain.


California is grappling with soaring electricity prices across the state, with Pacific Gas & Electric (PG&E) rates more than double the national average and increasing at an average of 12.5% annually over the past six years. In response, Governor Gavin Newsom issued an executive order directing state energy agencies to identify ways to reduce power costs. However, recent policy shifts targeting rooftop solar users may exacerbate the problem rather than alleviate it.

The "Cost Shift" Theory

A central justification for these pricing changes is the "cost shift" theory. This theory posits that homeowners with rooftop solar panels reduce their electricity consumption from the grid, thereby shifting the fixed costs of maintaining and operating the electrical grid onto non-solar customers. Proponents argue that this leads to higher rates for those without solar installations.

However, this theory is based on a flawed assumption: that PG&E owns 100% of the electricity generated by its customers and is entitled to full profits even for energy it does not deliver. In reality, rooftop solar users supply only about half of their energy needs and still pay for the rest. Moreover, their investments in solar infrastructure reduce grid strain and save ratepayers billions by avoiding costly infrastructure projects and reducing energy demand growth, aligning with efforts to revamp electricity rates to clean the grid as well.

Impact on Low- and Middle-Income Households

The majority of rooftop solar users are low- and middle-income households. These individuals often invest in solar panels to lower their energy bills and reduce their carbon footprint. Policy changes that undermine the financial viability of rooftop solar disproportionately affect these communities, and efforts to overturn income-based charges add uncertainty about affordability and access.

For instance, Assembly Bill 942 proposes to retroactively alter contracts for millions of solar consumers, cutting the compensation they receive from providing energy to the grid, raising questions about major changes to your electric bill that could follow if their home is sold or transferred. This would force those with solar leases—predominantly lower-income individuals—to buy out their contracts when selling their homes, potentially incurring significant financial burdens.

The Real Drivers of Rising Energy Costs

While rooftop solar users are being blamed for rising electricity rates, calls for action have mounted as the true culprits lie elsewhere. Unchecked utility infrastructure spending has been a significant factor in escalating costs. For example, PG&E's rates have increased rapidly, yet the utility's spending on infrastructure projects has often been criticized for inefficiency and lack of accountability. Instead of targeting solar users, policymakers should scrutinize utility profit motives and infrastructure investments to identify areas where costs can be reduced without sacrificing service quality.

California's approach to addressing rising electricity costs by targeting rooftop solar users is misguided. The "cost shift" theory is based on flawed assumptions and overlooks the substantial benefits that rooftop solar provides to the grid and ratepayers. To achieve a sustainable and equitable energy future, the state must focus on controlling utility spending, promoting clean energy access for all, especially as it exports its energy policies across the West, and ensuring that policies support—not undermine—the adoption of renewable energy technologies.


Related News

View more

Newsom Vetoes Bill to Codify Load Flexibility

California Governor Gavin Newsom vetoed a bill aimed at expanding load flexibility in state grid planning, citing conflicts with California’s resource adequacy framework and concerns over grid reliability and energy planning uncertainty.


Why has Newsom vetoed the Bill to Codify Load Flexibility?

Governor Gavin Newsom’s veto blocks legislation that would have required the California Energy Commission to incorporate load flexibility into the state’s energy planning and policy framework, a move that has stirred debate across the clean energy sector.

✅ Argues the bill conflicts with California’s existing Resource Adequacy system

✅ Draws backlash from clean energy and grid modernization advocates

✅ Exposes ongoing tension over how to manage renewable integration and demand response


California Governor Gavin Newsom has vetoed Assembly Bill 44, which would have required the California Energy Commission to evaluate and incorporate load management mechanisms into the state’s energy planning process. The move drew criticism from clean energy advocates who say it undermines efforts to strengthen grid reliability and reduce costs.

The bill directed the commission to adopt “upfront technical requirements and load modification protocols” that would allow load-serving entities to adjust their electrical demand forecasts. Proponents viewed this as a way to modernize California’s grid management, and to explore a revamp of electricity rates to help clean the grid, making it more responsive to demand fluctuations and renewable energy variability.

In his veto statement, Newsom said the bill was incompatible with existing energy planning frameworks, even as a looming electricity shortage remains a concern. “While I support expanding electric load flexibility, this bill does not align with the California Public Utility Commission’s Resource Adequacy framework,” he said. “As a result, the requirements of this bill would not improve electric grid reliability planning and could create uncertainty around energy resource planning and procurement processes.”

Newsom’s decision comes shortly after he signed a broad package of energy legislation that set the stage for a regional Western electricity market and extended the state’s cap-and-trade program. However, that legislative package did not include continued funding for several key grid reliability programs — including what advocates have called the world’s largest virtual power plant, a distributed network of connected devices that can balance electricity demand in real time.

Clean energy supporters saw AB 44 as a crucial step toward integrating these distributed energy resources into long-term grid planning. “With Assembly Bill 44 being vetoed, the state has missed a huge opportunity to advance common-sense policy that would have lowered costs, strengthened the grid, and unlocked the full potential of advanced energy,” said Edson Perez, California lead at Advanced Energy United.

Perez added that the setback increases pressure on lawmakers to take stronger action in the next legislative session. “The pressure is on next session to ensure that California is using all tools in its policy toolbox to build critically needed infrastructure, strengthen the grid, and bring costs down,” he said.

California’s growing use of demand response programs and virtual power plants has been central to its strategy for managing grid stress during heat waves and wildfire seasons. These systems allow utilities and customers to temporarily reduce or shift energy use, helping to prevent blackouts and reduce the need for fossil-fuel peaker plants during peak demand.

A recent report by the Brattle Group found that California’s taxpayer-funded virtual power plant could save ratepayers $206 million between 2025 and 2028 while reducing reliance on gas generation. The study, commissioned by Sunrun and Tesla Energy, highlighted the potential for flexible load management to improve both grid reliability and reduce costs, even as regulators weigh whether the state needs more power plants to ensure reliability.

Despite these findings, Newsom’s veto signals continued tension between state policymakers and clean energy advocates over how best to modernize California’s power grid. While the governor has prioritized large-scale renewable development and regional market integration, critics argue that California’s climate policy choices risk exacerbating reliability challenges and that failing to codify load flexibility could slow progress toward a more adaptive, resilient, and affordable clean energy future.


Related Articles

View more

Altmaier's new electricity forecast: the main driver is e-mobility

Germany 2030 Electricity Demand Forecast projects 658 TWh, driven by e-mobility, heat pumps, and green hydrogen. BMWi and BDEW see higher renewables, onshore wind, photovoltaics, and faster grid expansion to meet climate targets.


Key Points

A BMWi outlook to 658 TWh by 2030, led by e-mobility, plus demand from heat pumps, green hydrogen, and industry.

✅ Transport adds ~70 TWh; cars take 44 TWh by 2030

✅ Heat pumps add 35 TWh; green hydrogen needs ~20 TWh

✅ BDEW urges 70% renewables and faster grid expansion


Gross electricity consumption in Germany will increase from 595 terawatt hours (TWh) in 2018 to 658 TWh in 2030. That is an increase of eleven percent. This emerges from the detailed analysis of the development of electricity demand that the Federal Ministry of Economics (BMWi) published on Tuesday. The main driver of the increase is therefore the transport sector. According to the paper, increased electric mobility in particular contributes 68 TWh to the increase, in line with rising EV power demand trends across markets. Around 44 TWh of this should be for cars, 7 TWh for light commercial vehicles and 17 TWh for heavy trucks. If the electricity consumption for buses and two-wheelers is added, this results in electricity consumption for e-mobility of around 70 TWh.

The number of purely battery-powered vehicles is increasing according to the investigation by the BMWi to 16 million by 2030, reflecting the global electric car market momentum, plus 2.2 million plug-in hybrids. In 2018 there were only around 100,000 electric cars, the associated electricity consumption was an estimated 0.3 TWh, and plug-in mileage in 2021 highlighted the rapid uptake elsewhere. For heat pumps, the researchers predict an increase in demand by 35 TWh to around 42 TWh. They estimate the electricity consumption for the production of around 12.5 TWh of green hydrogen in 2030 to be just under 20 TWh. The demand at battery factories and data centers will increase by 13 TWh compared to 2018 by this point in time. In the data centers, there is no higher consumption due to more efficient hardware despite advancing digitization.

The updated figures are based on ongoing scenario calculations by Prognos, in which the market researchers took into account the goals of the Climate Protection Act for 2030 and the wider European electrification push for decarbonization. In the preliminary estimate presented by Federal Economics Minister Peter Altmaier (CDU) in July, a range of 645 to 665 TWh was determined for gross electricity consumption in 2030. Previously, Altmaier officially said that electricity demand in this country would remain constant for the next ten years. In June, Chancellor Angela Merkel (CDU) called for an expanded forecast that would have to include trends in e-mobility adoption within a decade and the Internet of Things, for example.

Higher electricity demand
The Federal Association of Energy and Water Management (BDEW) is assuming an even higher electricity demand of around 700 TWh in nine years. In any case, a higher share of renewable energies in electricity generation of 70 percent by 2030 is necessary in order to be able to achieve the climate targets and to address electricity price volatility risks. The expansion paths urgently need to be increased and obstacles removed. This could mean around 100 gigawatts (GW) for onshore wind turbines, 11 GW for biomass and at least 150 GW for photovoltaics by 2030. Faster network expansion and renovation will also become even more urgent, as electric cars challenge grids in many regions.


Related News

View more

Imported coal volumes up 17% during Apr-Oct as domestic supplies shrink

India Thermal Power Coal Imports surged 17.6% as CEA-monitored plants offset weaker CIL and SCCL supplies, driven by Saubhagya-led electricity demand, regional power deficits, and varied consumption across Uttar Pradesh, Bihar, Maharashtra, and Gujarat.


Key Points

Fuel volumes imported for Indian thermal plants, tracked by CEA, reflecting shifts in CIL/SCCL supply, demand, and regional power deficits.

✅ Imports up 17.6% as domestic CIL/SCCL deliveries lag targets

✅ Saubhagya-driven demand lifts generation in key beneficiary states

✅ Industrial slowdowns cut usage in Maharashtra, Tamil Nadu, Gujarat


The receipt of imported coal by thermal power plants, where plant load factors have risen, has shot up by 17.6 per cent during April-October. The coal import volumes refer to the power plants monitored by the Central Electricity Authority (CEA), and come amid moves to ration coal supplies as electricity demand surges, a power update report from CARE Ratings showed.

Imports escalated as domestic supplies by Coal India Ltd (CIL) and another state run producer- Singareni Collieries Company Ltd (SCCL) dipped in the period, after earlier shortages that have since eased in later months. Rate of supplies by the two coal companies to the CEA monitored power stations stood at 80.4 per cent, indicating a shortfall of 19.6 per cent against the allocated quantity.

According to the study by CARE Ratings, total coal supplied by CIL and SCCL to the power sector stood at 315.9 million tonnes (mt) during April-October as against 328.5 mt in the comparable period of last fiscal year.

The study noted that growth in power generation during the April-October 2019, with India now the third-largest electricity producer globally, was on account of higher demand from Pradhan Mantri Sahaj Bijli Har Ghar Yojana or Saubhagya Scheme beneficiary states. Providing connection to households in order to achieve 100% per cent electrification has in part helped the sector avert de-growth, as part of efforts to rewire Indian electricity and expand access.

Large states namely Uttar Pradesh, Bihar, Punjab, West Bengal and Rajasthan have recorded over five per cent growth in consumption of power. These states along with Odisha, Madhya Pradesh and Assam accounted for 75 per cent of the beneficiaries under the Saubhagya Scheme (Household Electrification Scheme). The ongoing economic downturn has led to a sharp fall in electricity demand from industrialised states. Maharashtra, which is also the largest power consuming state in India, recorded a decline in consumption of 5.6 per cent.

Other states namely Tamil Nadu, Telangana, Gujarat and Odisha too recorded fall in power consumed, echoing global dips in daily electricity demand seen later during the pandemic. These states house large clusters of mining, automobile, cement and other manufacturing industries, and a decline in these sectors led to fall in demand for power across these states. - The demand-supply gap or power deficit has remained at 0.6 per cent during the April-October 2019. North-East reported 4.8 per cent of power deficit followed by Northern Region at 1.3 per cent. Within Northern Region, Jammu & Kashmir and Uttar Pradesh accounted for 65 per cent and 30 per cent respectively of the regions power supply deficit.


Related News

View more

B.C. electricity demand hits an all-time high

BC Hydro Peak Electricity Demand reached a record 10,902 megawatts during a cold snap, driven by home heating. Peak hours surged; load shifting and energy conservation can ease strain on the grid and lower bills.


Key Points

Record winter peak of 10,902 MW, set during a cold snap, largely from home heating demand at peak hours.

✅ All-time high load: 10,902 MW between 5 and 6 p.m., Dec. 27.

✅ Cold snap increased home heating demand during peak hours.

✅ Shift laundry and dishwashers off-peak; use programmable thermostats.


BC Hydro says the province set a new record for peak electricity demand on Monday as temperatures hit extreme lows, and Quebec shattered consumption records during similar cold weather.

Between 5 and 6 p.m. on Dec. 27, demand for electricity hit an all-time high of 10,902 megawatts, which is higher than the previous record of 10,577 megawatts set in 2020, and follows a record-breaking year in 2021 for the utility.

“The record represents a single moment in the hour when demand for electricity was the highest yesterday,” says Simi Heer, BC Hydro spokesperson, in a statement. “Most of the increase is likely due to additional home heating required during this cold snap.”

In addition to the peak demand record on Monday, BC Hydro has observed an overall increase in electricity demand since Friday, and has noted that cryptocurrency mining electricity use is an emerging load in the province as well. Monday’s hourly peak demand was 18 per cent higher than Friday’s, while Calgary's electricity use soared during a frigid February, underscoring how cold snaps strain regional grids.

“BC Hydro has enough supply options in place to meet increasing electricity demand,” adds Heer, and pointed to customer supports like a winter payment plan for households managing higher bills. “However, if British Columbians want to help ease some of the demand on the system during peak times, we encourage shifting activities like doing laundry or running dishwashers to earlier in the day or later in the evening.”

BC Hydro is also offering energy conservation tips for people looking to lower their electricity use and their electricity bills, noting that Earth Hour once saw electricity use rise in the province:

Manage your home heating actively by turning the heat down when no one his home or when everyone is sleeping. Consider installing a programmable thermostat to automatically adjust temperatures at different times based on your family's activities, and remember that in warmer months wasteful air conditioning can add $200 to summer energy bills. BC Hydro recommends the following temperatures:

16 degrees Celsius when sleeping or away from home
21 degrees Celsius when relaxing, watching TV
18 degrees Celsius when doing housework or cleaning


Related News

View more

Sign Up for Electricity Forum’s Newsletter

Stay informed with our FREE Newsletter — get the latest news, breakthrough technologies, and expert insights, delivered straight to your inbox.

Electricity Today T&D Magazine Subscribe for FREE

Stay informed with the latest T&D policies and technologies.
  • Timely insights from industry experts
  • Practical solutions T&D engineers
  • Free access to every issue

Download the 2025 Electrical Training Catalog

Explore 50+ live, expert-led electrical training courses –

  • Interactive
  • Flexible
  • CEU-cerified