SaskPower launches new energy efficiency programs

By SaskPower


CSA Z463 Electrical Maintenance

Our customized live online or in‑person group training can be delivered to your staff at your location.

  • Live Online
  • 6 hours Instructor-led
  • Group Training Available
Regular Price:
$249
Coupon Price:
$199
Reserve Your Seat Today
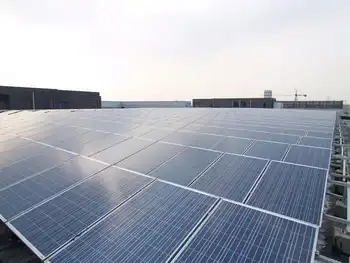
SaskPower is expanding its energy efficiency programs to help large commercial and industrial customers reduce electricity use and upgrade lighting.

"SaskPower's electrical infrastructure and energy efficiency expertise are crucial for our province’s growing business sector," said Rob Norris, Minister Responsible for SaskPower. "The new programs will ensure businesses and industrial customers are getting maximum value for their energy expenses and access to discounted energy efficient lighting.” Delivered in partnership with ICF Marbek an environment and energy management consulting firm the Industrial Energy Optimization Program will:

- Offer the technical assistance of a dedicated energy support team to industrial customers, in order to identify energy-saving opportunities that qualify under the program

- Provide financial incentives that help advance the adoption of energy efficient practices and,

- Support the development and implementation of energy-saving capital projects.

The expanded Commercial Lighting Incentive Program will give the provinceÂ’s 30,000 businesses access to more than 30 choices of premium energy efficient lighting. Businesses can start saving on their lighting bills as soon as their electrical contractor purchases products through participating lighting distributors.

"Improving energy efficiency programs for our industrial customers is an environmentally sound and cost-effective way to meet our province's growing electricity needs. The more our customers can cut consumption, the better we can manage the number of power stations and power lines we need to build,” said Robert Watson, President and CEO, SaskPower.

Depending on customer response, the Commercial Lighting Incentive Program could deliver 12 megawatts MW of energy savings by 2017, while the Industrial Energy Optimization Program could deliver 10 megawatts of energy savings. SaskPowerÂ’s long-term goal is to reduce customer demand for electricity by 100 megawatts by 2017.

For details about these programs, visit www.saskpower.com/save_power

Related News

India's electricity demand falls at the fastest pace in at least 12 years

India Industrial Output Slowdown deepens as power demand slumps, IIP contracts, and electricity, manufacturing, and mining weaken; capital goods plunge while RBI rate cuts struggle to lift GDP growth, infrastructure, and fuel demand.


Key Points

A downturn where IIP contracts as power demand, manufacturing, mining, and capital goods fall despite RBI rate cuts.

✅ IIP fell 4.3% in Sep, worst since Feb 2013.

✅ Power demand dropped for a third month, signaling weak industry.

✅ Capital goods output plunged 20.7%, highlighting weak investment.


India's power demand fell at the fastest pace in at least 12 years in October, signalling a continued decline in the industrial output, mirroring how China's power demand dropped when plants were shuttered, according to government data. Electricity has about 8% weighting in the country's index for industrial production.

India needs electricity to fuel its expanding economy and has at times rationed coal supplies when demand surged, but a third decline in power consumption in as many months points to tapering industrial activity in a nation that aims to become a $5 trillion economy by 2024.

India's industrial output fell at the fastest pace in over six years in September, adding to a series of weak indicators that suggests that the country’s economic slowdown is deep-rooted and interest rate cuts alone may not be enough to revive growth.

Annual industrial output contracted 4.3% in September, government data showed on Monday. It was the worst performance since a 4.4% contraction in February 2013, according to Refinitiv data.

Analysts polled by Reuters had forecast industrial output to fall 2% for the month.

“A contraction of industrial production by 4.3% in September is serious and indicative of a significant slowdown as both investment and consumption demand have collapsed,” said Rupa Rege Nitsure, chief economist of L&T Finance Holdings.

The industrial output figure is the latest in a series of worrying economic data in Asia's third largest economy, which is also the world's third-largest electricity producer as well.

Economists say that weak series of data could mean economic growth for July-September period will remain near April-June quarter levels of 5%, which was a six-year low, and some analysts argue for rewiring India's electricity to bolster productivity. The Indian government is likely to release April-September economic growth figures by the end of this month.

Subdued inflation and an economic slowdown have prompted the Reserve Bank of India (RBI) to cut interest rates by a total of 135 basis points this year, while coal and electricity shortages eased in recent months.

“These are tough times for the RBI, as it cannot do much about it but there will be pressures on it to act ...Blunt tools like monetary policy may not be effective anymore,” Nitsure said.

Data showed in September mining sector fell 8.5%, while manufacturing and electricity fell 3.9% and 2.6% respectively, even as imported coal volumes rose during April-October. Capital goods output during the month fell 20.7%, indicating sluggish demand.

“IIP (Index of Industrial Production) growth in October 2019 is also likely to be in negative territory and only since November 2019 one can expect mild IIP expansion, said Devendra Kumar Pant, Chief Economist and Senior Director, Public Finance, India Ratings & Research (Fitch Group).

Infrastructure output, which comprises eight main sectors, in September showed a contraction of 5.2%, the worst in 14 years, even as global daily electricity demand fell about 15% during pandemic lockdowns.

India's fuel demand fell to its lowest in more than two years in September, with consumption of diesel to its lowest levels since January 2017. Diesel and gasoline together make up over 7.4% of the IIP weightage.

In 2019/20 India's fuel demand — also seen as an indicator of economic and industrial activity — is expected to post the slowest growth in about six years.


Related News

View more

How Energy Use Has Evolved Throughout U.S. History

U.S. Energy Transition traces the shift from coal and oil to natural gas, nuclear power, and renewables like wind and solar, driven by efficiency, grid modernization, climate goals, and economic innovation.


Key Points

The U.S. Energy Transition is the shift from fossil fuels to cleaner power, driven by tech, policy, and markets.

✅ Shift from coal and oil to gas, nuclear, wind, and solar

✅ Enabled by grid modernization, storage, and efficiency

✅ Aims to cut emissions while ensuring reliability and affordability


The evolution of energy use in the United States is a dynamic narrative that reflects technological advancements, economic shifts, environmental awareness, and societal changes over time. From the nation's early reliance on wood and coal to the modern era dominated by oil, natural gas, and renewable sources, the story of energy consumption in the U.S. is a testament to innovation and adaptation.

Early Energy Sources: Wood and Coal

In the early days of U.S. history, energy needs were primarily met through renewable resources such as wood for heating and cooking. As industrialization took hold in the 19th century, coal emerged as a dominant energy source, fueling steam engines and powering factories, railways, and urban growth. The widespread availability of coal spurred economic development and shaped the nation's infrastructure.

The Rise of Petroleum and Natural Gas

The discovery and commercialization of petroleum in the late 19th century transformed the energy landscape once again. Oil quickly became a cornerstone of the U.S. economy, powering transportation, industry, and residential heating, and informing debates about U.S. energy security in policy circles. Concurrently, natural gas emerged as a significant energy source, particularly for heating and electricity generation, as pipelines expanded across the country.

Electricity Revolution

The 20th century witnessed a revolution in electricity generation and consumption, and understanding where electricity comes from helps contextualize how systems evolved. The development of hydroelectric power, spurred by projects like the Hoover Dam and Tennessee Valley Authority, provided clean and renewable energy to millions of Americans. The widespread electrification of rural areas and the proliferation of appliances in homes and businesses transformed daily life and spurred economic growth.

Nuclear Power and Energy Diversification

In the mid-20th century, nuclear power emerged as a promising alternative to fossil fuels, promising abundant energy with minimal greenhouse gas emissions. Despite concerns about safety and waste disposal, nuclear power plants became a significant part of the U.S. energy mix, providing a stable base load of electricity, even as the aging U.S. power grid complicates integration of variable renewables.

Renewable Energy Revolution

In recent decades, the U.S. has seen a growing emphasis on renewable energy sources such as wind, solar, and geothermal power, yet market shocks and high fuel prices alone have not guaranteed a rapid green revolution, prompting broader policy and investment responses. Advances in technology, declining costs, and environmental concerns have driven investments in clean energy infrastructure and policies promoting renewable energy adoption. States like California and Texas lead the nation in wind and solar energy production, demonstrating the feasibility and benefits of transitioning to sustainable energy sources.

Energy Efficiency and Conservation

Alongside shifts in energy sources, improvements in energy efficiency and conservation have played a crucial role in reducing per capita energy consumption and greenhouse gas emissions. Energy-efficient appliances, building codes, and transportation innovations have helped mitigate the environmental impact of energy use while reducing costs for consumers and businesses, and weather and economic factors also influence demand; for example, U.S. power demand fell in 2023 on milder weather, underscoring the interplay between efficiency and usage.

Challenges and Opportunities

Looking ahead, the U.S. faces both challenges and opportunities in its energy future, as recent energy crisis effects ripple across electricity, gas, and EVs alike. Addressing climate change requires further investments in renewable energy, grid modernization, and energy storage technologies. Balancing energy security, affordability, and environmental sustainability remains a complex task that requires collaboration between government, industry, and society.

Conclusion

The evolution of energy use throughout U.S. history reflects a continuous quest for innovation, economic growth, and environmental stewardship. From wood and coal to nuclear power and renewables, each era has brought new challenges and opportunities in meeting the nation's energy needs. As the U.S. transitions towards a cleaner and more sustainable energy future, leveraging technological advancements and embracing policy solutions, amid debates over U.S. energy dominance, will be essential in shaping the next chapter of America's energy story.


Related News

View more

How Electricity Gets Priced in Europe and How That May Change

EU Power Market Overhaul targets soaring electricity prices by decoupling gas from power, boosting renewables, refining price caps, and stabilizing grids amid inflation, supply shocks, droughts, nuclear outages, and intermittent wind and solar.


Key Points

EU plan to redesign electricity pricing, curb gas-driven costs, boost renewables, and protect consumers from volatility.

✅ Decouples power prices from marginal gas generation

✅ Caps non-gas revenues to fund consumer relief

✅ Supports grid stability with storage, demand response, LNG


While energy prices are soaring around the world, Europe is in a particularly tight spot. Its heavy dependence on Russian gas -- on top of droughts, heat waves, an unreliable fleet of French nuclear reactors and a continent-wide shift to greener but more intermittent sources like solar and wind -- has been driving electricity bills up and feeding the highest inflation in decades. As Europe stands on the brink of a recession, and with the winter heating season approaching, officials are considering a major overhaul of the region’s power market to reflect the ongoing shift from fossil fuels to renewables.

1. How is electricity priced? 
Unlike oil or natural gas, there’s no efficient way to save lots of electricity to use in the future, though projects to store electricity in gas pipes are emerging. Commercial use of large-scale batteries is still years away. So power prices have been set by the availability at any given moment. When it’s really windy or sunny, for example, then more is produced relatively cheaply and prices are lower. If that supply shrinks, then prices rise because more generators are brought online to help meet demand -- fueled by more expensive sources. The way the market has long worked is that it is that final technology, or type of plant, needed to meet the last unit of consumption that sets the price for everyone. In Europe this year, that has usually meant natural gas. 

2. What is the relationship between power and gas? 
Very close. Across western Europe, gas plants have been a vital part of the energy infrastructure for decades, with Irish price spikes highlighting dispatchable power risks, fed in large part by supplies piped in from Siberia. Gas-fired plants were relatively quick to build and the technology straightforward, at least compared with nuclear plants and burns cleaner than coal. About 18% of Europe’s electricity was generated at gas plants last year; in 2020 about 43% of the imported gas came from Russia. Even during the depths of the Cold War, there’d never been a serious supply problem -- until the relationship with Russia deteriorated this year after it invaded Ukraine. Diversifying away from Russia, such as by increasing imports of liquefied natural gas, requires new infrastructure that takes a lot of time and money.

3. Why does it work this way? 
In theory, the relationship isn’t different from that with coal, for example. But production hiccups and heatwave curbs on plants from nuclear in France to hydro in Spain and Norway significantly changed the generation picture this year, and power hit records as plants buckled in the heat. Since coal-fired and nuclear plants are generally running all the time anyway, gas plants were being called upon more often -- at times just to keep the lights on as summer temperatures hit records. And with the war in Ukraine resulting in record gas prices, that pushed up overall production costs. It’s that relationship that has made the surging gas price the driver for electricity prices. And since the continent is all connected, it has pushed up prices across the region. The value of the European power market jumped threefold last year, to a record 836 billion euros ($827 billion today).

4. What’s being considered? 
With large parts of European industry on its knees and households facing jumps in energy bills of several hundred percent, as record electricity prices ripple through markets, the pressure on governments and the European Union to intervene has never been higher. One major proposal is to impose a price cap on electricity from non-gas producers, with the difference between that and the market price channeled to relief for consumers. While it sounds simple, any such changes would rip up a market design that’s worked for decades and could threaten future investments because of unintended consequences.


5. How did this market evolve?
The Nordic region and the British market were front-runners in the 1990s, then Germany followed and is now the largest by far. A trader can buy and sell electricity delivered later on same day in blocks of an hour or even down to 15-minute periods, to meet sudden demand or take advantage of price differentials. The price for these contracts is decided entirely by the supply and demand, how much the wind is blowing or which coal plants are operating, for example. Demand tends to surge early in the morning and late afternoon. This system was designed when fossil fuels provided the bulk of power. Now there are more renewables, which are less predictable, with wind and solar surpassing gas in EU generation last year, and the proposed changes reflect that shift. 

6. What else have governments done?
There are also traders who focus on longer-dated contracts covering periods several years ahead, where broader factors such as expected economic output and the extent to which renewables are crowding out gas help drive prices. This year’s wild price swings have prompted countries including Germany, Sweden and Finland to earmark billions of euros in emergency liquidity loans to backstop utilities hit with sudden margin calls on their trading.


Related News

View more

Duke Energy seeks changes in how solar owners are paid for electricity

Duke Energy Net Metering Proposal updates rooftop solar compensation with time-of-use rates, lower grid credits, and a minimum charge, aligning payments with electricity demand in North Carolina pending regulators' approval.


Key Points

A plan to swap flat credits for time-of-use rates and a minimum charge for rooftop solar customers in North Carolina.

✅ Time-of-use credits vary by grid demand

✅ $10 minimum use charge plus $14 basic fee

✅ Aims to align solar payouts with actual electricity value


Duke Energy has proposed new rules for how owners of rooftop solar panels are paid for electricity they send to the electric grid. It could mean more complexity and lower payments, but the utility says rates would be fairer.

State legislators have called for changes in the payment rules — known as "net metering" policies that allow households to sell power back to energy firms.

Right now, solar panel owners who produce more electricity than they need get credits on their bills, equal to whatever they pay for electricity. Under the proposed changes, the credit would be lower and would vary according to electricity demand, said Duke spokesperson Randy Wheeless.

"So in a cold winter morning, like now, you would get more, but maybe in a mild spring day, you would get less," Wheeless said Tuesday. "So, it better reflects what the price of electricity is."

Besides setting rates by time of use, solar owners also would have to pay a minimum of $10 a month for electricity, even if they don't use any from the grid. That's on top of Duke's $14 basic charge. Duke said it needs the extra revenue to pay for grid infrastructure to serve solar customers.

The proposal is the result of an agreement between Duke and solar industry groups — the North Carolina Sustainable Energy Association; the Southern Environmental Law Center, which represented Vote Solar and the Southern Alliance for Clean Energy; solar panel maker Sunrun Inc.; and the Solar Energy Industries Association.

The deal is similar to one approved by regulators in South Carolina last year, while in Nova Scotia a solar charge was delayed after controversy.

Daniel Brookshire of the North Carolina Sustainable Energy Association said he hopes the agreement will help the solar industry.

"We reached an agreement here that we think will provide certainty over the next decade, at least, for those interested in pursuing solar for their homes, and for our members who are solar installers," Brookshire said.

But other environmental and consumer groups oppose the changes, amid debates over who pays for grid upgrades elsewhere. Jim Warren with NC WARN said the rules would slow the expansion of rooftop solar in North Carolina.

"It would make it even harder for ordinary people to go solar," Warren said. "This would make it more complicated and more expensive, even for wealthier homeowners."

State regulators still must approve the proposal, even as courts weigh aspects of the electricity monopoly in related solar cases. If state regulators approve it, rates for new net metering customers would take effect Jan. 1, 2023.


Related News

View more

Renewables are not making electricity any more expensive

Renewables' Impact on US Wholesale Electricity Prices is clear: DOE analysis shows wind and solar, capacity gains, and natural gas lowering rates, shifting daily patterns, and triggering occasional negative pricing in PJM and ERCOT.


Key Points

DOE data show wind and solar lower wholesale prices, reshape price curves, and cause negative pricing in markets.

✅ Natural gas price declines remain the largest driver of cheaper power

✅ Wind and solar shift seasonal and time-of-day price patterns

✅ Negative wholesale prices appear near high wind and solar output


One of the arguments that's consistently been raised against doing anything about climate change is that it will be expensive. On the more extreme end of the spectrum, there have been dire warnings about plunging standards of living due to skyrocketing electricity prices. The plunging cost of renewables like solar cheaper than gas has largely silenced these warnings, but a new report from the Department of Energy suggests that, even earlier, renewables were actually lowering the price of electricity in the United States.


Plunging prices
The report focuses on wholesale electricity prices in the US. Note that these are distinct from the prices consumers actually pay, which includes taxes, fees, payments to support the grid that delivers the electricity, and so on. It's entirely possible for wholesale electricity prices to drop even as consumers end up paying more, and market reforms determine how those changes are passed through. That said, large changes in the wholesale price should ultimately be passed on to consumers to one degree or another.

The Department of Energy analysis focuses on the decade between 2008 and 2017, and it includes an overall analysis of the US market, as well as large individual grids like PJM and ERCOT and, finally, local prices. The decade saw a couple of important trends: low natural gas prices that fostered a rapid expansion of gas-fired generators and the rapid expansion of renewable generation that occurred concurrently with a tremendous drop in price of wind and solar power.

Much of the electricity generated by renewables in this time period would be more expensive than that generated by wind and solar installed today. Not only have prices for the hardware dropped, but the hardware has improved in ways that provide higher capacity factors, meaning that they generate a greater percentage of the maximum capacity. (These changes include things like larger blades on wind turbines and tracking systems for solar panels.) At the same time, operating wind and solar is essentially free once they're installed, so they can always offer a lower price than competing fossil fuel plants.

With those caveats laid out, what does the analysis show? Almost all of the factors influencing the wholesale electricity price considered in this analysis are essentially neutral. Only three factors have pushed the prices higher: the retirement of some plants, the rising price of coal, and prices put on carbon, which only affect some of the regional grids.

In contrast, the drop in the price of natural gas has had a very large effect on the wholesale power price. Depending on the regional grid, it's driven a drop of anywhere from $7 to $53 per megawatt-hour. It's far and away the largest influence on prices over the past decade.


Regional variation and negative prices
But renewables have had an influence as well. That influence has ranged from roughly neutral to a cost reduction of $2.2 per MWh in California, largely driven by solar. While the impact of renewables was relatively minor, it is the second-largest influence after natural gas prices, and the data shows that wind and solar are reducing prices rather than increasing them.

The reports note that renewables are influencing wholesale prices in other ways, however. The growth of wind and solar caused the pattern of seasonal price changes to shift in areas of high wind and solar, as seen with solar reshaping prices in Northern Europe as daylight hours and wind patterns shift with the seasons. Similarly, renewables have a time-of-day effect for similar reasons, helping explain why the grid isn't 100% renewable today, which also influences the daily timing price changes, something that's not an issue with fossil fuel power.

A map showing the areas where wholesale electricity prices have gone negative, with darker colors indicating increased frequency.
Enlarge / A map showing the areas where wholesale electricity prices have gone negative, with darker colors indicating increased frequency.

US DOE
One striking feature of areas where renewable power is prevalent is that there are occasional cases in which an oversupply of renewable energy produces negative electricity prices in the wholesale market. (In the least-surprising statement in the report, it concludes that "negative prices in high-wind and high-solar regions occurred most frequently in hours with high wind and solar output.") In most areas, these negative prices are rare enough that they don't have a significant influence on the wholesale price.

That's not true everywhere, however. Areas on the Great Plains see fairly frequent negative prices, and they're growing in prevalence in areas like California, the Southwest, and the northern areas of New York and New England, while negative prices in France have been observed in similar conditions. In these areas, negative wholesale prices near solar plants have dropped the overall price by 3%. Near wind plants, that figure is 6%.

None of this is meant to indicate that there are no scenarios where expanded renewable energy could eventually cause wholesale prices to rise. At sufficient levels, the need for storage, backup plants, and grid management could potentially offset their low costs, a dynamic sometimes referred to as clean energy's dirty secret by analysts. But it's clear we have not yet reached that point. And if the prices of renewables continue to drop, then that point could potentially recede fast enough not to matter.


Related News

View more

Enbridge Insists Storage Hub Lives On After Capital Power Pullout

Enbridge Alberta CCS Project targets carbon capture and storage in Alberta, capturing emissions from industrial emitters to advance net-zero goals, leveraging carbon pricing, regulatory support, and a hub model despite a key partner's exit.


Key Points

A proposed Alberta carbon capture hub by Enbridge to store industrial emissions and support net-zero targets.

✅ Seeks emitters across power, oil and gas, and heavy industry

✅ Backed by carbon pricing, regulation, and net-zero mandates

✅ Faces high capex, storage risk, and anchor-tenant uncertainty


Enbridge Inc., a Canadian energy giant, is digging its heels in on its proposed carbon capture and storage (CCS) project in Alberta. This comes despite the recent withdrawal of Capital Power, a major potential emitter that was expected to utilize the CCS technology. Enbridge maintains the project remains viable, but questions linger about its future viability without a cornerstone anchor.

The CCS project, envisioned as a major carbon capture hub in Alberta, aimed to capture emissions from industrial facilities and permanently store them underground. This technology has the potential to play a significant role in reducing greenhouse gas emissions and mitigating the effects of climate change, alongside grid solutions like bridging the Alberta-B.C. electricity gap that can complement decarbonization efforts.

Capital Power's decision to shelve its $2.4 billion Genesee Generating Station project, which was designed to integrate with the CCS hub, threw a wrench into Enbridge's plans. The Genesee project was expected to be a key source of emissions for capture and storage, and its status is being weighed as Ottawa advances the federal coal plan to phase out unabated coal.

Enbridge, however, remains optimistic. The company cites ongoing discussions with other potential emitters interested in utilizing the CCS technology, amid new funding signals such as the U.S. DOE's $110M for CCUS that highlight momentum. They believe the project holds significant value despite Capital Power's departure.

"We are confident in the long-term viability of the project and continue to actively engage with potential customers," said Enbridge spokesperson Rachel Giroux. "Carbon capture and storage is a critical technology for achieving net-zero emissions, and we believe there is a strong business case for our CCS project."

Enbridge's confidence hinges on several factors. Firstly, they believe there is a growing appetite for CCS technology amongst industrial facilities facing increasing pressure to reduce their carbon footprint. Regulations and carbon pricing mechanisms, including new U.S. EPA power plant rules that test CCS readiness, could further incentivize companies to adopt CCS solutions.

Secondly, Enbridge highlights the potential for capturing emissions from not just power plants but also from other industrial sectors like oil and gas production and clean hydrogen projects in Canada, where reforming processes can generate CO2. This broader application could significantly increase the captured carbon volume and strengthen the project's economic viability.

However, skepticism remains. Critics point to the high upfront costs associated with CCS development and the nascent stage of the technology. They argue that without a guaranteed stream of captured emissions, the project might not be financially sound. Additionally, the long-term safety and effectiveness of large-scale carbon storage solutions remain under scrutiny.

The success of Enbridge's CCS project hinges on attracting new emitters. Replacing Capital Power's contribution will be a significant challenge. Enbridge will need to demonstrate the project's economic viability and navigate the complex regulatory landscape surrounding CCS technology.

The Alberta government's position on CCS is crucial. While the government has expressed support for the technology, the level of financial and regulatory incentives offered will significantly impact investor confidence, especially as the IEA net-zero outlook underscores Canada's need for much more electricity. A clear and stable policy framework will be essential for attracting emitters to the project.

The future of Enbridge's CCS project remains uncertain. Capital Power's withdrawal is a setback, but Enbridge's continued commitment suggests they believe the technology holds promise. Whether they can find enough emitters to justify the project's development will be a critical test. The outcome will have significant implications for the future of CCS technology in Alberta and Canada's broader efforts to achieve net-zero emissions, including Canada-Germany clean energy cooperation that seeks to scale low-carbon fuels.


Related News

View more

Sign Up for Electricity Forum’s Newsletter

Stay informed with our FREE Newsletter — get the latest news, breakthrough technologies, and expert insights, delivered straight to your inbox.

Electricity Today T&D Magazine Subscribe for FREE

Stay informed with the latest T&D policies and technologies.
  • Timely insights from industry experts
  • Practical solutions T&D engineers
  • Free access to every issue

Live Online & In-person Group Training

Advantages To Instructor-Led Training – Instructor-Led Course, Customized Training, Multiple Locations, Economical, CEU Credits, Course Discounts.

Request For Quotation

Whether you would prefer Live Online or In-Person instruction, our electrical training courses can be tailored to meet your company's specific requirements and delivered to your employees in one location or at various locations.