Down, Danger, Dial: Electrical Safety Tips to Help British Columbians Stay Safe During Storm Season


Arc Flash Training CSA Z462 - Electrical Safety Essentials

Our customized live online or in‑person group training can be delivered to your staff at your location.

  • Live Online
  • 6 hours Instructor-led
  • Group Training Available
Regular Price:
$249
Coupon Price:
$199
Reserve Your Seat Today

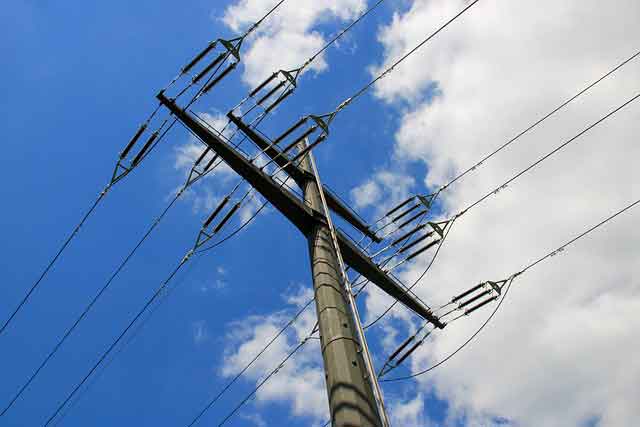
BC Hydro Winter Electrical Safety highlights hazards from fallen power lines, high winds, and heavy rain; stay 10 metres back, dial 9-1-1, and follow outage, storm restoration, and emergency responder guidance.


Key Points

BC Hydro guidance to prevent winter electrical injuries by avoiding downed lines and calling 9-1-1.

✅ Stay 10 metres back from downed lines; assume they are live; call 9-1-1.

✅ Report hanging or low lines and leaning poles to emergency services.

✅ BC Hydro crews coordinate storm restoration with responders.


Hydro is reminding the public about the hazards of electricity and the importance of staying safe this winter, as utilities work on adapting to climate change impacts across Canada.

Electrical equipment is more prone to damage during the fall and winter months when high winds and heavy rain can cause trees to fall on power lines and knock down power poles, prompting some utilities to assess line-burying strategies for safety and cost. If you come across a fallen power line, assume it is dangerous, stay at least 10 metres back – the length of a school bus – and dial 9-1-1.

Every fallen power line should be treated as an emergency. Safety is a key priority for BC Hydro and if a power line does fall, crews will work with emergency responders to ensure the area around the line is safe. This includes storm restoration efforts from power line technicians, wire guards, damage assessors and vegetation crews, as well as broader system upgrades like major grid investments that improve local reliability.

Such system changes can also affect delivery rates for some customers over time.

BC Hydro is also reminding British Columbians to use caution, stay 10 metres back and dial 9-1-1, if they come across:

  • a hanging power line,
  • a tree that has fallen on an electrical line,
  • a power pole with a broken crossarm,
  • a low-hanging power line close to the ground, or
  • a power pole leaning more than two metres.

Electrical equipment can be dangerous and people are injured or killed by electricity every year, including incidents tied to copper theft dangers in some regions. For more information on electrical safety, visit bchydro.com/besafe.

Source BC Hydro Media Releations


Related News

Related News

Illinois electric utility publishes online map of potential solar capacity

ComEd Hosting Capacity Map helps Illinois communities assess photovoltaic capacity, distributed energy resources, interconnection limits, and grid planning needs, guiding developers and policymakers on siting solar, net metering feasibility, and RPS-aligned deployment by circuit.


Key Points

An online tool showing circuit-level DER capacity, PV limits, and interconnection readiness across ComEd.

✅ Circuit-level estimates of solar hosting capacity

✅ Guides siting, interconnection, and net metering

✅ Supports RPS goals with grid planning insights


As the Illinois solar market grows from the Future Energy Jobs Act, the largest utility in the state has posted a planning tool to identify potential PV capacity in their service territory. ComEd, a Northern Illinois subsidiary of Exelon, has a hosting capacity website for its communities indicating how much photovoltaic capacity can be sited in given areas, based on the existing electrical infrastructure, as utilities pilot virtual power plant programs that leverage distributed resources.

According to ComEd’s description, “Hosting Capacity is an estimate of the amount of DER [distributed energy resources] that may be accommodated under current configurations at the overall circuit level without significant system upgrades to address adverse impacts to power quality or reliability.” This website will enable developers and local decision makers to estimate how much solar could be installed by township, sections and fractions of sections as small as ½ mile by ½ mile and to gauge EV charging impacts with NREL's projection tool for distribution planning. The map sections indicate potential capacity by AC kilowatts with a link to to ComEd’s recently upgraded Interconnection and Net Metering homepage.

The Hosting Map can provide insight into how much solar can be installed in which locations in order to help solar reach a significant portion of the Illinois Renewable Portfolio Standard (RPS) of 25% electricity from renewable sources by 2025, and to plan for transportation electrification as EV charging infrastructure scales across utility territories. For example, the 18 sections of Oak Park Township capacity range from 612 to 909 kW, and total 13,260 kW of photovoltaic power. That could potentially generate around 20 million kWh, and policy actions such as the CPUC-approved PG&E EV program illustrate how electrification initiatives may influence future demand. Oak Park, according to the PlanItGreen Report Card, a joint project of the Oak Park River Forest Community Foundation and Seven Generations Ahead, uses about 325 million kWh.

Based on ComEd’s Hosting Capacity, Oak Park could generate about 6% of its electricity from solar power located within its borders. Going significantly beyond this amount would likely require a combination of upgrades by ComEd’s infrastructure, potentially higher interconnection costs and deployment of technologies like energy storage solutions. What this does indicate is that a densely populated community like Oak Park would most likely have to get the majority of its solar and renewable electricity from outside its boundaries to reach the statewide RPS goal of 25%. The Hosting Capacity Map shows a considerable disparity among communities in ½ mile by ½ mile sections with some able to host only 100-200 kWs to some with capacities of over 3,000 kW.


Related News

View more

Electric Utilities Plot Bullish Course for EV Charging Infrastructure

EV Charging Infrastructure Incentives are expanding as utilities fund public chargers, Level 2 networks, DC fast charging, grid-managed off-peak programs, and equitable access across Ohio, New Jersey, and Florida to accelerate clean transportation.


Key Points

Utility-backed programs funding Level 2 and DC fast chargers, managing grid demand, and expanding EV equity.

✅ Incentives for Level 2 and DC fast public charging stations.

✅ Grid-friendly off-peak charging to balance demand.

✅ Equity targets place chargers in low-income communities.


Electric providers in Florida, Ohio and New Jersey recently announced plans to expand electric vehicle charging networks and infrastructure through various incentive programs that could add thousands of new public chargers in the next several years.

Elsewhere, utilities are advancing similar efforts, with Michigan EV programs proposing more than $20 million for charging infrastructure to accelerate adoption.

American Electric Power in Ohio will offer nearly $10 million in incentives toward the build out of 375 EV charging stations throughout the company's service territory, which largely includes Columbus.

Meanwhile, the Public Service Electric and Gas Company (PSE&G), an electric utility provider in New Jersey, has proposed a six-year plan to support the development of nearly 40,000 electric vehicle chargers across a wide range of customers and sectors, said Francis Sullivan, a spokesperson for PSE&G.

And Duke Energy in Florida is installing up to 530 EV charging stations across its service area, as part of its Park and Plug pilot program, which will be making the charging ports available in multifamily housing complexes, workplaces and other high traffic areas.

"We are bringing cleaner energy to Florida through 700 megawatts of new universal solar, and we are helping our customers to bring clean transportation to the state as well," Catherine Stempien, Duke Energy Florida president, said in a statement. "We are committed to providing smarter, cleaner energy alternatives for all our customers."

The project in Ohio is making incentive funding available to government organizations, multifamily housing developments and workplaces, covering from 50 percent to all of the costs. The plan, to be rolled out in the next four years, aims to incentivize the development of 300 level-two chargers and 75 "fast chargers" capable of charging a car's battery in minutes rather than hours.

"I think what's interesting about what we're seeing now in the industry is that electric vehicles and electric vehicle charging are expanding beyond California, and like other Pacific Coast states," said Scott Fisher, vice president of marketing at Greenlots, maker of car chargers and software. Greenlots has been selected as one of the companies to provide the chargers for the AEP project.

California has occupied the lion's share of the electric vehicle market, making up about 5 percent of the cars on the state's highways. The U.S. market sits at about 1.5 percent. However, indications show the EV boom may be set to take off as more models are being rolled out, and prices are making the electric cars more competitive with their gas-powered counterparts. The group Securing America's Future Energy (SAFE) announced the one-millionth electric vehicle is on course to be sold in the United States this month.

In a statement, Ben Prochazka, vice president of the Electrification Coalition, an EV advocacy group, called this "a major milestone and brings us one step closer to reducing our transportation system's dependence on oil. This is a direct result of the tireless efforts by communities and advocates throughout the 'EV ecosystem.'"

In New Jersey, PSE&G's efforts -- which are part of the company's proposed Clean Energy Future program -- will not only focus on building out the charging infrastructure, but structure car recharging to control charging and encourage residents to charge their cars during off-peak times.

"For now, with a modest number of charging stations in the market, it's not a huge problem. But over time, as you're putting in many thousands of these stations, what you want to make sure is that those stations are operating in sync with state power grids, where you don't have people all charging at the same time at like 5 p.m. on a hot summer day," said Fisher.

PSE&G also plans to offer incentives to encourage the development of level-two chargers and DC fast-chargers, as well as "provide grants and incentives for 100 electric school buses and EV charging infrastructure at school districts in PSE&G's service territory," said Sullivan.

"PSE&G will also help fund electrification projects at customer locations such as ports, airports and transit facilities," Sullivan added, via email.

Utilities and transportation planners are also keeping the concept of equity in mind -- to ensure EVs are adopted by more than just the Tesla owner -- and will also focus on placing infrastructure in low-income areas.

"Ten percent of the stations will be in low income areas, defined by census blocks," said Scott Blake, a communications consultant at AEP in Columbus.

Duke Energy also announced 10 percent of the chargers it is installing in Florida will be in "income-qualified communities," according to a company press release.


Related News

View more

Americans Keep Using Less and Less Electricity

U.S. Electricity Demand Decoupling signals GDP growth without higher load, driven by energy efficiency, LED adoption, services-led output, and rising renewables integration with the grid, plus EV charging and battery storage supporting decarbonization.


Key Points

GDP grows as electricity use stays flat, driven by efficiency, renewables, and a shift toward services and output.

✅ LEDs and codes cut residential and commercial load intensity.

✅ Wind, solar, and gas gain share as coal and nuclear struggle.

✅ EVs and storage can grow load and enable grid decarbonization.


By Justin Fox

Economic growth picked up a little in the U.S. in 2017. But electricity use fell, with electricity sales projections continuing to decline, according to data released recently by the Energy Information Administration. It's now been basically flat for more than a decade:


Measured on a per-capita basis, electricity use is in clear decline, and is already back to the levels of the mid-1990s.


Sources: U.S. Energy Information Administration, U.S. Bureau of Economic Analysis

*Includes small-scale solar generation from 2014 onward


I constructed these charts to go all the way back to 1949 in part because I can (that's how far back the EIA data series goes) but also because it makes clear what a momentous change this is. Electricity use rose and rose and rose and then ... it didn't anymore.

Slower economic growth since 2007 has been part of the reason, but the 2017 numbers make clear that higher gross domestic product no longer necessarily requires more electricity, although the Iron Law of Climate is often cited to suggest rising energy use with economic growth. I wrote a column last year about this big shift, and there's not a whole lot new to say about what's causing it: mainly increased energy efficiency (driven to a remarkable extent by the rise of LED light bulbs), and the continuing migration of economic activity away from making tangible things and toward providing services and virtual products such as games and binge-watchable TV series (that are themselves consumed on ever-more-energy-efficient electronic devices).

What's worth going over, though, is what this means for those in the business of generating electricity. The Donald Trump administration has made saving coal-fired electric plants a big priority; the struggles of nuclear power plants have sparked concern from multiple quarters. Meanwhile, U.S. natural gas production has grown by more than 40 percent since 2007, thanks to hydraulic fracturing and other new drilling techniques, while wind and solar generation keep making big gains in cost and market share. And this is all happening within the context of a no-growth electricity market.

In China, a mystery in China's electricity data has complicated global comparisons.


Here are the five main sources of electric power in the U.S.:


The big story over the past decade has been coal and natural gas trading places as the top fuel for electricity generation. Over the past year and a half coal regained some of that lost ground as natural gas prices rose from the lows of early 2016. But with overall electricity use flat and production from wind and solar on the rise, that hasn't translated into big increases in coal generation overall.

Oh, and about solar. It's only a major factor in a few states (California especially), so it doesn't make the top five. But it's definitely on the rise.


What happens next? For power generators, the best bet for breaking out of the current no-growth pattern is to electrify more of the U.S. economy, especially transportation. A big part of the attraction of electric cars and trucks for policy-makers and others is their potential to be emissions-free. But they're only really emissions-free if the electricity used to charge them is generated in an emissions-free manner -- creating a pretty strong business case for continuing "decarbonization" of the electric industry. It's conceivable that electric car batteries could even assist in that decarbonization by storing the intermittent power generated by wind and solar and delivering it back onto the grid when needed.

I don't know exactly how all this will play out. Nobody does. But the business of generating electricity isn't going back to its pre-2008 normal. 


Related News

View more

California just made more clean energy than it needed

CAISO Net Negative Emissions signal moments when greenhouse gas intensity of serving ISO demand drops below zero, driven by high renewable generation, low load, strong solar exports, and imports accounting in the California grid.


Key Points

Moments when CAISO's CO2 to serve demand is below zero, driven by renewables, exports, and import accounting.

✅ Calculated using imports and exports to serve ISO demand

✅ Occur during high solar output, low weekend load

✅ Coincide with curtailment and record renewable penetration


We’re a long way from the land of milk and honey, but on Easter Sunday – for about an hour – we got a taste.

On Sunday, at 1:55 PM Pacific Time the California Independent Systems Operator (CAISO) reported that greenhouse gas emissions necessary to serve its demand (~80% of California’s electricity demand on an annual basis), was measured at a rate -16 metric tons of CO2 per hour. Five minutes later, the value was -2 mTCO2/h, before it crept back up to 40 mTCO2/h at 2:05 PM PST. At 2:10 PST though it fell back to -86 mTCO2/h and stayed negative until 3:05 PM PST, even as global CO2 emissions flatlined in 2019 according to the IEA.

This information was brought to the attention of pv magazine via tweet from eagle eye Jon Pa after CAISO’s site first noted the negative values:

The region was still generating CO2 though, as natural gas, biogas, biomass, geothermal and even coal plants were running and pumping out emissions, even as potent greenhouse gases declined in the US under control efforts. CAISO’s Greenhouse Gas Emission Tracking Methodology, December 28, 2016 (pdf) notes the below calculations to create the value what it terms, “Total GHG emissions to serve ISO demand”:

Of importance to note is that to get to the net negative value, CAISO considered all electricity imports and exports, a reminder that climate policy shapes grid operations across North America. And as can be noted in the image below the CO2 intensity of imports during the day rapidly declined as the sun came up, first going negative around 9:05 AM PST, and mostly staying so until just before 6 PM PST.

During this same weekend, other records were noted (reiterating that we’re in record setting season and as the state pursues its 100% carbon-free mandate now in law) such as a new electricity export record of greater than 2 GW and total renewable electricity as part of total demand at greater than 70%.

At the peak negative moment of 2:15 PM PST, -112 mTCO2/h seen below, the total amount of clean instantaneous generation being used in the power grid region was 17 GW, a far cry from heat-driven reliability strains like rolling blackout warnings that arise during extreme demand, with renewables giving 76% of the total, hydro 14%, nuclear 13% and imports of -12% countering the CO2 coming from just over 1.4 GW of gas generation.

Also of importance are a few layers of nuance in the electricity demand charts. First off we’re in the shoulder seasons  of California – nice cool weather before the warmth of summer drives air conditioning demand. Additional the weekend electricity demand is always lower, as well, Easter Sunday might have had an affect, whereas in colder regions Calgary’s electricity use can soar during frigid snaps.

Lastly to note was the amount of electricity from solar and wind generation being curtailed. And while the Sunday numbers weren’t available yet, the below image noted Saturday with 10 GWh in total being curtailed (pdf) – peaking at over 3.2 GW of instantaneous mostly solar power even as solar is now the cheapest electricity according to the IEA, in the hours of 2 and 3 PM PST. On an annualized basis, less than 2% of total potential solar electricity was curtailed in 2018.


Related News

View more

Power Outage Affects 13,000 in North Seattle

North Seattle Power Outage disrupts 13,000 in Ballard, Northgate, and Lake City as Seattle City Light crews repair equipment failures. Aging infrastructure, smart grid upgrades, microgrids, and emergency preparedness highlight resilience and reliability challenges.


Key Points

A major outage affecting 13,000 in North Seattle from equipment failures and aging grid, prompting repairs and planning.

✅ 13,000 customers in Ballard, Northgate, Lake City affected

✅ Cause: equipment failures and aging infrastructure

✅ Crews, smart grid upgrades, and preparedness improve resilience


On a recent Wednesday morning, a significant power outage struck a large area of North Seattle, affecting approximately 13,000 residents and businesses. This incident not only disrupted daily routines, as seen in a recent London outage, but also raised questions about infrastructure reliability and emergency preparedness in urban settings.

Overview of the Outage

The outage began around 9 a.m., with initial reports indicating that neighborhoods including Ballard, Northgate, and parts of Lake City were impacted. Utility company Seattle City Light quickly dispatched crews to identify the cause of the outage and restore power as soon as possible. By noon, the utility reported that repairs were underway, with crews working diligently to restore service to those affected.

Such outages can occur for various reasons, including severe weather, such as windstorm-related failures, equipment failure, or accidents involving utility poles. In this instance, the utility confirmed that a series of equipment failures contributed to the widespread disruption. The situation was exacerbated by the age of some infrastructure in the area, highlighting ongoing concerns about the need for modernization and upgrades.

Community Impact

The power outage caused significant disruptions for residents and local businesses. Many households faced challenges as their morning routines were interrupted—everything from preparing breakfast to working from home became more complicated without electricity. Schools in the affected areas also faced challenges, as some had to adjust their schedules and operations.

Local businesses, particularly those dependent on refrigeration and electronic payment systems, felt the immediate impact. Restaurants struggled to serve customers without power, while grocery stores dealt with potential food spoilage, leading to concerns about lost inventory and revenue. The outage underscored the vulnerability of businesses to infrastructure failures, as recent Toronto outages have shown, prompting discussions about contingency plans and backup systems.

Emergency Response

Seattle City Light’s swift response was crucial in minimizing the outage's impact. Utility crews worked through the day to restore power, and the company provided regular updates to the community, keeping residents informed about progress and estimated restoration times. This transparent communication was essential in alleviating some of the frustration among those affected, and contrasts with extended outages in Houston that heightened public concern.

Furthermore, the outage served as a reminder of the importance of emergency preparedness for both individuals and local governments, and of utility disaster planning that supports resilience. Many residents were left unprepared for an extended outage, prompting discussions about personal emergency kits, alternative power sources, and community resources available during such incidents. Local officials encouraged residents to stay informed about power outages and to have a plan in place for emergencies.

Broader Implications for Infrastructure

This incident highlights the broader challenges facing urban infrastructure. Many cities, including Seattle, are grappling with aging power grids that struggle to keep up with modern demands, and power failures can disrupt transit systems like the London Underground during peak hours. Experts suggest that regular assessments and updates to infrastructure are critical to ensuring reliability and resilience against both natural and human-made disruptions.

In response to increasing frequency and severity of power outages, including widespread windstorm outages in Quebec, there is a growing call for investment in modern technologies and infrastructure. Smart grid technology, for instance, can enhance monitoring and maintenance, allowing utilities to respond more effectively to outages. Additionally, renewable energy sources and microgrid systems could offer more resilience and reduce reliance on centralized power sources.

The recent power outage in North Seattle was a significant event that affected thousands of residents and businesses. While the immediate response by Seattle City Light was commendable, the incident raised important questions about infrastructure reliability and emergency preparedness. As cities continue to grow and evolve, the need for modernized power systems and improved contingency planning will be crucial to ensuring that communities can withstand future disruptions.

As residents reflect on this experience, it serves as a reminder of the interconnectedness of urban living and the critical importance of reliable infrastructure in maintaining daily life. With proactive measures, cities can work towards minimizing the impact of such outages and building a more resilient future for their communities.


Related News

View more

Maine Governor calls for 100% renewable electricity

Maine Climate Council Act targets 80% renewable power by 2030 and 100% by 2050, slashing greenhouse gas emissions via clean electricity, grid procurement, long-term contracts, wind and hydro integration, resilience planning, and carbon sequestration.


Key Points

A Maine policy forming a Climate Council to reach 80% renewables in 2030 100% in 2050 and cut greenhouse gas emissions.

✅ 80% renewable electricity by 2030; 100% by 2050.

✅ 45% GHG cut by 2030; 80% by 2050.

✅ Utility procurement authority for clean capacity and energy.


The winds of change have shifted and are blowing Northward, as Maine’s Governor, Janet T. Mills, has put forth an act establishing a Climate Council to guide the state’s consumption to 80% renewable electricity in 2030 and 100% by 2050, echoing New York's Green New Deal ambitions underway.

The act, LR 2478 (pdf), also sets a goal of reducing greenhouse gas emissions by 45% in 2030 and 80% by 2050. The document will be submitted to the state Legislature for consideration.

The commission would have the authority to direct investor owned transmission and distribution utilities to run competitive procurement processes, and enter into long-term contracts for capacity resources, energy resources, renewable energy credit contracts, and participate in regional programs, as these all lead toward the clean electricity and emissions-reducing goals that mirror California's 100% mandate debates today.

The Climate Council would convene industry working groups, including Scientific and Technical, Transportation, Coastal and Marine, Energy, and Building & Infrastructure working groups, plus others as needed, where examples like New Zealand's electricity transition could inform discussions.

Membership within the council would include two members of the State Senate, two members of the House, a tribal representative, many department commissioners (Education, Defense, Transportation, etc.), multiple directors, business representatives, environmental non-profit members, and climate science and resilience representatives as well.

The council would update the Maine State Climate Plan every four years, and solicit input from the public and report out progress on its goals every two years, similar to planning underway in Minnesota's carbon-free plan framework. The first Climate Action Plan would be submitted to the legislature by December 1, 2020.

Specifically, the responsibilities of the Scientific and Technical Subcommittee were laid out. The group would be scheduled to meet at least every six months, beginning no later than October 1, 2019. The group would be tasked with reviewing existing scientific literature, including net-zero electricity pathways research, to use it as guidance, recognizing gaps in the state’s knowledge, and guiding outside experts to ascertain this knowledge.  The group would consider ocean acidification, and climate change effects on the state’s species; establish science-based sea-level rise projections for the state’s coastal regions by December 1, 2020; create a climate risk map for flooding and extreme weather events; and consider carbon sequestration via biomass growth.

The state’s largest power plants (above image), generate about 31% from gas, 28% from wood and 41% from hydro+wind. Already, the state has a very clean electricity profile, much like efforts to decarbonize Canada's power sector continue apace. Below, the U.S. Energy Information Administration (EIA) notes that 51% of electricity generation within the state comes from mostly wind+hydro, with a small touch from solar power. The state also gets 24% from wood and other biomass, which would lead some to argue that the state is already at 75% “renewable electricity”. The Governor’s document does reference wind power specifically as a renewable, however, no other specific electricity source. And there is much reference to forestry, agriculture, and logging – specifically noting carbon sequestration – but nothing regarding electricity.

The state’s final 25% of electricity mostly comes from natural gas, even as renewable electricity momentum builds across North America, with this author choosing to put “other” under the fossil percentage noted above.


Related News

View more

Sign Up for Electricity Forum’s Newsletter

Stay informed with our FREE Newsletter — get the latest news, breakthrough technologies, and expert insights, delivered straight to your inbox.

Electricity Today T&D Magazine Subscribe for FREE

Stay informed with the latest T&D policies and technologies.
  • Timely insights from industry experts
  • Practical solutions T&D engineers
  • Free access to every issue

Download the 2025 Electrical Training Catalog

Explore 50+ live, expert-led electrical training courses –

  • Interactive
  • Flexible
  • CEU-cerified