WAPA to raise rates

By Associated Press


Substation Relay Protection Training

Our customized live online or in‑person group training can be delivered to your staff at your location.

  • Live Online
  • 12 hours Instructor-led
  • Group Training Available
Regular Price:
$699
Coupon Price:
$599
Reserve Your Seat Today
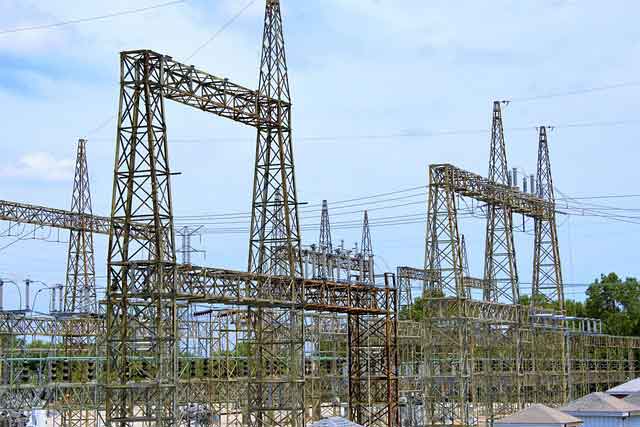
Municipal power companies, electric co-ops and eventually customers will see much higher costs in the future from the Western Area Power Administration.

WAPA delivers power mostly from hydroelectric dams in the region.

Agency spokesman Randy Wilkerson says WAPA will increase rates by nearly 23 percent on Jan. 1.

He attributes the increase to several years of drought, which resulted in reduced power production from Missouri River dams and forced WAPA to buy more expensive power elsewhere. While the drought has eased, moisture in the region has not been excessive.

"Even though we seem to have had a little bit of recovery this past year, those reservoirs aren't full yet," Wilkerson said. "And when the reservoirs aren't full, that reduces the generation, so we've got less electricity to provide, and when that happens we've got to go out on the open market and purchase that power to make up what we've contracted with."

WAPA has raised rates by nearly 18 percent in the past two years.

"Our rates, by legislation, are cost-based, and so ultimately the consumers end up paying for that down the road," Wilkerson said.

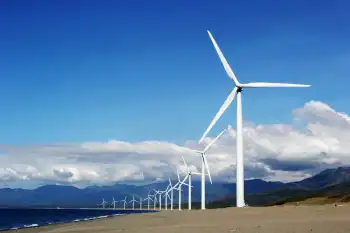
WAPA has begun a regional environmental impact study on wind power, he said. The agency hopes wind-generated electricity can provide a portion of its power in the future, Wilkerson said.

"When hydropower is short, maybe it could be supplemented with wind," he said.

Related News

Congressional Democrats push FERC to act on aggregated DERs

FERC DER Aggregation advances debates over distributed energy resources as Congress presses action on Order 841, grid resilience, and wholesale market access, including rooftop solar, storage, and virtual power plant participation across PJM and ISO-NE.


Key Points

FERC DER Aggregation enables grouped distributed resources to join wholesale markets, providing capacity and flexibility.

? Opens wholesale market access for aggregated DER portfolios

? Aligns with Order 841, storage, and grid resilience goals

? Raises jurisdictional questions between FERC and state regulators


The Monday letter from Congressional Democrats illustrates growing frustration in Washington over the lack of FERC action on multiple power sector issues, including the aging U.S. grid and related challenges.

Last May, after the FERC technical conference, 16 Democratic Senators wrote to then-Chairman Kevin McIntyre urging him to develop guidance for grid operators on aggregated DERs.

In July, McIntyre responded, saying that FERC was "diligently reviewing the record," but the commission has taken no action since.

Since then, "DER adoption and renewable energy aggregation have continued to grow," House and Senate lawmakers wrote in their identical Monday letters, "driven not only by state and federal policies, but consumer interest in choosing cost-competitive technologies such as rooftop solar, smart thermostats and customer-sited energy generation and storage, reflecting key utility trends in the sector."

The lawmakers wrote they were "encouraged" by FERC Chairman Neil Chatterjee's comments in June 2018, writing that he "specifically cited the role DERs will play in our continued grid transition."

In that speech at the S&P Global Platts 2018 Transmission Planning and Development Conference, Chatterjee noted "growing interest" in non-transmission alternatives, including "DERs and storage."

"How the Commission treats filings associated with those first-of-kind projects could prove an important factor in investors’ assessments of whether similar non-traditional projects are bankable or not — and more broadly signal whether FERC is open to innovation in the transmission sector,” he said.

In addition to the DER order and rehearing decision on Order 841, FERC has multiple other power sector initiatives that have not seen official action in months, even as major changes to electricity pricing are debated by stakeholders.

The highest profile is its open proceeding on grid resilience, set up last January after FERC rejected a coal and nuclear bailout proposal from the Department of Energy. In October, the CEO of the PJM Interconnection, the nation’s largest wholesale power market, urged FERC to issue a final order in the docket, calling for "leadership" from the commission.

Chatterjee, however, has not indicated when FERC could decide on the case. In December, Commissioner Rich Glick told a Washington audience he is "not entirely sure where the chairman wants to go with that proceeding yet."

Outside of resilience, FERC also has open reviews of both its pipeline certificate policy and implementation of the Public Utilities Regulatory Policy Act, a key law supporting renewable energy. McIntrye set those reviews in motion during his tenure as chairman, but after his death in January the timing of both remains unclear.

In recent months, Chatterjee has also delayed FERC votes on major export facilities for liquefied natural gas and a political spending case involving PJM after impasses between Republicans and Democrats on FERC.

Two members from each party currently sit on the commission. That allows Democrats to deadlock commission votes on natural gas facilities and other issues — a partisan divide on display this week when they clashed with the chairman over offshore wind.

As the commission considers final guidance on DERs, the boundaries of federal jurisdiction are likely to be a key issue. At the technical conference, states from the Midcontinent ISO argued FERC should allow them to choose whether to let aggregated DERs participate in retail and wholesale markets. Other states argued the value proposition of distributed resources may rely on that sort of dual participation.

Despite the lack of action from FERC, some grid operators are moving forward with aggregated distributed resources in New England market reform efforts and elsewhere, demonstrating momentum. Last week, a residential solar-plus-storage aggregation cleared the ISO-NE capacity auction for the first time, committing to provide 20 MW of capacity beginning in 2022.

On the Senate side, Sens. Sheldon Whitehouse, R.I., and Ed Markey, Mass., led the letter to FERC. In the House, Reps. Peter Welch, Vt., and Mike Levin, Calif., led the signatories.


Related News

View more

Strong Winds Knock Out Power Across Miami Valley

Miami Valley Windstorm Power Outages disrupted thousands as 60 mph gusts toppled trees, downed power lines, and damaged buildings. Utility crews and emergency services managed debris, while NWS alerts warned of extended restoration.


Key Points

Region-wide power losses from severe winds in the Miami Valley, causing damage, debris, and restoration.

✅ 60 mph gusts downed trees, snapped lines, blocked roads

✅ Crews from DP&L worked extended shifts to restore service

✅ NWS issued wind advisories; schools, businesses closed


On a recent day, powerful winds tore through the Miami Valley, causing significant disruption across the region. The storm, which was accompanied by gusts reaching dangerous speeds, led to windstorm power outages affecting thousands of homes and businesses. As trees fell and power lines were snapped, many residents found themselves without electricity for hours, and in some cases, even days.

The high winds, which were part of a larger weather system moving through the area, left a trail of destruction in their wake. In addition to power outages, there were reports of storm damage to buildings, vehicles, and other structures. The force of the wind uprooted trees, some of which fell on homes and vehicles, causing significant property damage. While the storm did not result in any fatalities, the destruction was widespread, with many communities experiencing debris-filled streets and blocked roads.

Utility companies in the Miami Valley, including Dayton Power & Light, quickly mobilized crews, similar to FPL's storm response in major events, to begin restoring power to the affected areas. However, the high winds presented a challenge for repair crews, as downed power lines and damaged equipment made restoration efforts more difficult. Many customers were left waiting for hours or even days for their power to be restored, and some neighborhoods were still experiencing outages several days after the storm had passed.

In response to the severe weather, local authorities issued warnings to residents, urging them to stay indoors and avoid unnecessary travel. Wind gusts of up to 60 miles per hour were reported, making driving hazardous, particularly on bridges and overpasses, similar to Quebec windstorm outages elsewhere. The National Weather Service also warned of the potential for further storm activity, advising people to remain vigilant as the system moved eastward.

The impact of the storm was felt not only in terms of power outages but also in the strain it placed on emergency services. With trees blocking roads and debris scattered across the area, first responders were required to work quickly and efficiently to clear paths and assist those in need. Many residents were left without heat, refrigeration, and in some cases, access to medical equipment that relied on electricity.

Local schools and businesses were also affected by the storm. Many schools had to cancel classes, either due to power outages or because roads were impassable. Businesses, particularly those in the retail and service sectors, faced disruptions in their operations as they struggled to stay open without power amid extended outages that lingered, or to address damage caused by fallen trees and debris.

In the aftermath of the storm, Miami Valley residents are working to clean up and assess the damage. Many homeowners are left dealing with the aftermath of tree removal, property repairs, and other challenges. Meanwhile, local governments are focusing on restoring infrastructure, as seen after Toronto's spring storm outages in recent years, and ensuring that the power grid is secured to prevent further outages.

While the winds have died down and conditions have improved, the storm’s impact will be felt for weeks to come, reflecting Florida's weeks-long restorations after severe storms. The region will continue to recover from the damage, but the event serves as a reminder of the power of nature and the resilience of communities in the face of adversity. For residents affected by the power outages, recovery will require patience as utility crews and local authorities work tirelessly to restore normalcy.

Looking ahead, experts are urging residents to prepare for the next storm season by ensuring that they have emergency kits, backup generators, and contingency plans in place. As climate change contributes to more extreme weather events, it is likely that storms of this magnitude will become more frequent. By taking steps to prepare in advance, communities across the Miami Valley can better handle whatever challenges come next.


Related News

View more

Tunisia moves ahead with smart electricity grid

Tunisia Smart Grid Project advances with an AFD loan as STEG deploys smart meters in Sfax, upgrades grid infrastructure, boosts energy efficiency, curbs losses, and integrates renewable energy through digitalization and advanced communication systems.


Key Points

A national program funded by an AFD $131.7M loan to modernize STEG, deploy smart meters, and integrate renewable energy.

✅ 430,000 smart meters in Sfax during phase one

✅ 20-year AFD loan with 7-year grace period

✅ Cuts losses, improves efficiency, enables renewables


The Tunisian parliament has approved taking a $131.7 million loan from the French Development Agency for the implementation of a smart grid project.

Parliament passed legislation regarding the 400 million dinar ($131.7 million) loan plus a grant of $1.1 million.

The loan, to be repaid over 20 years with a grace period of up to 7 years, is part of the Tunisian government’s efforts to establish a strategy of energy switching aimed at reducing costs and enhancing operational efficiency.

The move to the smart grid had been postponed after the Tunisian Company of Electricity and Gas (STEG) announced in March 2017 that implementation of the first phase of the project would begin in early 2018 and cover the entire country by 2023.

STEG was to have received funding some time ago. Last year at the Africa Smart Grid Summit in Tunis, the company said it would initiate an international tender during the first quarter of 2019 to start the project.

The French funding is to be allocated to implementation of the first phase only, which will involve development of control and communication stations and the improvement of infrastructure, where regulatory outcomes such as the Hydro One T&D rates decision can influence investment planning in comparable markets.

It includes installation of 430,000 “intelligent” metres over three years in Sfax governorate in southern Tunisia. The second phase of the project is planned to extend the programme to the rest of the country.

Smart metres to be installed in homes and businesses in Sfax account for about 10% of the total number of metres to be deployed in Tunisia.

At the beginning of 2017, the Industrial Company of Metallic Articles (SIAM), a Tunisian industrial electrical equipment and machinery company, signed an agreement with Huawei for the Chinese company to supply smart electricity metres. The value of the deal was not disclosed.

The smart grid is designed to reduce power waste, reduce the number of unpaid bills, prevent consumer fraud such as power theft in India across distribution networks, improve the ecosystem and increase competitiveness in the electricity sector.

Experts said the main difference between the traditional and smart grids is the adoption of advanced infrastructure for measuring electricity consumption and for communication between the power plant and consumers. The data exchange allows power plants to coordinate electricity production with actual demand.

STEG previously indicated that it had implemented measures to ensure the transition to the smart grid, especially since digitalisation is playing an important role in the energy sector.

The project, which translates Tunisia’s energy plans in the form of a partnership between the public and private sectors, aims at reaching 30% of the country’s electricity need from renewable sources by 2025, even as entities like the TVA face climate goals scrutiny that can affect electricity rates in other markets.

The development of the smart grid will allow STEG to monitor consumption patterns, detect abuses and remotely monitor the grid’s power supply, at a time when regulators have questioned UK network profits to spur efficiency, underscoring the value of transparency.

“The smart grid will change the face of the energy system towards the use of renewable energies,” said Tunisian Industry Minister Slim Feriani. At the forum on alternative energies, he pointed out that energy sector digitisation requires investments in technology and a change in the consumption mentality, as new entrants consider roles like Tesla electricity retailer plans in advanced markets.

Official data indicate that Tunisia’s energy deficit accounts for one-third of the country’s annual trade deficit, which reached record levels of more than $6 billion last year.

STEG, whose debts have reached $329 million over the past eight years, a situation resembling Manitoba Hydro debt pressures in Canada, has not disclosed when and how funding would be secured for the completion of the second phase. The company insists it is working to prevent further losses and to collect its unpaid bills.

STEG CEO Moncef Harrabi, earlier this year, said: “The current situation of the company has forced us to take immediate action to reduce the worsening of the crisis and stop the financial bleeding caused by losses.”

He said the company had repeatedly asked the government to pay subsidy instalments due to the company and to enact binding decisions to force government institutions and departments to pay electricity bills, while elsewhere measures like Thailand power bill cuts have been used to support consumers.

The Tunisian government has yet to disburse the subsidy instalments due STEG for 2018 and 2019, which amount to $658 million. STEG also imports natural gas from Algeria for its power plants at a cost of $1.1 billion a year.


Related News

View more

Climate change: Greenhouse gas concentrations again break records

Rising Greenhouse Gas Concentrations drive climate change, with CO2, methane, and nitrous oxide surging; WMO data show higher radiative forcing, elevated pre-industrial baselines, and persistent atmospheric concentrations despite Paris Agreement emissions pledges.


Key Points

Increasing atmospheric CO2, methane, and nitrous oxide levels that raise radiative forcing and drive warming.

✅ WMO data show CO2 at 407.8 ppm in 2018, above decade average

✅ Methane and nitrous oxide surged, elevating total radiative forcing

✅ Concentrations differ from emissions; sinks absorb about half


The World Meteorological Organization (WMO) says the increase in CO2 was just above the average rise recorded over the last decade.

Levels of other warming gases, such as methane and nitrous oxide, have also surged by above average amounts.

Since 1990 there's been an increase of 43% in the warming effect on the climate of long lived greenhouse gases.

The WMO report looks at concentrations of warming gases in the atmosphere rather than just emissions.

The difference between the two is that emissions refer to the amount of gases that go up into the atmosphere from the use of fossil fuels, such as burning coal for coal-fired electricity generation and from deforestation.

Concentrations are what's left in the air after a complex series of interactions between the atmosphere, the oceans, the forests and the land. About a quarter of all carbon emissions are absorbed by the seas, and a similar amount by land and trees, while technologies like carbon capture are being explored to remove CO2.

Using data from monitoring stations in the Arctic and all over the world, researchers say that in 2018 concentrations of CO2 reached 407.8 parts per million (ppm), up from 405.5ppm a year previously.

This increase was above the average for the last 10 years and is 147% of the "pre-industrial" level in 1750.

The WMO also records concentrations of other warming gases, including methane and nitrous oxide, and some countries have reported declines in certain potent gases, as noted in US greenhouse gas controls reports, though global levels remain elevated. About 40% of the methane emitted into the air comes from natural sources, such as wetlands, with 60% from human activities, including cattle farming, rice cultivation and landfill dumps.

Methane is now at 259% of the pre-industrial level and the increase seen over the past year was higher than both the previous annual rate and the average over the past 10 years.

Nitrous oxide is emitted from natural and human sources, including from the oceans and from fertiliser-use in farming. According to the WMO, it is now at 123% of the levels that existed in 1750.

Last year's increase in concentrations of the gas, which can also harm the ozone layer, was bigger than the previous 12 months and higher than the average of the past decade.

What concerns scientists is the overall warming impact of all these increasing concentrations. Known as total radiative forcing, this effect has increased by 43% since 1990, and is not showing any indication of stopping.

There is no sign of a slowdown, let alone a decline, in greenhouse gases concentration in the atmosphere despite all the commitments under the Paris agreement on climate change and the ongoing global energy transition efforts," said WMO Secretary-General Petteri Taalas.

"We need to translate the commitments into action and increase the level of ambition for the sake of the future welfare of mankind," he added.

"It is worth recalling that the last time the Earth experienced a comparable concentration of CO2 was three to five million years ago. Back then, the temperature was 2-3C warmer, sea level was 10-20m higher than now," said Mr Taalas.

The UN Environment Programme will report shortly on the gap between what actions countries are taking to cut carbon, for example where Australia's emissions rose 2% recently, and what needs to be done to keep under the temperature targets agreed in the Paris climate pact.

Preliminary findings from this study, published during the UN Secretary General's special climate summit last September, indicated that emissions continued to rise during 2018, although global emissions flatlined in 2019 according to the IEA.

Both reports will help inform delegates from almost 200 countries who will meet in Madrid next week for COP25, following COP24 in Katowice the previous year, the annual round of international climate talks.


Related News

View more

Canadian nuclear projects bring economic benefits

Ontario Nuclear Refurbishment Economic Impact powers growth as Bruce Power's MCR and OPG's Darlington unit 2 refurbishment drive jobs, supply-chain spending, medical isotopes, clean baseload power, and lower GHG emissions across Ontario and Canada.


Key Points

It is the measured gains from Bruce Power's MCR and OPG's Darlington refurbishment in jobs, taxes, and clean energy.

✅ CAD7.6B-10.6B impact in Ontario; CAD8.1B-11.6B nationwide.

✅ Supports 60% nuclear supply, jobs, and medical isotopes.

✅ MCR and Darlington cut GHGs, drive innovation and supply chains.


The 13-year Major Component Replacement (MCR) project being undertaken as part of Bruce Power's life-extension programme, which officially began with a reactor taken offline earlier this year, will inject billions of dollars into Ontario's economy, a new report has found. Meanwhile, the major project to refurbish Darlington unit 2 remains on track for completion in 2020, Ontario Power Generation (OPG) has announced.

The Ontario Chamber of Commerce (OCC) said its report, Major Component Replacement Project Economic Impact Analysis, outlines an impartial assessment of the MCR programme and related manufacturing contracts across the supply chain. The report was commissioned by Bruce Power.

"Our analysis shows that Bruce Power's MCR project is a fundamental contributor to the Ontario economy. More broadly, the life-extension of the Bruce Power facility will provide quality jobs for Ontarians, produce a stable supply of medical isotopes for the world's healthcare system, and deliver economic benefit through direct and indirect spending," OCC President and CEO Rocco Rossi said."As Ontario's energy demand grows, nuclear truly is the best option to meet those demands with reduced GHG [greenhouse gas] emissions. The Bruce Power MCR Project will not only drive economic growth in the region, it will position Ontario as a global leader in nuclear innovation and expertise."

According to the OCC's economic analysis, the MCR's economic impact on Ontario is estimated to be between CAD7.6 billion (USD5.6 billion) and CAD10.6 billion. Nationally, its economic impact is estimated to be between CAD8.1 billion and CAD11.6 billion. It estimates that the federal government will receive CAD144 million in excise tax and CAD1.2 billion in income tax, while the provincial government will receive CAD300 million and CAD437 million. Ontario’s municipal governments are estimated to receive a collective CAD192 million in tax.

The nuclear industry currently provides 60% of Ontario’s daily energy supply needs, with Pickering life extension plans bolstering system reliability, and is made up of over 200 companies and more than 60,000 jobs across a diversity of sectors such as operations, manufacturing, skilled trades, healthcare, and research and innovation, the report notes.

Greg Rickford, Ontario's minister of Energy, Northern Development and Mines, and minister of Indigenous Affairs, said continued use of the Bruce generating station which recently set an operating record would create jobs and advance Ontario’s nuclear industrial sector. "It is great to see projects like the MCR that help make Ontario the best place to invest, do business and find a job," he said.

The MCR is part of Bruce Power's overall life-extension programme, which started in January 2016. Bruce 6 will be the first of the six Candu units to undergo an MCR which will take 46 months to complete and give the unit a further 30-35 years of operational life. The total cost of refurbishing Bruce units 3-8 is estimated at about CAD8 billion, in addition to CAD5 billion on other activities under the life-extension programme, which is scheduled for completion by 2053.


Darlington milestones

OPG's long-term refurbishment programme at Darlington, alongside SMR plans for the site announced by the province, began with unit 2 in 2016 after years of detailed planning and preparation. Reassembly of the reactor, which was disassembled last year, is scheduled for completion this spring, and the unit 2 refurbishment project remains on track for completion in early 2020. At the same time, final preparations are under way for the start of the refurbishment of unit 3.

"We've entered a critical phase on the project," Senior Vice President of Nuclear Refurbishment Mike Allen said. "OPG and our project partners continue to work as an integrated team to meet our commitments on Unit 2 and our other three reactors at Darlington Nuclear Generating Station."

A 350-tonne generator stator manufactured by GE in Poland is currently in transit to Canada, where it will be installed in Darlington 3's turbine hall as the province also breaks ground on its first SMR this year.

The 10-year Darlington refurbishment is due to be completed in 2026, while the province plans to refurbish Pickering B to extend output beyond that date.


Related News

View more

Tracking Progress on 100% Clean Energy Targets

100% Clean Energy Targets drive renewable electricity, decarbonization, and cost savings through state policies, CCAs, RECs, and mandates, with timelines and interim goals that boost jobs, resilience, and public health across cities, counties, and utilities.


Key Points

Policies for cities and states to reach 100% clean power by set dates, using mandates, RECs, and interim goals.

✅ Define eligible clean vs renewable resources

✅ Mandate vs goal framework with enforcement

✅ Timelines with interim targets and escape clauses


“An enormous amount of authority still rests with the states for determining your energy future. So we can build these policies that will become a postcard from the future for the rest of the country,” said David Hochschild, chair of the California Energy Commission, speaking last week at a UCLA summit on state and local progress toward 100 percent clean energy.

According to a new report from the UCLA Luskin Center for Innovation, 13 states, districts and territories, as well as more than 200 cities and counties, with standout clean energy purchases by Southeast cities helping drive momentum, have committed to a 100 percent clean electricity target — and dozens of cities have already hit it.

This means that one of every three Americans, or roughly 111 million U.S. residents representing 34 percent of the population, live in a community that has committed to or has already achieved 100 percent clean electricity, including communities like Frisco, Colorado that have set ambitious targets.

“We’re going to look back on this moment as the moment when local action and state commitments began to push the entire nation toward this goal,” said J.R. DeShazo, director of the UCLA Luskin Center for Innovation.

Not all 100 percent targets are alike, however. The report notes that these targets vary based on 1) what resources are eligible, 2) how binding the 100 percent target is, and 3) how and when the target will be achieved.

These distinctions will carry a lot of weight as the policy discussion shifts from setting goals to actually meeting targets. They also have implications for communities in terms of health benefits, cost savings and employment opportunities.


100% targets come in different forms

One key attribute is whether a target is based on "renewable" or "clean" energy resources. Some 100 percent targets, like Hawaii’s and Rhode Island’s 2030 plan, are focused exclusively on renewable energy, or sources that cannot be depleted, such as wind, solar and geothermal. But most jurisdictions use the broader term “clean energy,” which can also include resources like large hydroelectric generation and nuclear power.

States also vary in their treatment of renewable energy certificates, used to track and assign ownership to renewable energy generation and use. Unbundled RECs allow for the environmental attributes of the renewable energy resource to be purchased separately from the physical electricity delivery.

The binding nature of these targets is also noteworthy. Seven states, as well as Puerto Rico and the District of Columbia, have passed 100 percent clean energy transition laws. Of the jurisdictions that have passed 100 percent legislation, all but one specifies that the target is a “mandate,” according to the report. Nevada is the only state to call the target a “goal.”

Governors in four other states have signed executive orders with 100 percent clean energy goals.

Target timelines also vary. Washington, D.C. has set the most ambitious target date, with a mandate to achieve 100 percent renewable electricity by 2032. Other states and cities have set deadline years between 2040 and 2050. All "100 percent" state laws, and some city and county policies, also include interim targets to keep clean energy deployment on track.

In addition, some locations have included some form of escape clause. For instance, Salt Lake City, which last month passed a resolution establishing a goal of powering the county with 100 percent clean electricity by 2030, included “exit strategies” in its policy in order to encourage stakeholder buy-in, said Mayor Jackie Biskupski, speaking last week at the UCLA summit.

“We don’t think they’ll get used, but they’re there,” she said.

Other locales, meanwhile, have decided to go well beyond 100 percent clean electricity. The State of California and 44 cities have set even more challenging targets to also transition their entire transportation, heating and cooling sectors to 100 percent clean energy sources, and proposals like requiring solar panels on new buildings underscore how policy can accelerate progress across sectors.

Businesses are simultaneously electing to adopt more clean and renewable energy. Six utilities across the United States have set their own 100 percent clean or carbon-free electricity targets. UCLA researchers did not include populations served by these utilities in their analysis of locations with state and city 100 percent clean commitments.


“We cannot wait”

All state and local policies that require a certain share of electricity to come from renewable energy resources have contributed to more efficient project development and financing mechanisms, which have supported continued technology cost declines and contributed to a near doubling of renewable energy generation since 2008.

Many communities are switching to clean energy in order to save money, now that the cost calculation is increasingly in favor of renewables over fossil fuels, as more jurisdictions get on the road to 100% renewables worldwide. Additional benefits include local job creation, cleaner air and electricity system resilience due to greater reliance on local energy resources.

Another major motivator is climate change. The electricity sector is responsible for 28 percent of U.S. greenhouse gas emissions, second only to transportation. Decarbonizing the grid also helps to clean up the transportation sector as more vehicles move to electricity as their fuel source.

“The now-constant threat of wildfires, droughts, severe storms and habitat loss driven by climate change signals a crisis we can no longer ignore,” said Carla Peterman, senior vice president of regulatory affairs at investor-owned utility Southern California Edison. “We cannot wait and we should not wait when there are viable solutions to pursue now.”

Prior to joining SCE on October 1, Peterman served as a member of the California Public Utilities Commission, which implements and administers renewable portfolio standard (RPS) compliance rules for California’s retail sellers of electricity. California’s target requires 60 percent of the state’s electricity to come from renewable energy resources by 2030, and all the state's electricity to come from carbon-free resources by 2045.  


How CCAs are driving renewable energy deployment

One way California communities are working to meet the state’s ambitious targets is through community-choice aggregation, especially after California's near-100% renewable milestone underscored what's possible, via which cities and counties can take control of their energy procurement decisions to suit their preferences. Investor-owned utilities no longer purchase energy for these jurisdictions, but they continue to operate the transmission and distribution grid for all electricity users.                           

A second paper released by the Luskin Center for Innovation in recent days examines how community-choice aggregators are affecting levels of renewable energy deployment in California and contributing to the state’s 100 percent target.

The paper finds that 19 CCAs have launched in California since 2010, growing to include more than 160 towns, cities and counties. Of those communities, 64 have a 100 percent renewable or clean energy policy as their default energy program.

Because of these policies, the UCLA paper finds that “CCAs have had both direct and indirect effects that have led to increases in the clean energy sold in excess of the state’s RPS.”

From 2011 to 2018, CCAs directly procured 24 terawatt-hours of RPS-eligible electricity, 11 TWh of which have been voluntary or in excess of RPS compliance, according to the paper.

The formation of CCAs has also had an indirect effect on investor-owned utilities. As customers have left investor-owned utilities to join CCAs, the utilities have been left holding contracts for more renewable energy than they need to comply with California’s clean energy targets, amid rising solar and wind curtailments that complicate procurement decisions. UCLA researchers estimate that this indirect effect of CCA formation has left IOUs holding 13 terawatt-hours in excess of RPS requirements.

The paper concludes that CCAs have helped to accelerate California’s ability to meet state renewable energy targets over the past decade. However, the future contributions of CCAs to the RPS are more uncertain as communities make new power-purchasing decisions and utilities seek to reduce their excess renewable energy contracts.

“CCAs offer a way for communities to put their desire for clean energy into action. They're growing fast in California, one of only eight states where this kind of mechanism is allowed," said UCLA's Kelly Trumbull, an author of the report. "State and federal policies could be reformed to better enable communities to meet local demand for renewable energy.”


Related News

View more

Sign Up for Electricity Forum’s Newsletter

Stay informed with our FREE Newsletter — get the latest news, breakthrough technologies, and expert insights, delivered straight to your inbox.

Electricity Today T&D Magazine Subscribe for FREE

Stay informed with the latest T&D policies and technologies.
  • Timely insights from industry experts
  • Practical solutions T&D engineers
  • Free access to every issue

Download the 2025 Electrical Training Catalog

Explore 50+ live, expert-led electrical training courses –

  • Interactive
  • Flexible
  • CEU-cerified