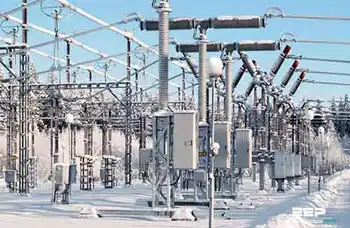
Coal ash a toxic problem for China

By United Press International


Substation Relay Protection Training

Our customized live online or in‑person group training can be delivered to your staff at your location.

  • Live Online
  • 12 hours Instructor-led
  • Group Training Available
Regular Price:
$699
Coupon Price:
$599
Reserve Your Seat Today
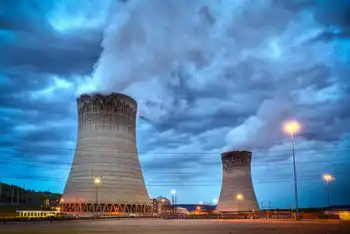
The amount of toxic coal ash dumped from China's coal-fired power plants is so massive it could fill an Olympic-sized swimming pool every two-and-a-half minutes, says a Greenpeace report.

The world's largest coal user, China relies on coal for about 70 percent of its energy supply.

That dependence means China produces at least 375 million tons of coal ash annually, which is more than 2.5 times the amount the country produced in 2002 when its coal power sector began to rapidly expand, says the report, "The True Cost of Coal: An Investigation into Coal Ash in China". Coal ash is the solid particulate matter produced when coal is burned in power stations.

"There are over 1,400 coal-fired power plants scattered across China and all of them are discharging coal ash every day," said Yang Ailun, head climate campaigner at Greenpeace China in a statement.

"This substantially erodes China's already-scarce land and water resources, while damaging public health and the environment."

Many coal-fired plants don't follow existing, albeit vague, regulations that cover the disposal of coal ash.

In its investigation of 14 power plants around the country, Greenpeace said it discovered a large number of ash disposal sites located alarmingly close to villages and residential areas.

Tests of the coal ash from those plants, conducted by Greenpeace, found that it contained more than 20 kinds of heavy metals and chemical compounds.

Also, an analysis of samples of surface and well water near disposal sites found concentrations of a number of harmful substances that exceeded acceptable standards for drinking and irrigation water.

"Many of the coal ash disposal sites we visited had poor safeguards to prevent coal ash contamination via wind dispersal or leakage into water," said Yang.

"This affects nearby villages most directly but it also poses huge threats to all of China, as contaminants enter the food chain or are scattered by the winds far and wide," he said.

Yang called for reform of the country's energy structure, an improvement in energy efficiency and the development of renewable energy.

China, the world's top emitter of greenhouse gases, aims to reduce its carbon intensity rate - the amount of carbon dioxide produced per unit of gross domestic product - by 40 to 45 percent by the end of 2020.

But the International Energy Agency estimates that by 2020, China's emissions of energy-related greenhouse gases would increase more than the rest of the world's combined increase.

Related News

Wind power making gains as competitive source of electricity

Canada Wind Energy Costs are plunging as renewable energy auctions, CfD contracts, and efficient turbines drive prices to 2-4 cents/kWh across Alberta and Saskatchewan, outcompeting grid power via competitive bidding and improved capacity factors.


Key Points

Averaging 2-4 cents/kWh via auctions, CfD support, and bigger turbines, wind is now cost-competitive across Canada.

✅ Alberta CfD bids as low as 3.9 cents/kWh.

✅ Turbine outputs rose from 1 MW to 3.3 MW per tower.

✅ Competitive auctions cut costs ~70% over nine years.


It's taken a decade of technological improvement and a new competitive bidding process for electrical generation contracts, but wind may have finally come into its own as one of the cheapest ways to create power.

Ten years ago, Ontario was developing new wind power projects at a cost of 28 cents per kilowatt hour (kWh), the kind of above-market rate that the U.K., Portugal and other countries were offering to try to kick-start development of renewables. 

Now some wind companies say they've brought generation costs down to between 2 and 4 cents — something that appeals to provinces that are looking to significantly increase their renewable energy deployment plans.

The cost of electricity varies across Canada, by province and time of day, from an average of 6.5 cents per kWh in Quebec to as much as 15 cents in Halifax.

Capital Power, an Edmonton-based company, recently won a contract for the Whitla 298.8-megawatt (MW) wind project near Medicine Hat, Alta., with a bid of 3.9 cents per kWh, at a time when three new solar facilities in Alberta have been contracted at lower cost than natural gas, underscoring the trend. That price covers capital costs, transmission and connection to the grid, as well as the cost of building the project.

Jerry Bellikka, director of government relations, said Capital Power has been building wind projects for a decade, in the U.S., Alberta, B.C. and other provinces. In that time the price of wind generation equipment has been declining continually, while the efficiency of wind turbines increases.


Increased efficiency

"It used to be one tower was 1 MW; now each turbine generates 3.3 MW. There's more electricity generated per tower than several years ago," he said.

One wild card for Whitla may be steel prices — because of the U.S. and Canada slapping tariffs on one other's steel and aluminum products. Whitla's towers are set to come from Colorado, and many of the smaller components from China.


Canada introduces new surtaxes to curb flood of steel imports

"We haven't yet taken delivery of the steel. It remains to be seen if we are affected by the tariffs." Belikka said.

Another company had owned the site and had several years of meteorological data, including wind speeds at various heights on the site, which is in a part of southern Alberta known for its strong winds.

But the choice of site was also dependent on the municipality, with rural Forty Mile County eager for the development, Belikka said.


Alberta aims for 30% electricity from wind by 2030

Alberta wants 30 per cent of its electricity to come from renewable sources by 2030 and, as an energy powerhouse, is encouraging that with a guaranteed pricing mechanism in what is otherwise a market-bidding process.

While the cost of generating energy for the Alberta Electric System Operator (AESO) fluctuates hourly and can be a lot higher when there is high demand, the winners of the renewable energy contracts are guaranteed their fixed-bid price.

The average pool price of electricity last year in Alberta was 5 cents per kWh; in boom times it rose to closer to 8 cents. But if the price rises that high after the wind farm is operating, the renewable generator won't get it, instead rebating anything over 3.9 cents back to the government.

On the other hand, if the average or pool price is a low 2 cents kWh, the province will top up their return to 3.9 cents.

This contract-for-differences (CfD) payment mechanism has been tested in renewable contracts in the U.K. and other jurisdictions, including some U.S. states, according to AESO.


Competitive bidding in Saskatchewan

In Saskatchewan, the plan is to double its capacity of renewable electricity, to 50 per cent of generation capacity, by 2030, and it uses an open bidding system between the private sector generator and publicly owned SaskPower.

In bidding last year on a renewable contract, 15 renewable power developers submitted bids, with an average price of 4.2 cents per kWh.

One low bidder was Potentia with a proposal for a 200 MW project, which should provide electricity for 90,000 homes in the province, at less than 3 cents kWh, according to Robert Hornung of the Canadian Wind Energy Association.

"The cost of wind energy has fallen 70 per cent in the last nine years," he says. "In the last decade, more wind energy has been built than any other form of electricity."

Ontario remains the leading user of wind with 4,902 MW of wind generation as of December 2017, most of that capacity built under a system that offered an above-market price for renewable power, put in place by the previous Liberal government.

In June of last year, the new Conservative government of Doug Ford halted more than 700 renewable-energy projects, one of them a wind farm that is sitting half-built, even as plans to reintroduce renewable projects continue to advance.

The feed-in tariff system that offered a higher rate to early builders of renewable generation ended in 2016, but early contracts with guaranteed prices could last up to 20 years.

Hornung says Ontario now has an excess of generating capacity, as it went on building when the 2008-9 bust cut market consumption dramatically.

But he insists wind can compete in the open market, offering low prices for generation when Ontario needs new  capacity.

"I expect there will be competitive processes put in place. I'm quite confident wind projects will continue to go ahead. We're well positioned to do that."


Related News

View more

Germany agrees 200 bln euro package to shield against surging energy prices

Germany Energy Price Defensive Shield counters soaring gas and electricity costs with a gas price brake, VAT cut, subsidies for households and SMEs, LNG terminals, renewables, temporary nuclear extension, and targeted borrowing to curb inflation.


Key Points

A 200 billion euro package to cap energy costs, subsidize basics, and stabilize inflation for firms and households.

✅ Gas price brake and VAT cut reduce consumer and SME energy bills.

✅ Temporary electricity subsidies and nuclear extension aid winter supply.

✅ Funded via new borrowing; supports LNG and renewable expansion.


German Chancellor Olaf Scholz set out a 200 billion euro ($194 billion) "defensive shield", including a gas price brake and a cut in sales tax for the fuel, to protect companies and households from the impact of soaring energy prices in Germany.

Europe's biggest economy is trying to cope with surging gas and electricity costs, with local utilities seeking help, caused largely by a collapse in Russian gas supplies to Europe, which Moscow has blamed on Western sanctions following its invasion of Ukraine in February.

3 minute readSeptember 29, 202211:35 AM PDTLast Updated 6 days ago
Germany agrees 200 bln euro package to shield against surging energy prices
By Holger Hansen and Kirsti Knolle

"Prices have to come down, so the government will do everything it can. To this end, we are setting up a large defensive shield," said Scholz.

Under the plans, to run until spring 2024, the government will introduce an emergency price brake on gas, the details of which will be announced next month, while Europe weighs emergency measures to limit electricity prices across the bloc. It is scrapping a planned gas levy meant to help firms struggling with high spot market prices. 

A temporary electricity price brake will subsidise basic consumption for consumers and small and medium-sized companies, and complements an electricity subsidy for industries under discussion. Sales tax on gas will fall to 7% from 19%.

In its efforts to cut its dependence on Russian energy, Germany is also promoting the expansion of renewable energy and developing liquefied gas terminals, but rolling back European electricity prices remains complex.

To help households and companies weather any winter supply disruption, amid rising heating and electricity costs this winter, especially in southern Germany, two nuclear plants previously due to close by the end of this year will be able to keep running until spring 2023.

The package will be financed with new borrowing this year, as Berlin makes use of the suspension of a constitutionally enshrined limit on new debt of 0.35% of gross domestic product.

Finance Minister Christian Lindner has said he wants to comply with the limit again next year, even as the EU outlines gas price cap strategies for the market.

Lindner, of the pro-business Free Democrats (FDP) who share power with Scholz's Social Democrats and the Greens, said on Thursday the country's public finances were stable.

"We can put it no other way: we find ourselves in an energy war," said Lindner. "We want to clearly separate crisis expenditure from our regular budget management, we want to send a very clear signal to the capital markets."

He also said the steps would act as a brake on inflation, which hit its highest level in more than a quarter of century in September.

Opposition conservative Markus Soeder, premier of the southern state of Bavaria, said the steps gave the right signal.

"It gives industry and citizens confidence that we can get through the winter," he said.


Related News

View more

How Should California Wind Down Its Fossil Fuel Industry?

California Managed Decline of Fossil Fuels aligns oil phaseout with carbon neutrality, leveraging ZEV adoption, solar and wind growth, severance taxes, drilling setbacks, fracking oversight, CARB rules, and CalGEM regulation to deliver a just transition.


Key Points

California's strategy to phase out oil and gas while meeting carbon-neutral goals through policy, regulation, and equity.

✅ Severance taxes fund clean energy and workforce transition.

✅ Setbacks restrict drilling near schools, homes, and hospitals.

✅ CARB and CalGEM tighten fracking oversight and ZEV targets.


California’s energy past is on a collision course with its future. Think of major oil-producing U.S. states, and Texas, Alaska or North Dakota probably come to mind. Although its position relative to other states has been falling for 20 years, California remains the seventh-largest oil-producing state, with 162 million barrels of crude coming up in 2018, translating to tax revenue and jobs.

At the same time, California leads the nation in solar rooftops and electric vehicles on the road by a wide margin and ranking fifth in installed wind capacity. Clean energy is the state’s future, and the state is increasingly exporting its energy policies across the West, influencing regional markets. By law, California must have 100 percent carbon-free electricity by 2045, and an executive order signed by former Governor Jerry Brown calls for economywide carbon-neutrality by the same year.

So how can the state reconcile its divergent energy path? How should clean-energy-minded lawmakers wind down California’s oil and gas sector in a way that aligns with the state’s long-term climate targets while providing a just transition for the industry’s workforce?

Any efforts to reduce fossil fuel supply must run parallel to aggressive demand-reduction measures such as California’s push to have 5 million zero-emission vehicles on the road by 2030, said Ethan Elkind, director of Berkeley Law's climate program, especially amid debates over keeping the lights on without fossil fuels in the near term. After all, if oil demand in California remains strong, crude from outside the state will simply fill the void.

“If we don’t stop using it, then that supply is going to get here, even if it’s not produced in-state,” Elkind said in an interview.

Lawmakers have a number of options for policies that would draw down and eventually phase out fossil fuel production in California, according to a new report from the Center for Law, Energy and the Environment at the UC Berkeley School of Law, co-authored by Elkind and Ted Lamm.

They could impose a higher price on California's oil production through a "severance" tax or carbon-based fee, with the revenue directed to measures that wean the state from fossil fuels. (California, alone among major oil-producing states, does not have an oil severance tax.)

Lawmakers could establish a minimum drilling setback from schools, playgrounds, homes and other sensitive sites. They could push the state's oil and gas regulator, the California Geologic Energy Management Division, to prioritize environmental and climate concerns.

A major factor holding lawmakers back is, of course, politics, including debates over blackouts and climate policy that shape public perception. Given the state’s clean-energy ambitions, it might surprise non-Californians that the oil and gas industry is one of the Golden State’s most powerful special interest groups.

Overcoming a "third-rail issue" in California politics
The Western States Petroleum Association, the sector’s trade group in California's capital of Sacramento, spent $8.8 million lobbying state policymakers in 2019, more than any other interest group. Over the last five years, the group, which cultivates both Democratic and Republican lawmakers, has spent $43.3 million on lobbying, nearly double the total of the second-largest lobbying spender.

Despite former Governor Brown’s reputation as a climate champion, critics say he was unwilling to forcefully take on the oil and gas industry. However, things may take a different turn under Brown's successor, Governor Gavin Newsom.

In May 2019, when Newsom released California's midyear budget revision (PDF), the governor's office noted the need for "careful study and planning to decrease demand and supply of fossil fuels, while managing the decline in a way that is economically responsible and sustainable.”

Related reliability concerns surfaced as blackouts revealed lapses in power supply across the state.

Writing for the advocacy organization Oil Change International, David Turnbull observed, “This may mark the first time that a sitting governor in California has recognized the need to embark upon a managed decline of fossil fuel supply in the state.”

“It is significant because typically this is one of those third-rail issues, kind of a hot potato that governors don’t even want to touch at all — including Jerry Brown, to a large extent, who really focused much more on the demand side of fuel consumption in the state,” said Berkeley Law’s Elkind.

California's revised budget included $1.5 million for a Transition to a Carbon-Neutral Economy report, which is being prepared by University of California researchers for the California Environmental Protection Agency. In an email, a CalEPA spokesperson said the report is due by the end of this year.

Winding down oil and gas production
Since the release of the revised budget last May, Newsom has taken initial steps to increase oversight of the oil and gas industry. In July 2019, he fired the state’s top oil and gas regulator for issuing too many permits to hydraulically fracture, or frack, wells.

Later in the year, he appointed new leadership to oversee oil and gas regulation in the state, and he signed a package of bills that placed constraints on fossil fuel production. The next month, Newsom halted the approval of new fracking operations until pending permits could be reviewed by a panel of scientists at Lawrence Livermore National Laboratory. The California Geologic Energy Management Division (CalGEM) did not resume issuing fracking permit approvals until April of this year.

Not all steps have been in the same direction. This month Newsom dropped a proposal to add dozens of analysts, engineers and geologists at CalGEM, citing COVID-related economic pressure. The move would have increased regulatory oversight on fossil fuel producers and was opposed by the state's oil industry.

Ultimately, more durable measures to wind down fossil fuel supply and demand will require new legislation, even as regulators weigh whether the state needs more power plants to maintain reliability.

A 2019 bill by Assemblymember Al Muratsuchi (D-Torrance), AB 345, would have codified the minimum 2,500-foot setback for new oil and gas wells. However, before the final vote in the Assembly, the bill’s buffer requirement was dropped and replaced with a requirement for CalGEM “to consider a setback distance of 2,500 feet.” The bill passed the Assembly in January over "no" votes from several moderate Democrats; it now awaits action in the Senate.

A bill previously introduced by Assemblymember Phil Ting (D-San Francisco), AB 1745, didn’t even make it that far. Ting’s bill would have required that all new passenger cars registered in the state after January 1, 2040, be zero-emission vehicles (ZEV). The bill died in committee without a vote in April 2018.

But the backing of the California Air Resources Board (CARB), one of the world's most powerful air-quality regulators, could change the political conversation. In March, CARB chair Mary Nichols said she now supports consideration of California establishing a 100 percent zero-emission vehicle sales target by 2030, as policymakers also consider a revamp of electricity rates to clean the grid.

“In the past, I’ve been skeptical about whether that would do more harm than good in terms of the backlash by dealers and others against something that sounded so un-California like,” Nichols said during an online event. “But as time has gone on, I’ve become more convinced that we need to send the longer-term signal about where we’re headed.”

Another complicating factor for California’s political leaders is the lack of a willing federal partner — at least in the short term — in winding down oil and gas production, amid warnings about a looming electricity shortage that could pressure the grid.

Under the Trump administration, the Bureau of Land Management, which oversees 15 million acres of federal land in California, has pushed to open more than 1 million acres of public and private land across eight counties in Central California to fracking. In January 2020, California filed a federal lawsuit to block the move.


Related News

View more

Solar Becomes #3 Renewable Electricity Source In USA

U.S. Solar Generation 2017 surpassed biomass, delivering 77 million MWh versus 64 million MWh, trailing only hydro and wind; driven by PV expansion, capacity additions, and utility-scale and small-scale growth, per EIA.


Key Points

It was the year U.S. solar electricity exceeded biomass, hitting 77 million MWh and trailing only hydro and wind.

✅ Solar: 77 million MWh; Biomass: 64 million MWh (2017, EIA)

✅ PV expansion; late-year capacity additions dampen annual generation

✅ Hydro: 300 and wind: 254 million MWh; solar thermal ~3 million MWh


Electricity generation from solar resources in the United States reached 77 million megawatthours (MWh) in 2017, surpassing for the first time annual generation from biomass resources, which generated 64 million MWh in 2017. Among renewable sources, only hydro and wind generated more electricity in 2017, at 300 million MWh and 254 million MWh, respectively. Biomass generating capacity has remained relatively unchanged in recent years, while solar generating capacity has consistently grown.

Annual growth in solar generation often lags annual capacity additions because generating capacity tends to be added late in the year. For example, in 2016, 29% of total utility-scale solar generating capacity additions occurred in December, leaving few days for an installed project to contribute to total annual generation despite being counted in annual generating capacity additions. In 2017, December solar additions accounted for 21% of the annual total. Overall, solar technologies operate at lower annual capacity factors and experience more seasonal variation than biomass technologies.

Biomass electricity generation comes from multiple fuel sources, such as wood solids (68% of total biomass electricity generation in 2017), landfill gas (17%), municipal solid waste (11%), and other biogenic and nonbiogenic materials (4%).These shares of biomass generation have remained relatively constant in recent years, even as renewables' rise in 2020 across the grid.

Solar can be divided into three types: solar thermal, which converts sunlight to steam to produce power; large-scale solar photovoltaic (PV), which uses PV cells to directly produce electricity from sunlight; and small-scale solar, which are PV installations of 1 megawatt or smaller. Generation from solar thermal sources has remained relatively flat in recent years, at about 3 million MWh, even as renewables surpassed coal in 2022 nationwide. The most recent addition of solar thermal capacity was the Crescent Dunes Solar Energy plant installed in Nevada in 2015, and currently no solar thermal generators are under construction in the United States.

Solar photovoltaic systems, however, have consistently grown in recent years, as indicated by 2022 U.S. solar growth metrics across the sector. In 2014, large-scale solar PV systems generated 15 million MWh, and small-scale PV systems generated 11 million MWh. By 2017, annual electricity from those sources had increased to 50 million MWh and 24 million MWh, respectively, with projections that solar could reach 20% by 2050 in the U.S. mix. By the end of 2018, EIA expects an additional 5,067 MW of large-scale PV to come online, according to EIA’s Preliminary Monthly Electric Generator Inventory, with solar and storage momentum expected to accelerate. Information about planned small-scale PV systems (one megawatt and below) is not collected in that survey.


Related News

View more

Was there another reason for electricity shutdowns in California?

PG&E Wind Shutdown and Renewable Reliability examines PSPS strategy, wildfire risk, transmission line exposure, wind turbine cut-out speeds, grid stability, and California's energy mix amid historic high-wind events and supply constraints across service areas.


Key Points

An overview of PG&E's PSPS decisions, wildfire mitigation, and how wind cut-out limits influence grid reliability.

✅ Wind turbines reach cut-out near 55 mph, reducing generation.

✅ PSPS mitigates ignition from damaged transmission infrastructure.

✅ Baseload diversity improves resilience during high-wind events.


According to the official, widely reported story, Pacific Gas & Electric (PG&E) initiated power shutoffs across substantial portions of its electric transmission system in northern California as a precautionary measure.

Citing high wind speeds they described as “historic,” the utility claims that if it didn’t turn off the grid, wind-caused damage to its infrastructure could start more wildfires.

Perhaps that’s true. Perhaps. This tale presumes that the folks who designed and maintain PG&E’s transmission system are unaware of or ignored the need to design it to withstand severe weather events, and that the Federal Energy Regulatory Commission (FERC) and North American Electric Reliability Corp. (NERC) allowed the utility to do so.

Ignorance and incompetence happens, to be sure, but there’s much about this story that doesn’t smell right—and it’s disappointing that most journalists and elected officials are apparently accepting it without question.

Take, for example, this statement from a Fox News story about the Kincade Fires: “A PG&E meteorologist said it’s ‘likely that many trees will fall, branches will break,’ which could damage utility infrastructure and start a fire.”

Did you ever notice how utilities cut wide swaths of trees away when transmission lines pass through forests? There’s a reason for that: When trees fall and branches break, the grid can still function, and even as the electric rhythms of New York City shifted during COVID-19, operators planned for variability.

So, if badly designed and poorly maintained infrastructure isn’t the reason PG&E cut power to millions of Californians, what might have prompted them to do so? Could it be that PG&E’s heavy reliance on renewable energy means they don’t have the power to send when a “historic” weather event occurs, especially as policymakers weigh the postponed closure of three power plants elsewhere in California?


Wind Speed Limits

The two most popular forms of renewable energy come with operating limitations, which is why some energy leaders urge us to keep electricity options open when planning the grid. With solar power, the constraint is obvious: the availability of sunlight. One doesn’t generate solar power at night and energy generation drops off with increasing degrees of cloud cover during the day.

The main operating constraint of wind power is, of course, wind speed, and even in markets undergoing 'transformative change' in wind generation, operators adhere to these technical limits. At the low end of the scale, you need about a 6 or 7 miles-per-hour wind to get a turbine moving. This is called the “cut-in speed.” To generate maximum power, about a 30 mph wind is typically required. But, if the wind speed is too high, the wind turbine will shut down. This is called the “cut-out speed,” and it’s about 55 miles per hour for most modern wind turbines.

It may seem odd that wind turbines have a cut-out speed, but there’s a very good reason for it. Each wind turbine rotor is connected to an electric generator housed in the turbine nacelle. The connection is made through a gearbox that is sized to turn the generator at the precise speed required to produce 60 Hertz AC power.

The blades of the wind turbine are airfoils, just like the wings of an airplane. Adjusting the pitch (angle) of the blades allows the rotor to maintain constant speed, which, in turn, allows the generator to maintain the constant speed it needs to safely deliver power to the grid. However, there’s a limit to blade pitch adjustment. When the wind is blowing so hard that pitch adjustment is no longer possible, the turbine shuts down. That’s the cut-out speed.

Now consider how California’s power generation profile has changed. According to Energy Information Administration data, the state generated 74.3 percent of its electricity from traditional sources—fossil fuels and nuclear, amid debates over whether to classify nuclear as renewable—in 2001. Hydroelectric, geothermal, and biomass-generated power accounted for most of the remaining 25.7 percent, with wind and solar providing only 1.98 percent of the total.

By 2018, the state’s renewable portfolio had jumped to 43.8 percent of total generation, with clean power increasing and wind and solar now accounting for 17.9 percent of total generation. That’s a lot of power to depend on from inherently unreliable sources. Thus, it wouldn’t be at all surprising to learn that PG&E didn’t stop delivering power out of fear of starting fires, but because it knew it wouldn’t have power to deliver once high winds shut down all those wind turbines


Related News

View more

Are Net-Zero Energy Buildings Really Coming Soon to Mass?

Massachusetts Energy Code Updates align DOER regulations with BBRS standards, advancing Stretch Code and Specialized Code beyond the Base Energy Code to accelerate net-zero construction, electrification, and high-efficiency building performance across municipal opt-in communities.


Key Points

They are DOER-led changes to Base, Stretch, and Specialized Codes to drive net-zero, electrified, efficient buildings.

✅ Updates apply Base, Stretch, or opt-in Specialized Code.

✅ Targets net-zero by 2050 with electrification-first design.

✅ Municipalities choose code path via City Council or Town Meeting.


Massachusetts will soon see significant updates to the energy codes that govern the construction and alteration of buildings throughout the Commonwealth.

As required by the 2021 climate bill, the Massachusetts Department of Energy Resources (DOER) has recently finalized regulations updating the current Stretch Energy Code, previously promulgated by the state's Board of Building Regulations and Standards (BBRS), and establishing a new Specialized Code geared toward achieving net-zero building energy performance.

The final code has been submitted to the Joint Committee on Telecommunications, Utilities, and Energy for review as required under state law, amid ongoing Connecticut market overhaul discussions that could influence regional dynamics.

Under the new regulations, each municipality must apply one of the following:

Base Energy Code - The current Base Energy Code is being updated by the BBRS as part of its routine updates to the full set of building codes. This base code is the default if a municipality has not opted in to an alternative energy code.

Stretch Code - The updated Stretch Code creates stricter guidelines on energy-efficiency for almost all new constructions and alterations in municipalities that have adopted the previous Stretch Code, paralleling 100% carbon-free target in Minnesota and elsewhere to support building decarbonization. The updated Stretch Code will automatically become the applicable code in any municipality that previously opted-in to the Stretch Code.

Specialized Code - The newly created Specialized Code includes additional requirements above and beyond the Stretch Code, designed to get to ensure that new construction is consistent with a net-zero economy by 2050, similar to Canada's clean electricity regulations that set a 2050 decarbonization pathway. Municipalities must opt-in to adopt the Specialized Code by vote of City Council or Town Meeting.

The new codes are much too detailed to summarize in a blog post. You can read more here. Without going into those details here, it is worth noting a few significant policy implications of the new regulations:

With roughly 90% of Massachusetts municipalities having already adopted the prior version of the Stretch Code, the Commonwealth will effectively soon have a new base code that, even if it does not mandate zero-energy buildings, is nonetheless very aggressive in pushing new construction to be as energy-efficient as possible, as jurisdictions such as Ontario clean electricity regulations continue to reshape the power mix.

Although some concerns have been raised about the cost of compliance, particularly in a period of high inflation, and amid solar demand charge debates in Massachusetts, our understanding is that many developers have indicated that they can work with the new regulations without significant adverse impacts.

Of course, the success of the new codes depends on the success of the Commonwealth's efforts to transition quickly to a zero-carbon electrical grid, supported by initiatives like the state's energy storage solicitation to bolster reliability. If the cost of doing so is higher than expected, there could well be public resistance. If new transmission doesn't get built out sufficiently quickly or other problems occur, such that the power is not available to electrify all new construction, that would be a much more significant problem - for many reasons!

In short, the new regulations unquestionably set the Commonwealth on a course to electrify new construction and squeeze carbon emissions out of new buildings. However, as with the rest of our climate goals, there are a lot of moving pieces, including proposals for a clean electricity standard shaping the power sector that are going to have to come together to make the zero-carbon economy a reality.


Related News

View more

Sign Up for Electricity Forum’s Newsletter

Stay informed with our FREE Newsletter — get the latest news, breakthrough technologies, and expert insights, delivered straight to your inbox.

Electricity Today T&D Magazine Subscribe for FREE

Stay informed with the latest T&D policies and technologies.
  • Timely insights from industry experts
  • Practical solutions T&D engineers
  • Free access to every issue

Live Online & In-person Group Training

Advantages To Instructor-Led Training – Instructor-Led Course, Customized Training, Multiple Locations, Economical, CEU Credits, Course Discounts.

Request For Quotation

Whether you would prefer Live Online or In-Person instruction, our electrical training courses can be tailored to meet your company's specific requirements and delivered to your employees in one location or at various locations.