Europe's Nuclear Energy Policy shapes responses to the energy crisis, soaring gas prices, EU taxonomy rules, net-zero goals, renewables integration, baseload security, SMRs, and Russia-Ukraine geopolitics, exposing cultural, financial, and environmental divides.
Key Points
A policy guiding nuclear exits or expansion to balance energy security, net-zero goals, costs, and EU taxonomy.
✅ Divergent national stances: phase-outs vs. new builds
✅ Costs, delays, and waste challenge large reactors
✅ SMRs, renewables, and gas shape net-zero pathways
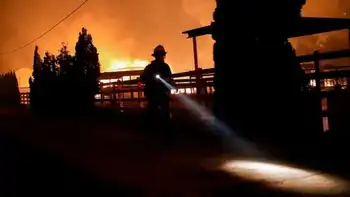
As the Fukushima disaster unfolded in Japan in 2011, then-German Chancellor Angela Merkel made a dramatic decision that delighted her country’s anti-nuclear movement: all reactors would be ditched.
What couldn’t have been predicted was that Europe would find itself mired in one of the worst energy crises in its history. A decade later, the continent’s biggest economy has shut down almost all its capacity already. The rest will be switched off at the end of 2022 — at the worst possible time.
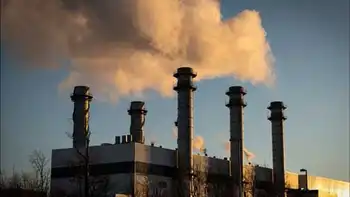
Wholesale power prices are more than four times what they were at the start of the coronavirus pandemic. Governments are having to take emergency action to support domestic and industrial consumers faced with crippling bills, which could rise higher if the tension over Ukraine escalates. The crunch has not only exposed Europe’s supply vulnerabilities, but also the entrenched cultural and political divisions over the nuclear industry and a failure to forge a collective vision.
Other regions meanwhile are cracking on, challenging the idea that nuclear power is in decline worldwide. China is moving fast on nuclear to try to clean up its air quality. Its suite of reactors is on track to surpass that of the U.S., the world’s largest, by as soon as the middle of this decade. Russia is moving forward with new stations at home and has more than 20 reactors confirmed or planned for export construction, according to the World Nuclear Association.
“I don’t think we’re ever going to see consensus across Europe with regards to the continued running of existing assets, let alone the construction of new ones,” said Peter Osbaldstone, research director for power and renewables at Wood Mackenzie Group Ltd. in the U.K. “It’s such a massive polarizer of opinions that national energy policy is required in strength over a sustained period to support new nuclear investment.”
France, Europe’s most prolific nuclear energy producer, is promising an atomic renaissance as its output becomes less reliable. Britain plans to replace aging plants in the quest for cleaner, more reliable energy sources. The Netherlands wants to add more capacity, Poland also is seeking to join the nuclear club, and Finland is starting to produce electricity later this month from its first new plant in four decades.
Belgium and Spain, meanwhile, are following Germany’s lead in abandoning nuclear, albeit on different timeframes. Austria rejected it in a referendum in 1978.
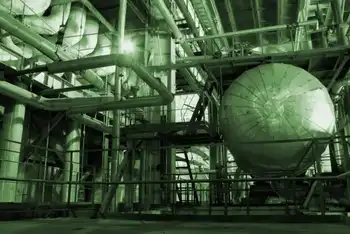
Nuclear power is seen by its proponents as vital to reaching net-zero targets worldwide. Once built, reactors supply low-carbon electricity all the time, unlike intermittent wind or solar.
Plants, though, take a decade or more to construct at best and the risk is high of running over time and over budget. Finland’s new Olkiluoto-3 unit is coming on line after a 12-year delay and billions of euros in financial overruns.
Then there’s the waste, which stays hazardous for 100,000 years. For those reasons European Union members are still quarreling over whether nuclear even counts as sustainable.
Electorates are also split. Polling by YouGov Plc published in December found that Danes, Germans and Italians were far more nuclear-skeptic than the French, British or Spanish.
“It comes down to politics,” said Vince Zabielski, partner at New York-based law firm Pillsbury Winthrop Shaw Pittman LLP, who was a nuclear engineer for 15 years. “Everything political ebbs and flows, but when the lights start going off people have a completely different perspective.”
What’s Behind Europe’s Skyrocketing Energy Prices
Indeed, there’s a risk of rolling blackouts this winter. Supply concerns plaguing Europe have sent gas and electricity prices to record levels and inflation has ballooned. There’s also mounting tension with Russia over a possible invasion of Ukraine, which could lead to disrupted supplies of gas. All this is strengthening the argument that Europe needs to reduce its dependence on international sources of gas.
Europe will need to invest 500 billion euros ($568 billion) in nuclear over the next 30 years to meet growing demand for electricity and achieve its carbon reduction targets, according to Thierry Breton, the EU’s internal market commissioner. His comments come after the bloc unveiled plans last month to allow certain natural gas and nuclear energy projects to be classified as sustainable investments.
“Nuclear power is a very long-term investment and investors need some kind of guarantee that it will generate a payoff,” said Elina Brutschin at the International Institute for Applied Systems Analysis. In order to survive in liberalized economies like the EU, the technology needs policy support to help protect investors, she said.
That already looks like a tall order. The European Commission has been told by a key expert group that the labeling risks raising greenhouse gas emissions and undermining the bloc’s reputation as a bastion for environmentally friendly finance.
Austria has threatened to sue the European Commission over attempts to label atomic energy as green. The nation previously attempted a legal challenge, when the U.K. was still an EU member, to stop the construction of Electricite de France SA’s Hinkley Point C plant, in the west of England. It has also commenced litigation against new Russia-backed projects in neighboring Hungary.
Germany, which has missed its carbon emissions targets for the past two years, has been criticized by some environmentalists and climate scientists for shutting down a supply of clean power at the worst time, despite arguments for a nuclear option for climate policy. Its final three reactors will be halted this year. Yet that was never going to be reversed with the Greens part of the new coalition government.
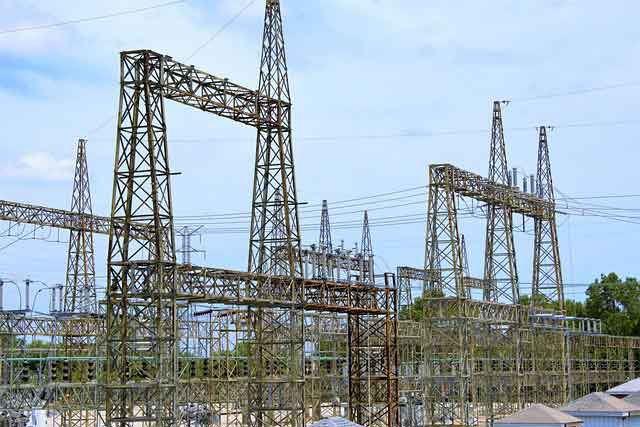
The contribution of renewables in Germany has almost tripled since the year before Fukushima, and was 42% of supply last year. That’s a drop from 46% from the year before and means the country’s new government will have to install some 3 gigawatts of renewables — equivalent to the generating capacity of three nuclear reactors — every year this decade to hit the country's 80% goal.
“Other countries don’t have this strong political background that goes back to three decades of anti-nuclear protests,” said Manuel Koehler, managing director of Aurora Energy Research Ltd., a company analyzing power markets and founded by Oxford University academics.
At the heart of the issue is that countries with a history of nuclear weapons will be more likely to use the fuel for power generation. They will also have built an industry and jobs in civil engineering around that.
Germany’s Greens grew out of anti-nuclear protest movements against the stationing of U.S. nuclear missiles in West Germany. The 1986 Chernobyl meltdown, which sent plumes of radioactive fallout wafting over parts of western Europe, helped galvanize the broader population. Nuclear phase-out plans were originally laid out in 2002, but were put on hold by the country's conservative governments. The 2011 Fukushima meltdowns reinvigorated public debate, ultimately prompting Merkel to implement them.
It’s not easy to undo that commitment, said Mark Hibbs, a Bonn, Germany-based nuclear analyst at Carnegie Endowment for International Peace, or to envision any resurgence of nuclear in Germany soon: “These are strategic decisions, that have been taken long in advance.”
In France, President Emmanuel Macron is about to embark on a renewed embrace of nuclear power, even as a Franco-German nuclear dispute complicates the debate. The nation produces about two-thirds of its power from reactors and is the biggest exporter of electricity in Europe. Notably, that includes anti-nuclear Germany and Austria.
EDF, the world’s biggest nuclear plant operator, is urging the French government to support construction of six new large-scale reactors at an estimated cost of about 50 billion euros. The first of them would start generating in 2035.
But even France has faced setbacks. Development of new projects has been put on hold after years of technical issues at the Flamanville-3 project in Normandy. The plant is now scheduled to be completed next year.
In the U.K., Business Secretary Kwasi Kwarteng said that the global gas price crisis underscores the need for more home-generated clean power. By 2024, five of Britain’s eight plants will be shuttered because they are too old. Hinkley Point C is due to be finished in 2026 and the government will make a final decision on another station before an election due in 2024.
One solution is to build small modular reactors, or SMRs, which are quicker to construct and cheaper. The U.S. is at the forefront of efforts to design smaller nuclear systems with plans also underway in the U.K. and France. Yet they too have faced delays. SMR designs have existed for decades though face the same challenging economic metrics and safety and security regulations of big plants.
The trouble, as ever, is time. “Any investment decisions you make now aren’t going to come to fruition until the 2030s,” said Osbaldstone, the research director at Wood Mackenzie. “Nuclear isn’t an answer to the current energy crisis.”
Related News