Substation Relay Protection Training
Our customized live online or in‑person group training can be delivered to your staff at your location.

- Live Online
- 12 hours Instructor-led
- Group Training Available
Regular Price:
$699
Coupon Price:
$599
TORONTO
—
Canadian Energy Infrastructure Tariffs are reshaping pipelines, deregulation, and energy independence, as U.S. trade tensions accelerate approvals for Alberta oil sands, Trans Mountain expansion, and CAPP proposals amid regulatory reform and market diversification.
The Latest Developments
U.S. tariff threats drive approvals, infrastructure, and diversification to strengthen Canada energy security.
US tariff threat catalyzes support for pipelines and export routes
Pembina sees tailwinds from faster approvals and deregulation
CAPP urges infrastructure, clean grids, and battery priorities
Environmental and Indigenous concerns over expedited reviews
In recent months, the Canadian energy sector has experienced a shift in public and political attitudes toward infrastructure projects, particularly those related to oil and gas production. This shift has been largely influenced by the threat of tariffs from the United States, as well as growing concerns about energy independence and U.S.-Canada trade tensions more broadly.
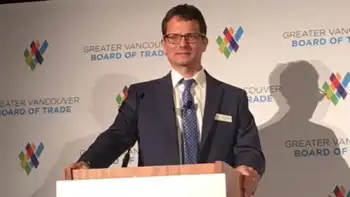
Scott Burrows, the CEO of Pembina Pipeline Corp., noted in a conference call that the potential for U.S. tariffs on Canadian energy imports has spurred a renewed sense of urgency and receptiveness toward energy infrastructure projects in Canada. With U.S. President Donald Trump’s proposed tariffs Trump tariff threat on Canadian imports, particularly a 10% tariff on energy products, there is increasing recognition within Canada that these projects are essential for the country’s long-term economic and energy security.
While the direct impact of the tariffs is not immediate, industry leaders are optimistic about the long-term benefits of deregulation and faster project approvals, even as some see Biden as better for Canada’s energy sector overall. Burrows highlighted that while it will take time for the full effects to materialize, there are significant "tailwinds" in favor of faster energy infrastructure development. This includes the possibility of more streamlined regulatory processes and a shift toward more efficient project timelines, which could significantly benefit the Canadian energy sector.
This changing landscape is particularly important for Alberta’s oil production, which is one of the largest contributors to Canada’s energy output. The Canadian Association of Petroleum Producers (CAPP) has responded to the growing tariff threat by releasing an “energy platform,” outlining recommendations for Ottawa to help mitigate the risks posed by the evolving trade situation. The platform includes calls for improved infrastructure, such as pipelines and transportation systems, and priorities like clean grids and batteries, to ensure that Canadian energy can reach global markets more effectively.
The tariff threat has also sparked a wider conversation about the need for Canada to strengthen its energy infrastructure and reduce its dependency on the U.S. for energy exports. With the potential for escalating trade tensions, there is a growing push for Canadian energy resources to be processed and utilized more domestically, though cutting Quebec’s energy exports during a tariff war. This has led to increased political support for projects like the Trans Mountain pipeline expansion, which aims to connect Alberta’s oil sands to new markets in Asia via the west coast.
However, the energy sector’s push for deregulation and quicker approvals has raised concerns among environmental groups and Indigenous communities. Critics argue that fast-tracking energy projects could lead to inadequate environmental assessments and greater risks to local ecosystems. These concerns underscore the tension between economic development and environmental protection in the energy sector.
Despite these concerns, there is a clear consensus that Canada’s energy industry needs to evolve to meet the challenges posed by shifting trade dynamics, even as polls show support for energy and mineral tariffs in the current dispute. The proposed U.S. tariffs have made it increasingly clear that the country’s energy infrastructure needs significant investment and modernization to ensure that Canada can maintain its status as a reliable and competitive energy supplier on the global stage.
As the deadline for the tariff decision approaches, and as Ford threatens to cut U.S. electricity exports, Canada’s energy sector is bracing for the potential fallout, while also preparing to capitalize on any opportunities that may arise from the changing trade environment. The next few months will be critical in determining how Canadian policymakers, businesses, and environmental groups navigate the complex intersection of energy, trade, and regulatory reform.
While the threat of U.S. tariffs may be unsettling, it is also serving as a catalyst for much-needed changes in Canada’s energy policy. The push for faster approvals and deregulation may help address some of the immediate concerns facing the sector, but it will be crucial for the government to balance economic interests with environmental and social considerations as the country moves forward in its energy transition.
Related News
Related News
Heathrow Airport Power Outage: Vulnerabilities Flagged Days Before Disruption
Heathrow Airport Power Outage 2025 disrupted operations with mass flight cancellations and diversions after a…
View more

TTC Introduces Battery Electric Buses
TTC Battery-Electric Buses lead Toronto transit toward zero-emission mobility, improving air quality and climate goals…
View more
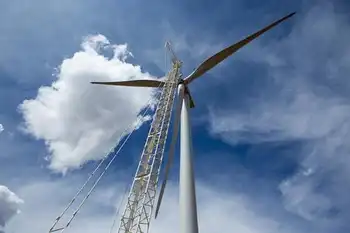
Worker injured after GE turbine collapse
GE Wind Turbine Collapse Brazil raises safety concerns at Omega Energia's Delta VI wind farm…
View more
European gas prices fall to pre-Ukraine war level
European Gas Prices hit pre-invasion lows as LNG inflows, EU storage gains, and softer oil…
View more
Drought, lack of rain means BC Hydro must adapt power generation
BC Hydro drought operations address climate change impacts with hydropower scheduling, reservoir management, water conservation,…
View more
Two new BC generating stations officially commissioned
BC Hydro Site C and Clean Energy Policy shapes B.C.'s power mix, affecting run-of-river hydro,…
View more
Sign Up for Electricity Forum’s Newsletter
Stay informed with our FREE Newsletter — get the latest news, breakthrough technologies, and expert insights, delivered straight to your inbox.
Electricity Today T&D Magazine Subscribe for FREE

Stay informed with the latest T&D policies and technologies.
- Timely insights from industry experts
- Practical solutions T&D engineers
- Free access to every issue
