Substation Relay Protection Training
Our customized live online or in‑person group training can be delivered to your staff at your location.

- Live Online
- 12 hours Instructor-led
- Group Training Available
Regular Price:
$699
Coupon Price:
$599
Gov. Phil Bredesen called on lawmakers to enact minimum residential building codes in Tennessee to help encourage better energy efficiency.
The building code measure is part of a larger proposal by the Democratic governor to improve the state's clean energy standards and help reduce the state's per capita electricity consumption which is among the country's highest.
Other elements of Bredesen's proposal include requiring increased energy efficiency in state buildings and vehicles and expanding tax incentives for job creation in the green energy field.
"The good thing about a lot of these energy issues is there might be a little cost up front but you very quickly recoup it," Bredesen told reporters after the announcement.
Bredesen said he wants to overhaul equipment ranging from lighting controls to heating and cooling systems in state agencies that are housed in more than 30 million square feet of building space.
The five-year program could cost "tens of millions of dollars," but the governor proposed issuing bonds to pay for the upgrades and paying for the debt service with energy savings.
"You just look at the life cycle cost of something, don't just consider what it costs to buy it, also consider what it costs you to operate it," Bredesen said.
Senate Finance Chairman Randy McNally, an Oak Ridge Republican who expressed concern about increased state indebtedness from bonds, said he doesn't have any immediate worries about the energy efficiency bond proposal.
"We'll look at it and everything, but I think it makes sense," he said.
There is no current statewide residential building code, though the Department of Commerce and Insurance does electrical inspections in areas that don't currently set minimum standards.
"Homeowners are ultimately going to save on their energy bills as a result of this, and it will also make for safer homes and better quality new construction," Bredesen said.
"At this time when there's a little bit of a pause in the building industry, it could be a perfect time to make these changes and set it up," he said.
Bredesen's plan also outlines how the state would spend about $99 million in federal stimulus funds aimed at improving weatherization in lower income homes.
Eligibility for the program to provide improvements like weather-stripping and insulation would be expanded to families with incomes up to double the federal poverty limit, or about $44,100 for a family of four. The previous income limit for the same-sized family was $27,562.
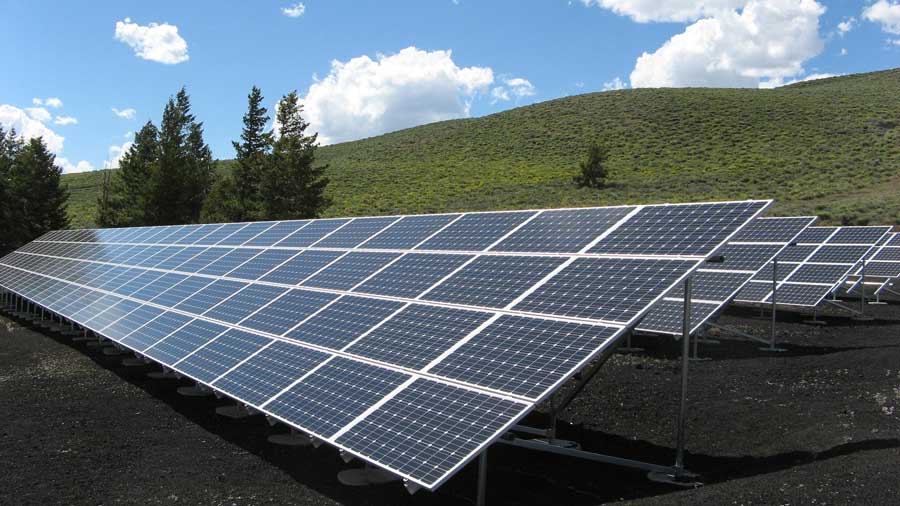
Another facet of Bredesen's plan would provide state funding for the solar research institute he proposed in his State of the State address earlier this year. The governor said there's money available in the state's Economic and Community Development budget that is tied to energy efficiency programs, but said he did not yet know how much he would propose to spend on the initiative.
The plan would also require 25 percent of new vehicles bought by the state to be hybrid, electric or compact fuel-efficient cars, and write into law an executive order Bredesen signed in December requiring the state to buy only Energy Star rated products for areas including office equipment, appliances, lighting and heating and cooling systems.
"Governor Bredesen's emphasis on conservation, solar power, electric vehicles and biofuels is exactly right for Tennessee and our future," U.S. Sen. Lamar Alexander, R-Tenn., said in a statement.
Related News

Electricity Prices Surge to Record as Europe Struggles to Keep Lights on
France Electricity Crisis drives record power prices as nuclear outages squeeze supply, forcing energy imports,…
View more
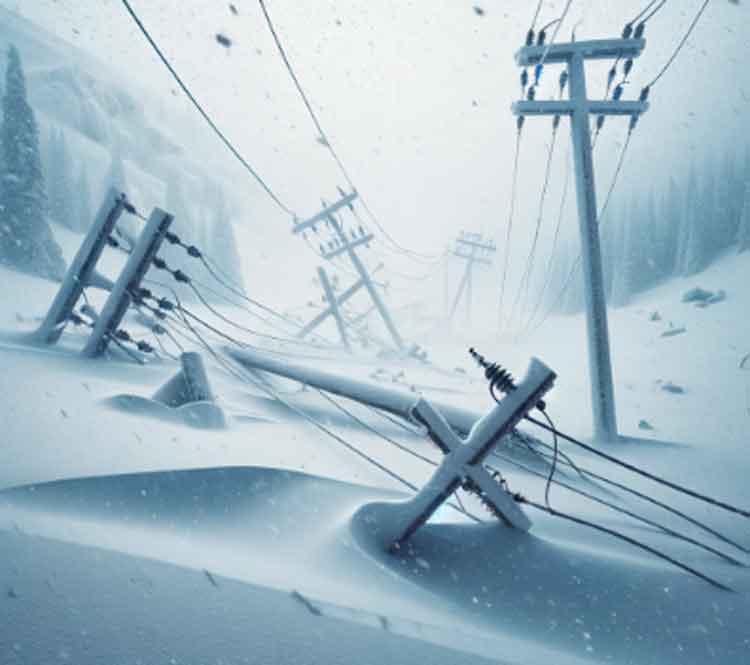
Ukrainians Find New Energy Solutions to Overcome Winter Blackouts
Ukraine Winter Energy Crisis highlights blackouts, damaged grid, and resilient solutions: solar panels, generators, wood…
View more
SC nuclear plant on the mend after a leak shut down production for weeks
V.C. Summer nuclear plant leak update: Dominion Energy repaired a valve in the reactor cooling…
View more
Snohomish PUD Hikes Rates Due to Severe Weather Impact
Snohomish PUD rate increase addresses storm recovery after a bomb cyclone and extended cold snap,…
View more
New rules give British households right to sell solar power back to energy firms
UK Smart Export Guarantee enables households to sell surplus solar energy to suppliers, with dynamic…
View more

Global push needed to ensure "clean, affordable and sustainable electricity" for all
SDG7 Energy Progress Report assesses global energy access, renewables, clean cooking, and efficiency, citing COVID-19…
View more
Sign Up for Electricity Forum’s Newsletter
Stay informed with our FREE Newsletter — get the latest news, breakthrough technologies, and expert insights, delivered straight to your inbox.
Electricity Today T&D Magazine Subscribe for FREE

Stay informed with the latest T&D policies and technologies.
- Timely insights from industry experts
- Practical solutions T&D engineers
- Free access to every issue
