Electrical Commissioning In Industrial Power Systems
Our customized live online or in‑person group training can be delivered to your staff at your location.

- Live Online
- 12 hours Instructor-led
- Group Training Available
Regular Price:
$599
Coupon Price:
$499
The Department of Energy has tentatively awarded its first alternative-energy loan guarantee, breaking a four-year logjam in the federal loan program.
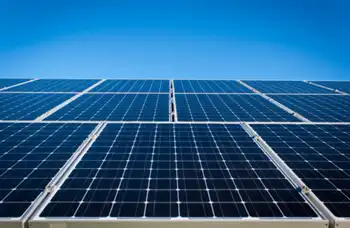
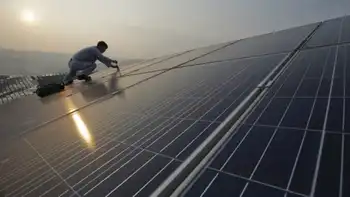
The $535 million loan guarantee will go to Solyndra, Inc., which said it would use the money to expand its production of photovoltaic systems at its facilities in Fremont, Calif. The company said that the federal loan guarantee would cover roughly 75 percent of the project costs and would ultimately produce thousands of new construction, manufacturing and installation jobs.
Once the panels are installed and producing power, the company said, it will generate up to 15 gigawatts of electricity and save some 300 million metric tons of carbon dioxide emissions.
The loan guarantee, which is still subject to final legal and financial approvals, comes under a slow-moving program originally authorized by Congress in 2005. The application process has been hindered by bureaucratic inertia and lengthy reviews of hundreds of applications for more than $40 billion in loan guarantees.
But newly installed Energy Secretary Steven Chu has made it a priority to begin releasing the guarantees to help meet the administrationÂ’s twin goals of creating jobs and developing carbon-free sources of power.
“This investment is part of President Obama’s aggressive strategy to put Americans back to work and reduce our dependence on foreign oil by developing clean, renewable sources of energy,” Dr. Chu said in a statement. “We can create millions of new, good-paying jobs that can’t be outsourced. Instead of relying on imports from other countries to meet our energy needs, we’ll rely on America’s innovation, America’s resources, and America’s workers.”
The department is moving quickly to complete reviews of dozens of other projects and expects to announce funding decisions in coming weeks, officials said. The loan guarantee program is designed to provide funding for advanced energy projects, nuclear fuel and power plant work, energy efficiency programs and new power transmission technologies. The program is also supposed to finance work on so-called clean coal technologies and projects to capture and store carbon dioxide emissions.
Chris Gronet, the founder and chairman of Solyndra, said the guaranteed funding “will enable Solyndra to achieve the economies of scale needed to deliver solar electricity at prices that are competitive with utility rates. This expansion is really about creating new jobs while meaningfully impacting global warming.”
The companyÂ’s photovoltaic panels are designed for installation on commercial industrial rooftops and lay flat rather than on an angle. The company has been shipping panels since last July.
Senator Jeff Bingaman, the Energy Committee chairman, has been pressing the Energy Department since passage of the 2005 law to release the funding guarantees. “After years of watching this program struggle to get off the ground,” he said, “it’s encouraging to see that Secretary Chu’s energetic new leadership at the department is having an effect.”
Related News
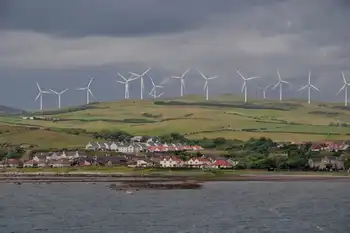
Scotland’s Wind Farms Generate Enough Electricity to Power Nearly 4.5 Million Homes
Scotland Wind Energy delivered record renewable power as wind turbines and farms generated 9,831,320 MWh…
View more
Putting Africa on the path to universal electricity access
West and Central Africa Electricity Access hinges on utility reform, renewable energy, off-grid solar, mini-grids,…
View more
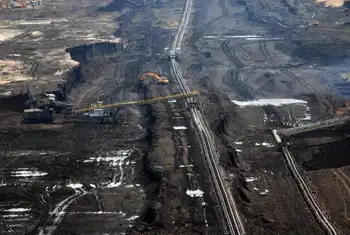
First US coal plant in years opens where no options exist
Alaska Coal-Fired CHP Plant opens near Usibelli mine, supplying electricity and district heat to UAF;…
View more
Energy Department Announces 20 New Competitors for the American-Made Solar Prize
American-Made Solar Prize Round 3 accelerates DOE-backed solar innovation, empowering entrepreneurs and domestic manufacturing with…
View more
Three New Solar Electricity Facilities in Alberta Contracted At Lower Cost than Natural Gas
Alberta Solar Energy Contracts secure low-cost photovoltaic PPAs for government operations, delivering renewable electricity at…
View more

N.L., Ottawa agree to shield ratepayers from Muskrat Falls cost overruns
Muskrat Falls Financing Restructuring redirects megadam benefits to ratepayers, stabilizes electricity rates, and overhauls federal…
View more
Sign Up for Electricity Forum’s Newsletter
Stay informed with our FREE Newsletter — get the latest news, breakthrough technologies, and expert insights, delivered straight to your inbox.
Electricity Today T&D Magazine Subscribe for FREE

Stay informed with the latest T&D policies and technologies.
- Timely insights from industry experts
- Practical solutions T&D engineers
- Free access to every issue
