NFPA 70E Training
Our customized live online or in‑person group training can be delivered to your staff at your location.

- Live Online
- 6 hours Instructor-led
- Group Training Available
Regular Price:
$199
Coupon Price:
$149
WASHINGTON
—
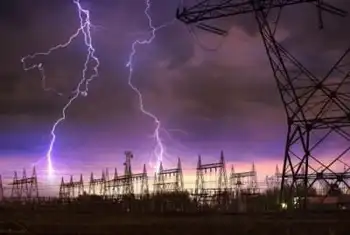
US Power Grid Blackouts highlight aging infrastructure, rising outages, and declining reliability per DOE and NERC data, with weather-driven failures, cyberattack risk, and underinvestment stressing utilities, transmission lines, and modernization efforts.
What's Behind the News
US power grid blackouts are outages caused by aging grid assets, severe weather, and cyber threats reducing reliability.
Outages up 285% vs 1984; US leads developed nations in blackouts.
Weather drives 68-73% of major outages, up sharply since 2008.
Economic losses up to $150B per year from power interruptions.
Aging grid earns D+; long restorations vs Japan's 4 minutes/year.
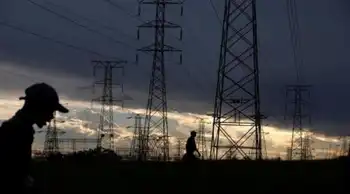
The United States power grid has more blackouts than any other country in the developed world, according to new data and U.S. blackout warnings that spotlight the country’s aging and unreliable electric system.
The data by the Department of Energy (DOE) and the North American Electric Reliability Corporation (NERC) shows that Americans face more power grid failures lasting at least an hour than residents of other developed nations.
And it’s getting worse.
Going back three decades, the US grid loses power 285 percent more often than it did in 1984, when record keeping began, International Business Times reported. The power outages cost businesses in the United States as much as $150 billion per year, according to the Department of Energy.
Customers in Japan lose power for an average of 4 minutes per year, as compared to customers in the US upper Midwest (92 minutes) and upper Northwest (214), University of Minnesota Professor Massoud Amin told the Times. Amin is director of the Technological Leadership Institute at the school.
#google#
The grid is becoming less dependable each year, he said.
“Each one of these blackouts costs tens of hundreds of millions, up to billions, of dollars in economic losses per event,” Amin said. “… We used to have two to five major weather events per year [that knocked out power], from the ‘50s to the ‘80s. Between 2008 and 2012, major outages caused by weather, reflecting extreme weather trends, increased to 70 to 130 outages per year. Weather used to account for about 17 to 21 percent of all root causes. Now, in the last five years, it’s accounting for 68 to 73 percent of all major outages.”
As previously reported by Off The Grid News, the power grid received a “D+” grade on its power grid report card from the American Society of Civil Engineers (ASCE) in 2013. The power grid grade card rating means the energy infrastructure is in “poor to fair condition and mostly below standard, with many elements approaching the end of their service life.” It further means a “large portion of the system exhibits significant deterioration” with a “strong risk of failure.”
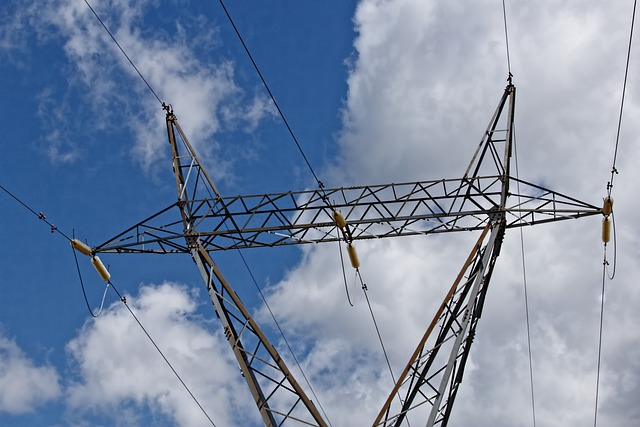
“America relies on an aging electrical grid and pipeline distribution systems, some of which originated in the 1880s,” the 2013 ASCE report read. “Investment in power transmission has increased since 2005, but ongoing permitting issues, weather events, and limited maintenance have contributed to an increasing number of failures and power interruptions.”
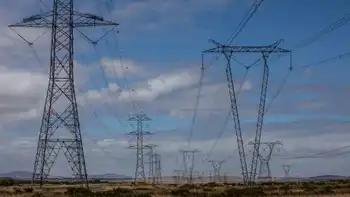
As The Times noted, the US power grid as it exists today was built shortly after World War II, with the design dating back to Thomas Edison. While Edison was a genius, he and his contemporaries could not have envisioned all the strains the modern world would place upon the grid and the multitude of tech gadgets many Americans treat as an extension of their body. While the drain on the grid has advanced substantially, the infrastructure itself has not.
There are approximately 5 million miles of electrical transmission lines throughout the United States, and thousands of power generating plants dot the landscape. The electrical grid is managed by a group of 3,300 different utilities and serve about 150 million customers, The Times said. The entire power grid system is currently valued at $876 billion.
Many believe the grid is vulnerable to an attack on substations and other threats.
Former Department of Homeland Security Secretary Janet Napolitano once said that a power grid cyber attack is a matter of “when” not “if,” as Russians hacked utilities incidents have shown.
Related News
Related News
Cape Town to Build Own Power Plants, Buy Additional Electricity
Cape Town Renewable Energy Plan targets 450+ MW via solar, wind, and battery storage, cutting…
View more
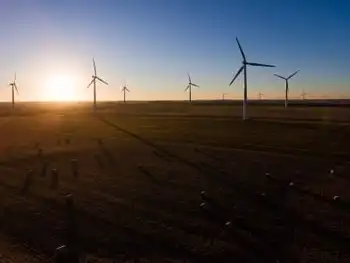
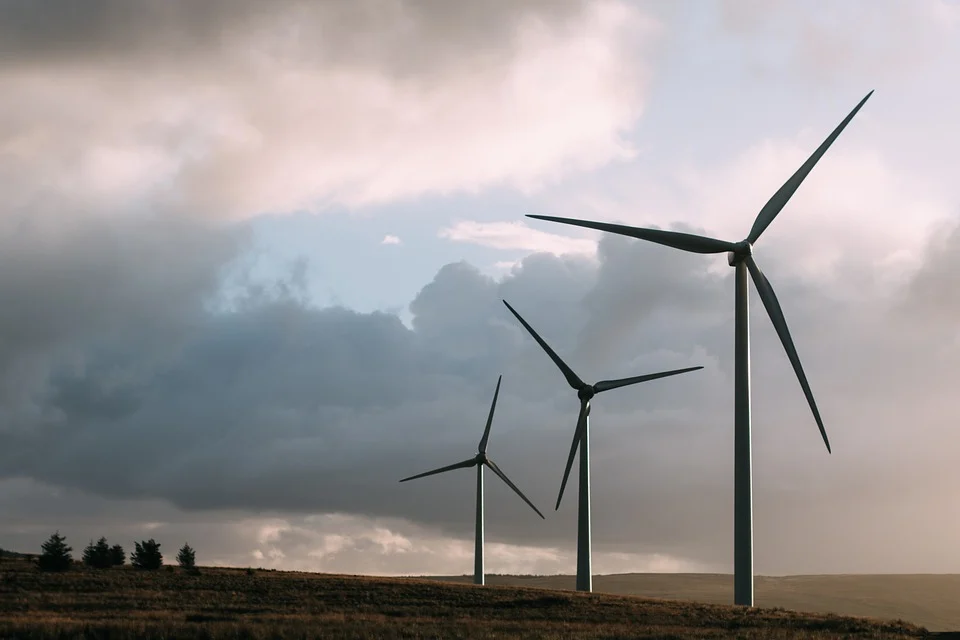
Two huge wind farms boost investment in America’s heartland
MidAmerican Energy Wind XI expands Iowa wind power with the Beaver Creek and Prairie farms,…
View more
Ireland makes EU Grids Package top energy priority to ease T&D bottlenecks
EU Grids Package leads Ireland's energy agenda, with permitting reform and cross-border transmission rules prioritized…
View more
Africa must quadruple power investment to supply electricity for all, IEA says
Africa Energy Investment must quadruple, says IEA, to deliver electricity access via grids, mini-grids, and…
View more

Electricity use actually increased during 2018 Earth Hour, BC Hydro
Earth Hour BC highlights BC Hydro data on electricity use, energy savings, and participation in…
View more
Tube Strikes Disrupt London Economy
London Tube Strikes Economic Impact highlights transport disruption reducing foot traffic, commuter flows, and tourism,…
View more
Sign Up for Electricity Forum’s Newsletter
Stay informed with our FREE Newsletter — get the latest news, breakthrough technologies, and expert insights, delivered straight to your inbox.
Electricity Today T&D Magazine Subscribe for FREE

Stay informed with the latest T&D policies and technologies.
- Timely insights from industry experts
- Practical solutions T&D engineers
- Free access to every issue

