Substation Relay Protection Training
Our customized live online or in‑person group training can be delivered to your staff at your location.

- Live Online
- 12 hours Instructor-led
- Group Training Available
Regular Price:
$699
Coupon Price:
$599
Sustainable design is being credited for saving an estimated $85,000 in electric and gas expenses for the 2007/ 2008 school year at Fossil Ridge High School (FRHS) in the Poudre School District in Fort Collins, Colorado.
An integral part of the building's high performance design is CALMACÂ’s Ice Storage air conditioning system.
Compared to an existing, similarly sized 1,800 student school in the same district, FRHS requires half of the electric demand.
"Fossil Ridge energy bills are about 33% less than those of a recently built, comparably sized high school in the district," according to Stu Reeve, the district's Energy Manager. "Furthermore, this design costs no more to implement than traditional designs." Whereas typical school designs today use 3 watts / sq. ft., FRHS uses only 1.6 watts / sq. ft.
Projected over the life of the building, energy savings from the building's mechanical, plumbing, irrigation and lighting systems are estimated at more than $6 million at current utility rates. If all schools were designed in this fashion, it would free up limited funds to lower property taxes or improve facilities, hire more teachers, and provide students with a better opportunity for success.
Here are just a few of the energy saving features that were incorporated into Fossil Ridge in order to meet the standards set forth in the "Sustainable Design Guidelines”:
• Building orientation to take maximum advantage of sunlight;
• Day lighting throughout the facility;
• Strategically positioning exterior shading devices to minimize the direct solar heat gain;
• ~R20 insulated walls and ~R-30 ceilings;
• Tubular skylights;
• Sensors that adjust artificial lighting levels based on the amount of daylight in classrooms;
• Automated building system controls for all lighting and HVAC equipment;
• Ice Storage air conditioning system cools the building during expensive on-peak electrical use by making and storing ice at night when the building has fewer electric loads, then using the ice during the following day;
• Drought-tolerant native landscaping;
• Efficient, "right-sized" heating system.
Ice Storage was the air conditioning system of choice because of its ability to dramatically reduce equipment sizes and connected load, thereby lowering operating costs throughout the life of the building.
Most school designs in the Poudre County School District call for one ton of cooling for every 1,000 sq. ft. of air-conditioned space, which is very aggressive by current practices. That means a conventional design at FRHS would have required a 525 ton chiller and appropriately sized support equipment.
Instead, this integrated design calls for 1 ton of mechanical cooling for every 2000 sq. ft., representing a huge savings to the district. The 250 ton cooling load is met with 8 IceBank Energy Storage tanks from CALMAC Manufacturing Corporation and a 130-ton chiller from the Trane Company.
Inexpensive nighttime electricity is stored in the form of ice inside the Ice Storage tanks, which is then used to cool the school the following day and thus reducing demand and expensive on peak electricity purchases. The Ice Storage system also helps FRHS utilize renewable energy from the photovoltaic panels without penalty.
When cloud cover reduces the PV panel output, Ice Storage can pick up the slack to minimize electric demand and on-peak purchases due to cloud cover. Furthermore, Fossil Ridge H.S. purchases 100% of its electricity from wind turbines, and that electricity can also be stored.
Fossil Ridge High School (FRHS) of the Poudre School District in Fort Collins, CO, with about 262,700 sq. ft. of conditioned space, has been awarded the American Society of Heating, Refrigeration, and Air-conditioning's ASHRAE Technology Award for New Institutional Buildings.
It is also the first high school in Colorado to certify with the United States Green Buildings Council's Leadership in Energy and Environmental Design (LEED) Project to which Ice Storage helped in earning certification credits.
Related News
Britain's National Grid Drops China-Based Supplier Over Cybersecurity Fears
National Grid Cybersecurity Component Removal signals NCSC and GCHQ oversight of critical infrastructure, replacing NR…
View more

California avoids widespread rolling blackouts as heat strains power grid
California Heat Wave Grid Emergency sees CAISO issue Stage 3 alerts as record demand, extreme…
View more
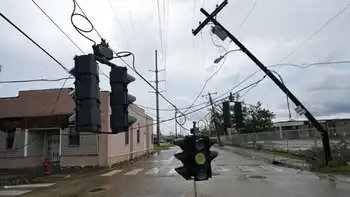
Louisiana power grid needs 'complete rebuild' after Hurricane Laura, restoration to take weeks
Louisiana Grid Rebuild After Hurricane Laura will overhaul transmission lines and distribution networks in Lake…
View more
Negative Electricity Prices Amid Renewable Energy Surplus
France Negative Electricity Prices highlight surplus renewables as solar and wind output exceeds demand, driving…
View more

Christmas electricity spike equivalent to roasting 1.5 million turkeys: BC Hydro
BC Hydro Holiday Energy Saving Tips highlight electricity usage trends and power conservation during Christmas…
View more
FPL Proposes Significant Rate Hikes Over Four Years
FPL Rate Increase Proposal 2026-2029 outlines $9B base-rate hikes as Florida grows, citing residential demand,…
View more
Sign Up for Electricity Forum’s Newsletter
Stay informed with our FREE Newsletter — get the latest news, breakthrough technologies, and expert insights, delivered straight to your inbox.
Electricity Today T&D Magazine Subscribe for FREE

Stay informed with the latest T&D policies and technologies.
- Timely insights from industry experts
- Practical solutions T&D engineers
- Free access to every issue
