Lightning strikes leave a lasting impression

By Toronto Star


Electrical Testing & Commissioning of Power Systems

Our customized live online or in‑person group training can be delivered to your staff at your location.

  • Live Online
  • 12 hours Instructor-led
  • Group Training Available
Regular Price:
$599
Coupon Price:
$499
Reserve Your Seat Today
"I watch the skies all the time," says Kim McNairn. "I've been leaving my bike, not wanting to head out into the storms we've been having for the past 10 days. Every bit of lightning, every plane overhead, I look. Even though I'm a rational person, a journalist, you still look and hear the sounds again."

The sounds she's referring to were apocalyptic – the roar of lightning under her tent. She was camping with her husband, Globe and Mail reporter Les Perreaux, in northern Quebec when a wild storm broke at around 2 a.m. on July 16, she says by phone from Montreal, where the 32-year-old is producer of the local CBC Radio afternoon show.

"You could hear the thunder getting closer, we were counting the time from lightning to thunder, three seconds, two seconds, one second. It sounded like a bomb. An explosion. I felt it was in my head, right there. Our tent is orange and the light coming in was orange, but there was a bright white light and flashes of blue."

Most horribly, they smelled their hair burning, though when they examined themselves later they found no trace of burns. For a moment they were engulfed in the astonishing and mysterious world of lightning, and they survived.

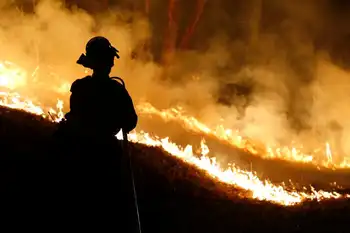
Lightning's power is ferocious. It can blast the core of giant trees and turn bark to shrapnel; each year it starts some 4,000 forest fires in Canada. It blazes through the sky at thousands of kilometres a second. At 28,000 Celsius, lightning is five times hotter than the surface of the sun.

It can truly be a bolt from the blue, striking more than 16 kilometres from a cumulonimbus, known as the king of the clouds.

For that reason, Canada's weather service is considering changing its lightning recommendations, says meteorologist Geoff Coulson of Environment Canada. The current rule is called 30-30. The first 30 refers to taking shelter if there are fewer than 30 seconds between lightning and thunder. It's a way of estimating distance from the storm – each second represents 300 metres. The second is an instruction to wait 30 minutes after the last thunderclap before returning outdoors.

The new guideline is to take cover as soon as you hear thunder. Phrases like "If the sky roars, get indoors" help keep the rule in mind.

The mystery of lightning encompasses not only McNairn's experience – "Why am I alive after this mythical thing?" – but also the science of the phenomenon.

Lightning is produced when positively and negatively charged bits of ice in a thundercloud become separated and are buffeted by air currents, so that the positive charges move to the top of the cloud and the negative, to the bottom. As the cloud moves over a landscape, it causes an increase in the flow of positive charges from the earth.

What's unclear is precisely why lightning strikes in one place and not another. "It sounds like the most fundamental thing – exactly why lightning goes to the ground, why most of it stays in the clouds," says Martin Uman of the University of Florida, where he is director of the Lightning Research Laboratory. "We don't understand the whole initial process."

The problem is that "you can't be in all parts of the cloud at the same time, and clouds change so rapidly," continues Uman, one of the few world experts on lightning and author of The Art and Science of Lightning Protection, published earlier this year. "It's overwhelming."

In his research, Uman is looking for the source of X-rays emitted by lightning. He and a team of engineering researchers reported earlier this month that as lightning descends from the clouds in stages or steps, up to 50 metres long, there's a burst of X-rays just beneath each step. "We're trying to understand why each step should make X-rays, which are associated with (lightning) propagation," he says.

As the negatively charged "step leader" drops toward the Earth's surface, positively charged streamers (which can rise from something tall, like a tree or even a golfer) leap upward to meet it. An electric current occurs when the two connect and a channel of air lights from the bottom up.

"When you have that tingling feeling, when your hair is standing up, there is a flow of positive charges streaming up to meet that negative charge," says David Phillips, Environment Canada's senior climatologist. "It's a sign you're about to be zapped."

Each year in Canada there are 2 to 3 million lightning strikes, which at their most powerful can carry up to 100 million volts of electricity. Lightning is most common in storm-rich southern Ontario between the Great Lakes and in the foothills of the Rockies, but is almost unknown in the Arctic, a situation that may be changing with the advance of global warming. Windsor is the lightning hot spot among major Canadian cities, while Toronto ranks second.

If it seems there's been more lightning this year, that's because there has been, says Phillips. The 34 hours of thunderstorms in Toronto in June and July are more than four times the number last year. (In Hamilton, the increase is six fold.)

About 10 people are killed each year in Canada from lightning; the cause of death is almost always cardiac arrest. A man was killed in a rowboat recently north of Trois-Rivieres, Que., and a 28-year-old man was fatally struck on July 8 while seeking shelter under a solitary maple tree at Christie Pits.

There were many more lightning deaths in the 1930s, when as many as 50 would perish annually. Now people have high-tech weather forecasts and know more about how to protect themselves.

Lightning strikes across Canada may be viewed, almost in real time, on Environment Canada's Lightning Detection Network's website, which is updated hourly. "We can see right down to the millisecond where it is occurring," says William Burrows, a research scientist for Environment Canada in Edmonton. There are 83 electronic detectors, generally in remote parts of the country, that capture lightning strikes and send the information by satellite to a centre in Tucson and then back to Canada's weather centres, where the data is mapped on a computer screen. The process takes about 40 seconds.

Connected to the U.S. national weather service network, the information is used for aviation safety and weather warnings.

Some 125 Canadians a year sustain serious enough injuries when struck by lightning to require hospitalization.

Phillips says about 70 per cent will recover fully, but among the other 30 per cent, some will have profound neurological impairment. Because of frontal lobe damage they may suffer personality changes, lose the ability to process bits of information simultaneously, be slow to react, and/or have poor short-term memory. As a result, they may isolate themselves.

But Phillips contends everyone who's struck is changed – "You're never the same person."

Kim McNairn has been researching weather the past few weeks, trying to understand what happened to her on their camping trip. In a way, her personality has been recalibrated by her encounter with lightning. "People said, 'There is something different about Kim.' Someone told me later I seemed kind of ZenÂ…. They thought something was wrong because I'm a high-energy person...

"To be in the presence of it and survive, it's so thrillingÂ…. It made me focus my life on what's important. I found myself saying I'm really happy to get another chance. What am I going to do with the time I have?"

Related News

Solar Becomes #3 Renewable Electricity Source In USA

U.S. Solar Generation 2017 surpassed biomass, delivering 77 million MWh versus 64 million MWh, trailing only hydro and wind; driven by PV expansion, capacity additions, and utility-scale and small-scale growth, per EIA.


Key Points

It was the year U.S. solar electricity exceeded biomass, hitting 77 million MWh and trailing only hydro and wind.

✅ Solar: 77 million MWh; Biomass: 64 million MWh (2017, EIA)

✅ PV expansion; late-year capacity additions dampen annual generation

✅ Hydro: 300 and wind: 254 million MWh; solar thermal ~3 million MWh


Electricity generation from solar resources in the United States reached 77 million megawatthours (MWh) in 2017, surpassing for the first time annual generation from biomass resources, which generated 64 million MWh in 2017. Among renewable sources, only hydro and wind generated more electricity in 2017, at 300 million MWh and 254 million MWh, respectively. Biomass generating capacity has remained relatively unchanged in recent years, while solar generating capacity has consistently grown.

Annual growth in solar generation often lags annual capacity additions because generating capacity tends to be added late in the year. For example, in 2016, 29% of total utility-scale solar generating capacity additions occurred in December, leaving few days for an installed project to contribute to total annual generation despite being counted in annual generating capacity additions. In 2017, December solar additions accounted for 21% of the annual total. Overall, solar technologies operate at lower annual capacity factors and experience more seasonal variation than biomass technologies.

Biomass electricity generation comes from multiple fuel sources, such as wood solids (68% of total biomass electricity generation in 2017), landfill gas (17%), municipal solid waste (11%), and other biogenic and nonbiogenic materials (4%).These shares of biomass generation have remained relatively constant in recent years, even as renewables' rise in 2020 across the grid.

Solar can be divided into three types: solar thermal, which converts sunlight to steam to produce power; large-scale solar photovoltaic (PV), which uses PV cells to directly produce electricity from sunlight; and small-scale solar, which are PV installations of 1 megawatt or smaller. Generation from solar thermal sources has remained relatively flat in recent years, at about 3 million MWh, even as renewables surpassed coal in 2022 nationwide. The most recent addition of solar thermal capacity was the Crescent Dunes Solar Energy plant installed in Nevada in 2015, and currently no solar thermal generators are under construction in the United States.

Solar photovoltaic systems, however, have consistently grown in recent years, as indicated by 2022 U.S. solar growth metrics across the sector. In 2014, large-scale solar PV systems generated 15 million MWh, and small-scale PV systems generated 11 million MWh. By 2017, annual electricity from those sources had increased to 50 million MWh and 24 million MWh, respectively, with projections that solar could reach 20% by 2050 in the U.S. mix. By the end of 2018, EIA expects an additional 5,067 MW of large-scale PV to come online, according to EIA’s Preliminary Monthly Electric Generator Inventory, with solar and storage momentum expected to accelerate. Information about planned small-scale PV systems (one megawatt and below) is not collected in that survey.


Related News

View more

Electric Motor Testing Training

Electric Motor Testing Training covers on-line and off-line diagnostics, predictive maintenance, condition monitoring, failure analysis, and reliability practices to reduce downtime, optimize energy efficiency, and extend motor life in industrial facilities.


Key Points

An instructor-led course teaching on-line/off-line tests to diagnose failures, improve reliability, and cut downtime.

✅ On-line and off-line test methods and tools

✅ Failure modes, root cause analysis, and KPIs

✅ Predictive maintenance, condition monitoring, ROI


Our 12-Hour Electric Motor Testing Training live online instructor-led course introduces students to the basics of on-line and off-line motor testing techniques, with context from VFD drive training principles applicable to diagnostics.

September 10-11 , 2020 - 10:00 am - 4:30 pm ET

Our course teaches students the leading cause of motor failure. Electric motors fail. That is a certainty. And unexpectded motor failures cost a company hundreds of thousands of dollars. Learn the techniques and obtain valuable information to detect motor problems prior to failure, avoiding costly downtime, with awareness of lightning protection systems training that complements plant surge mitigation. This course focuses electric motor maintence professionals to achieve results from electrical motor testing that will optimize their plant and shop operations.

Our comprehensive Electric Motor Testing course emphasizes basic and advanced information about electric motor testing equipment and procedures, along with grounding practices per NEC 250 for safety and compliance. When completed, students will have the ability to learn electric motor testing techniques that results in increased electric motor reliability. This always leads to an increase in overall plant efficiency while at the same time decreasing costly motor repairs.

Students will also learn how to acquire motor test results that result in fact-based, proper motor maintenance management. Students will understand the reasons that electric motors fail, including grounding deficiencies highlighted in grounding guidelines for disaster prevention, and how to find problems quickly and return motors to service.


COURSE OBJECTIVE:

This course is designed to enable participants to:

  • Describe Various Equipment Used For Motor Testing And Maintenance.
  • Recognize The Cause And Source Of Electric Motor Problems, including storm-related hazards described in electrical safety tips for seasonal preparedness.
  • Explain How To Solve Existing And Potential Motor Problems, integrating substation maintenance practices to reduce upstream disruptions, Thereby Minimizing Equipment Disoperation And Process Downtime.
  • Analyze Types Of Motor Loads And Their Energy Efficiency Considerations, including insights relevant to hydroelectric projects in utility settings.


Complete Course Details Here

https://electricityforum.com/electrical-training/motor-testing-training


Related News

View more

Electricity Prices in France Turn Negative

Negative Electricity Prices in France signal oversupply from wind and solar, stressing the wholesale market and grid. Better storage, demand response, and interconnections help balance renewables and stabilize prices today.


Key Points

They occur when renewable output exceeds demand, pushing power prices below zero as excess energy strains the grid.

✅ Driven by wind and solar surges with low demand

✅ Challenges thermal plants; erodes margins at negative prices

✅ Needs storage, demand response, and cross-border interties


France has recently experienced an unusual and unprecedented situation in its electricity market: negative electricity prices. This development, driven by a significant influx of renewable energy sources, highlights the evolving dynamics of energy markets as countries increasingly rely on clean energy technologies. The phenomenon of negative pricing reflects both the opportunities and renewable curtailment challenges associated with the integration of renewable energy into national grids.

Negative electricity prices occur when the supply of electricity exceeds demand to such an extent that producers are willing to pay consumers to take the excess energy off their hands. This situation typically arises during periods of high renewable energy generation coupled with low energy demand. In France, this has been driven primarily by a surge in wind and solar power production, which has overwhelmed the grid and created an oversupply of electricity.

The recent surge in renewable energy generation can be attributed to a combination of favorable weather conditions and increased capacity from new renewable energy installations. France has been investing heavily in wind and solar energy as part of its commitment to reducing greenhouse gas emissions and transitioning towards a more sustainable energy system, in line with renewables surpassing fossil fuels in Europe in recent years. While these investments are essential for achieving long-term climate goals, they have also led to challenges in managing energy supply and demand in the short term.

One of the key factors contributing to the negative prices is the variability of renewable energy sources. Wind and solar power are intermittent by nature, meaning their output can fluctuate significantly depending on weather conditions, with solar reshaping price patterns in Northern Europe as deployment grows. During times of high wind or intense sunshine, the electricity generated can far exceed the immediate demand, leading to an oversupply. When the grid is unable to store or export this excess energy, prices can drop below zero as producers seek to offload the surplus.

The impact of negative prices on the energy market is multifaceted. For consumers, negative prices can lead to lower energy costs as wholesale electricity prices fall during oversupply, and even potential credits or payments from energy providers. This can be a welcome relief for households and businesses facing high energy bills. However, negative prices can also create financial challenges for energy producers, particularly those relying on conventional power generation methods. Fossil fuel and nuclear power plants, which have higher operating costs, may struggle to compete when prices are negative, potentially affecting their profitability and operational stability.

The phenomenon also underscores the need for enhanced energy storage and grid management solutions. Excess energy generated from renewable sources needs to be stored or redirected to maintain grid stability and avoid negative pricing situations. Advances in battery storage technology, such as France's largest battery storage platform, and improvements in grid infrastructure are essential to addressing these challenges and optimizing the integration of renewable energy into the grid. By developing more efficient storage solutions and expanding grid capacity, France can better manage fluctuations in renewable energy production and reduce the likelihood of negative prices.

France's experience with negative electricity prices is part of a broader trend observed in other countries with high levels of renewable energy penetration. Similar situations have occurred in Germany, where solar plus storage is now cheaper than conventional power, the United States, and other regions where renewable energy capacity is rapidly expanding. These instances highlight the growing pains associated with transitioning to a cleaner energy system and the need for innovative solutions to balance supply and demand.

The French government and energy regulators are closely monitoring the situation and exploring measures to mitigate the impact of negative prices. Policy adjustments, market reforms, and investments in energy infrastructure are all potential strategies to address the challenges posed by high renewable energy generation. Additionally, encouraging the development of flexible demand response programs and enhancing grid interconnections with neighboring countries can help manage excess energy and stabilize prices.

In the long term, the rise of renewable energy and the occurrence of negative prices represent a positive development for the energy transition. They indicate progress towards cleaner energy sources and a more sustainable energy system. However, managing the associated challenges is crucial for ensuring that the transition is smooth and economically viable for all stakeholders involved.

In conclusion, the recent instance of negative electricity prices in France highlights the complexities of integrating renewable energy into the national grid. While the phenomenon reflects the success of France’s efforts to expand its renewable energy capacity, it also underscores the need for advanced grid management and storage solutions. As the country continues to navigate the transition to a more sustainable energy system, addressing these challenges will be essential for maintaining a stable and efficient energy market. The experience serves as a valuable lesson for other nations undergoing similar transitions and reinforces the importance of innovation and adaptability in the evolving energy landscape.


Related News

View more

Climate change: Greenhouse gas concentrations again break records

Rising Greenhouse Gas Concentrations drive climate change, with CO2, methane, and nitrous oxide surging; WMO data show higher radiative forcing, elevated pre-industrial baselines, and persistent atmospheric concentrations despite Paris Agreement emissions pledges.


Key Points

Increasing atmospheric CO2, methane, and nitrous oxide levels that raise radiative forcing and drive warming.

✅ WMO data show CO2 at 407.8 ppm in 2018, above decade average

✅ Methane and nitrous oxide surged, elevating total radiative forcing

✅ Concentrations differ from emissions; sinks absorb about half


The World Meteorological Organization (WMO) says the increase in CO2 was just above the average rise recorded over the last decade.

Levels of other warming gases, such as methane and nitrous oxide, have also surged by above average amounts.

Since 1990 there's been an increase of 43% in the warming effect on the climate of long lived greenhouse gases.

The WMO report looks at concentrations of warming gases in the atmosphere rather than just emissions.

The difference between the two is that emissions refer to the amount of gases that go up into the atmosphere from the use of fossil fuels, such as burning coal for coal-fired electricity generation and from deforestation.

Concentrations are what's left in the air after a complex series of interactions between the atmosphere, the oceans, the forests and the land. About a quarter of all carbon emissions are absorbed by the seas, and a similar amount by land and trees, while technologies like carbon capture are being explored to remove CO2.

Using data from monitoring stations in the Arctic and all over the world, researchers say that in 2018 concentrations of CO2 reached 407.8 parts per million (ppm), up from 405.5ppm a year previously.

This increase was above the average for the last 10 years and is 147% of the "pre-industrial" level in 1750.

The WMO also records concentrations of other warming gases, including methane and nitrous oxide, and some countries have reported declines in certain potent gases, as noted in US greenhouse gas controls reports, though global levels remain elevated. About 40% of the methane emitted into the air comes from natural sources, such as wetlands, with 60% from human activities, including cattle farming, rice cultivation and landfill dumps.

Methane is now at 259% of the pre-industrial level and the increase seen over the past year was higher than both the previous annual rate and the average over the past 10 years.

Nitrous oxide is emitted from natural and human sources, including from the oceans and from fertiliser-use in farming. According to the WMO, it is now at 123% of the levels that existed in 1750.

Last year's increase in concentrations of the gas, which can also harm the ozone layer, was bigger than the previous 12 months and higher than the average of the past decade.

What concerns scientists is the overall warming impact of all these increasing concentrations. Known as total radiative forcing, this effect has increased by 43% since 1990, and is not showing any indication of stopping.

There is no sign of a slowdown, let alone a decline, in greenhouse gases concentration in the atmosphere despite all the commitments under the Paris agreement on climate change and the ongoing global energy transition efforts," said WMO Secretary-General Petteri Taalas.

"We need to translate the commitments into action and increase the level of ambition for the sake of the future welfare of mankind," he added.

"It is worth recalling that the last time the Earth experienced a comparable concentration of CO2 was three to five million years ago. Back then, the temperature was 2-3C warmer, sea level was 10-20m higher than now," said Mr Taalas.

The UN Environment Programme will report shortly on the gap between what actions countries are taking to cut carbon, for example where Australia's emissions rose 2% recently, and what needs to be done to keep under the temperature targets agreed in the Paris climate pact.

Preliminary findings from this study, published during the UN Secretary General's special climate summit last September, indicated that emissions continued to rise during 2018, although global emissions flatlined in 2019 according to the IEA.

Both reports will help inform delegates from almost 200 countries who will meet in Madrid next week for COP25, following COP24 in Katowice the previous year, the annual round of international climate talks.


Related News

View more

Can COVID-19 accelerate funding for access to electricity?

Africa Energy Access Funding faces disbursement bottlenecks as SDG 7 goals demand investment in decentralized solar, minigrids, and rural electrification; COVID-19 pressures donors, requiring faster approvals, standardized documentation, and stronger project preparation and due diligence.


Key Points

Financing to expand Africa's electrification, advancing SDG 7 via disbursement to decentralized solar and minigrids.

✅ Accelerates investment for SDG 7 and rural electrification

✅ Prioritizes decentralized solar, minigrids, and utilities

✅ Speeds approvals, standard docs, and project preparation


The time frame from final funding approval to disbursement can be the most painful part of any financing process, and the access-to-electricity sector is not spared.

Amid the global spread of the coronavirus over the last few weeks, there have been several funding pledges to promote access to electricity in Africa. In March, the African Development Bank and other partners committed $160 million for the Facility for Energy Inclusion to boost electricity connectivity in Africa through small-scale solar systems and minigrids. Similarly, the Export-Import Bank of the United States allocated $91.5 million for rural electrification in Senegal.

Rockefeller chief wants to redefine 'energy poverty'

Rajiv Shah, president of The Rockefeller Foundation, believes that SDG 7 on energy access lacks ambition. He hopes to drive an effort to redefine it.

Currently, funding is not being adequately deployed to help achieve universal access to energy. The International Energy Agency’s “Africa Energy Outlook 2019” report estimated that an almost fourfold increase in current annual access-to-electricity investments — approximately $120 billion a year over the next 20 years — is required to provide universal access to electricity for the 530 million people in Africa that still lack it.

While decentralized renewable energy across communities, particularly solar, has been instrumental in serving the hardest-to-reach populations, tracking done by Sustainable Energy for All — in the 20 countries with about 80% of those living without access to sustainable energy — suggests that decentralized solar received only 1.2% of the total electricity funding.

The spread of COVID-19 is contributing significantly to Africa’s electricity challenges across the region, creating a surge in the demand for energy from the very important health facilities, an exponential increase in daytime demand as a result of most people staying and working indoors, and a rise from some food processing companies that have scaled up their business operations to help safeguard food security, among others. Thankfully — and rightly so — access-to-electricity providers are increasingly being recognized as “essential service” providers amid the lockdowns across cities.

To start tackling Africa’s electricity challenges more effectively, “funding-ready” energy providers must be able to access and fulfill the required conditions to draw down on the already pledged funding. What qualifies as “funding readiness” is open to argument, but having a clear, commercially viable business and revenue model that is suitable for the target market is imperative.

Developing the skills required to navigate the due-diligence process and put together relevant project documents is critical and sometimes challenging for companies without prior experience. Typically, the final form of all project-related agreements is a prerequisite for the final funding approval.

In addition, having the right internal structures in place — for example, controls to prevent revenue leakage, an experienced management team, a credible board of directors, and meeting relevant regulatory requirements such as obtaining permits and licenses — are also important indicators of funding readiness.

1. Support for project preparation. Programs — such as the Private Financing Advisory Network and GET.invest’s COVID-19 window — that provide business coaching to energy project developers are key to helping surmount these hurdles and to increasing the chances of these projects securing funding or investment. Donor funding and technical-assistance facilities should target such programs.

2. Project development funds. Equity for project development is crucial but difficult to attract. Special funds to meet this need are essential, such as the $760,000 for the development of small-scale renewable energy projects across sub-Saharan Africa recently approved by the African Development Bank-managed Sustainable Energy Fund for Africa.

3. Standardized investment documentation. Even when funding-ready energy project developers have secured investors, delays in fulfilling the typical preconditions to draw down funds have been a major concern. This is a good time for investors to strengthen their technical assistance by supporting the standardization of approval documents and funding agreements across the energy sector to fast-track the disbursement of funds.

4. Bundled investment approvals and more frequent approval sessions. While we implement mechanisms to hasten the drawdown of already pledged funding, there is no better time to accelerate decision-making for new access-to-electricity funding to ensure we are better prepared to weather the next storm. Donors and investors should review their processes to be more flexible and allow for more frequent meetings of investment committees and boards to approve transactions. Transaction reviews and approvals can also be conducted for bundled projects to reduce transaction costs.

5. Strengthened local capacity. African countries must also commit to strengthening the local manufacturing and technical capacity for access-to-electricity components through fiscal incentives such as extended tax holidays, value-added-tax exemptions, accelerated capital allowances, and increased investment allowances.

The ongoing pandemic and resulting impacts due to lack of electricity have further shown the need to increase the pace of implementation of access-to-electricity projects. We know that some of the required capital exists, and much more is needed to achieve Sustainable Development Goal 7 — about access to affordable and clean energy for all — by 2030.

It is time to accelerate our support for access-to-electricity companies and equip them to draw down on pledged funding, while calling on donors and investors to speed up their funding processes to ensure the electricity gets to those most in need.


Related News

View more

Substation Maintenance Training

Substation Maintenance Training delivers live online instruction on testing switchgear, circuit breakers, transformers, protective relays, batteries, and SCADA systems, covering safety procedures, condition assessment, predictive maintenance, and compliance for utility substations.


Key Points

A live online course on testing and maintaining substation switchgear, breakers, transformers, relays, and batteries.

✅ Live instructor-led, 12-hour web-based training

✅ Covers testing: insulation resistance, contact resistance, TLI

✅ Includes 7 days of post-course email mentoring


Our Substation Maintenance Training course is a 12-Hour Live online instruction-led course that will cover the maintenance and testing requirements for common substation facilities, and complements VFD drive training for professionals managing motor control systems.

Electrical Transformer Maintenance Training

Substation Maintenance Training

Request a Free Training Quotation

Electrical Substation maintenance is a key component of any substation owner's electrical maintenance program. It has been well documented that failures in key procedures such as racking mechanisms, meters, relays and busses are among the most common source of unplanned outages. Electrical transmission, distribution and switching substations, as seen in BC Hydro's Site C transmission line work milestone, generally have switching, protection and control equipment and one or more transformers.Our electrical substation maintenance course focuses on maintenance and testing of switchgear, circuit breakers, batteries and protective relays.

This Substation Maintenance Training course will cover the maintenance and testing requirements for common substation devices, including power transformers, oil, air and vacuum circuit breakers, switchgear, ground grid systems aligned with NEC 250 grounding and bonding guidance, batteries, chargers and insulating liquids. This course focuses on what to do, when to do it and how to interpret the results from testing and maintenance. This Substation Maintenance course will deal with all of these important issues.

You Can Access The Live Online Training Through Our Web-Based Platform From Your Own Computer. You Can See And Hear The Instructor And See His Screen Live.

You Can Interact And Ask Questions, similar to our motor testing training sessions delivered online. The Cost Of The Training Also Includes 7 Days Of Email Mentoring With The Instructor.


LEARNING OBJECTIVES

  • Substation Types, Applications, Components And lightning protection systems safety procedures
  • Maintenance And Testing Methods For Medium-Voltage Circuit Breakers
  • How To Perform Insulation Resistance, Contact Resistance On Air, Oil And Vacuum Breakers, And Tank Loss Index On Oil Circuit Breaker And Vacuum Bottle Integrity Tests On Vacuum Breaker
  • Switchgear Arrangement, Torque Requirements, Insulation Systems, grounding guidelines And Maintenance Intervals
  • How To Perform Switchgear Inspection And Maintenance


WHO SHOULD ATTEND

This course is designed for engineering project managers, engineers, and technicians from utilities who have built or are considering building or retrofitting substations or distribution systems with SCADA and substation integration and automation equipment, and for teams focused on electrical storm safety in the field.

Complete Course Details Here:

https://electricityforum.com/electrical-training/substation-maintenance-training


Related News

View more

Sign Up for Electricity Forum’s Newsletter

Stay informed with our FREE Newsletter — get the latest news, breakthrough technologies, and expert insights, delivered straight to your inbox.

Electricity Today T&D Magazine Subscribe for FREE

Stay informed with the latest T&D policies and technologies.
  • Timely insights from industry experts
  • Practical solutions T&D engineers
  • Free access to every issue

Download the 2025 Electrical Training Catalog

Explore 50+ live, expert-led electrical training courses –

  • Interactive
  • Flexible
  • CEU-cerified