Alberta Hydropower Potential highlights renewable energy, dams, reservoirs, grid flexibility, contrasting wind and solar growth with limited investment, regulatory hurdles, river basin resources, and decarbonization pathways across Athabasca, Peace, and Slave River systems.
Key Points
It is the technical capacity for new hydro in Alberta's river basins to support a more reliable, lower carbon grid.
✅ 42,000 GWh per year developable hydro identified in studies.
✅ Major potential in Athabasca, Peace, and Slave River basins.
✅ Barriers include high capital costs, market design, water rights.
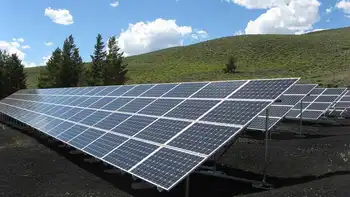
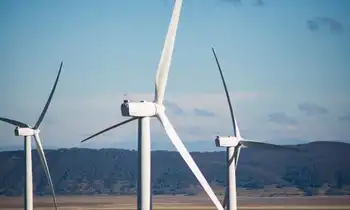
When you think about renewable energy sources on the Prairies, your mind may go to the wind farms in southern Alberta, or even the Travers Solar Project, southeast of Calgary.
Most of the conversation around renewable energy in the province is dominated by advancements in solar and wind power, amid Alberta's renewable energy surge that continues to attract attention.
But what about Canada's main source of electricity — hydro power?
More than half of Canada's electricity is generated from hydro sources, with 632.2 terawatt-hours produced as of 2019. That makes it the fourth largest installed capacity of hydropower in the world.
But in Alberta, it's a different story.
Currently, hydro power contributes between three and five per cent of Alberta's energy mix, while fossil fuels make up about 89 per cent.
According to Canada's Energy Future report from the Canada Energy Regulator, by 2050 it will make up two per cent of the province's electricity generation shares.
So why is it that a province so rich in mountains and rivers has so little hydro power?
Hydro's history in Alberta
Hydro power didn't always make up such a small sliver of Alberta's electricity generation. Hydro installations began in the early 20th century as the province's population exploded.
Grant Berg looks after engineering for hydro for TransAlta, Alberta's largest producer of hydro power with 17 facilities across the province.
"Our first plant was Horseshoe, which started in 1911 that we formed as Calgary Power," he said.
"It was really in response to the City of Calgary growing and having some power needs."
Berg said in 1913, TransAlta's second installation, the Kananaskis Plant, started as Calgary continued to grow.
A historical photo of a hydro-electric dam in Kananaskis Alta. taken in 1914.
Hydro power plant in Kananaskis as seen in 1914. (Glenbow Archives)
Some bigger installations were built in the 1920s, including Ghost reservoir, but by mid-century population growth increased.
"Quite a large build out really, I think in response to the growth in Alberta following the war. So through the 1950s really quite a large build out of hydro from there."
By the 1950s, around half of the province's installed capacity was hydro power.
"Definitely Calgary power was all hydro until the 1950s," said Berg.
Hydro potential in the province
Despite the current low numbers in hydroelectricity, Alberta does have potential.
According to a 2010 study, there is approximately 42,000 gigawatt-hours per year of remaining developable hydroelectric energy potential at identified sites.
An average home in Alberta uses around 7,200 kilowatt-hours of electricity per year, meaning that the hydro potential could power 5.8 million homes each year.
"This volume of energy could be sufficient to serve a significant amount of Alberta's load and therefore play a meaningful role in the decarbonization of the province's electric system," the Alberta Electric System Operator said in its 2022 Pathways to Net-Zero Emissions report.
Much of that potential lies in northern Alberta, in the Athabasca, Peace and Slave River basins.
The AESO report says that despite the large resource potential, Alberta's energy-only market framework has attracted limited investment in hydroelectric generation.
Hydro power was once a big deal in Alberta, but investment in the industry has been in decline since the 1950s. Climate change reporter Christy Climenhaga explains why.
So why does Alberta leave out such a large resource potential on the path to net zero?
The government of Alberta responded to that question in a statement.
"Hydro facilities, particularly large scale ones involving dams, are associated with high costs and logistical demands," said the Ministry of Affordability and Utilities.
"Downstream water rights for other uses, such as irrigation, further complicate the development of hydro projects."
The ministry went on to say that wind and solar projects have increased far more rapidly because they can be developed at relatively lower cost and shorter timelines, and with fewer logistical demands.
"Sources from wind power and solar are increasingly more competitive," said Jean-Denis Charlebois, chief economist with the Canadian Energy Regulator.
Hydro on the path to net zero
Hydro power is incredibly important to Canada's grid, and will remain so, despite growth in wind and solar power across the province.
Charlebois said that across Canada, the energy make-up will depend on the province.
"Canadian provinces will generate electricity in very different ways from coast to coast. The major drivers are essentially geography," he said.
Charlebois says that in British Columbia, Manitoba, Quebec and Newfoundland and Labrador, hydropower generation will continue to make up the majority of the grid.
"In Alberta and Saskatchewan, we see a fair bit of potential for wind and solar expansion in the region, which is not necessarily the case on Canada's coastlines," he said.
And although hydro is renewable, it does bring its adverse effects to the environment — land use changes, changes in flow patterns, fish populations and ecosystems, which will have to be continually monitored.
"You want to be able to manage downstream effects; make sure that you're doing all the proper things for the environment," said Ryan Braden, director of mining and hydro at TransAlta.
Braden said hydro power still has a part to play in Alberta, even with its smaller contributions to the future grid.
"It's one of those things that, you know, the wind doesn't blow or the sun doesn't shine, this is here. The way we manage it, we can really support that supply and demand," he said.
Related News