NFPA 70b Training - Electrical Maintenance
Our customized live online or in‑person group training can be delivered to your staff at your location.

- Live Online
- 12 hours Instructor-led
- Group Training Available
Regular Price:
$699
Coupon Price:
$599
WASHINGTON
—
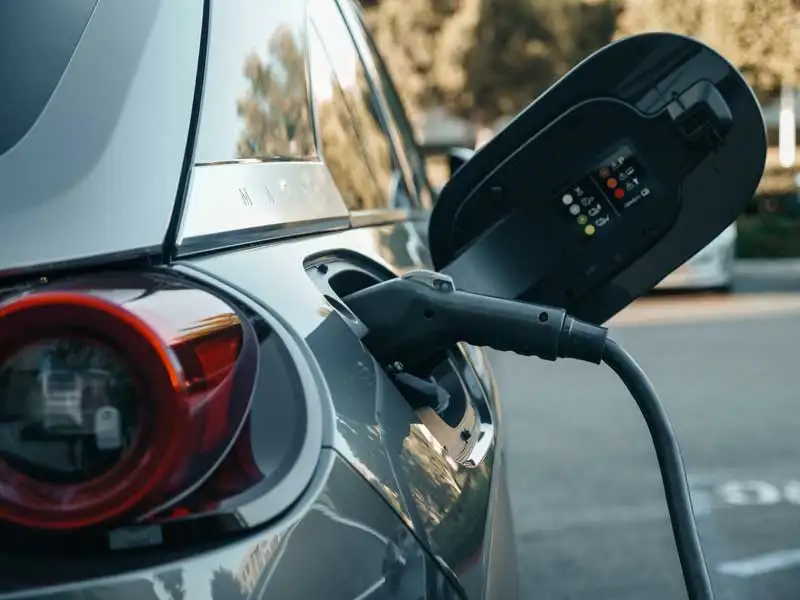
U.S. EV Sales Growth reflects rising consumer demand, expanding market share, new tax credits, and robust charging infrastructure, as automakers boost output and quarterly sales under the Inflation Reduction Act drive adoption across states.
The Latest Developments
It is the rise in U.S. EV sales and market share, driven by incentives, charging growth, and automaker investment.
Annual U.S. EV sales topped 1M by Q3 2023, up 58% YoY
EV share exceeded 10% of new light-duty sales in Q3 2023
California neared 27% EV sales share through Sep 2023
IRA credits and charger buildout to boost affordability and access
Contrary to any skepticism, the demand for electric vehicles (EVs) in the United States is not dwindling. Data from the Alliance for Automotive Innovation highlights a significant and ongoing increase in EV sales from 2021 through the third quarter of 2023. An upward trend in quarterly sales (depicted as bars on the left axis) and EV sales shares (illustrated by the red line on the right axis) is evident. Sales surged from about 125,000 in Q1 2021 to 185,000 in Q4 2021, and from around 300,000 in Q1 2023 to 375,000 by Q3 2023. Notably, by Q3 2023, annual U.S. EV sales exceeded 1 million for the first time, a milestone often cited as the tipping point for mass adoption in the U.S., marking a 58% increase over the same period in 2022.
EV sales have shown consistent quarterly growth since Q3 2021, and the proportion of EVs in total light-duty vehicle sales is also on the rise. EVs’ share of new sales increased from roughly 3% in Q1 2021 to about 7% in 2022, and further to over 10% in Q3 2023, though they are still behind gas cars in overall market share, for now. For context, according to the U.S. Environmental Protection Agency’s Automotive Trends Report, EVs have reached a 10% market share more quickly than conventional hybrids without a plug, which took about 25 years.
State-level data also indicates that several states exceed national averages in EV sales. California, for example, saw EVs comprising nearly 27% of sales through September 2023, even as a brief Q1 2024 market share dip has been noted nationally. Additionally, 12 states plus the District of Columbia had EV sales shares between 10% and 20% through Q3 2023.
EV sales data by automaker reveal that most companies sold more EVs in Q2 or Q3 2023 than in any previous quarter, mirroring global growth that went from zero to 2 million in five years. Except for Ford, each automaker sold more EVs in the first three quarters of 2023 than in all of 2022. EV sales in Q3 2023 notably increased compared to Q3 2022 for companies like BMW, Tesla, and Volkswagen.
Despite some production scalebacks by Ford and General Motors, these companies, along with others, remain dedicated to an electric future and expect to sell more EVs than ever. The growing consumer interest in EVs is also reflected in recent surveys by McKinsey, J.D. Power, and Consumer Reports, and echoed in Europe where the share of electric cars grew during lockdown months, showing an increasing intent to purchase EVs and a declining interest in gasoline vehicles.
Furthermore, the Inflation Reduction Act of 2022 introduces new tax credits, potentially making EVs more affordable than gasoline counterparts. Investments in charging infrastructure are also expected to increase, especially as EV adoption could drive a 38% rise in U.S. electricity demand, with over $21 billion allocated to boost public chargers from around 160,000 in 2023 to nearly 1 million by 2030.
The shift to EVs is crucial for reducing climate pollution, enhancing public health, and generating economic benefits and jobs, and by 2021 plug-in vehicles had already traveled 19 billion miles on electricity, underscoring real-world progress toward these goals. The current data and trends indicate a robust and positive future for EVs in the U.S., reinforcing the need for strong standards to further encourage investment and consumer confidence in electric vehicles.
Related News
AZ goes EV: Rate of electric car ownership relatively high in Arizona
Arizona Electric Vehicle Ownership is surging, led by EV adoption, charging stations growth, state incentives,…
View more

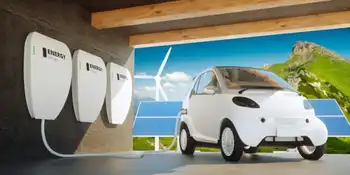
Low-emissions sources are set to cover almost all the growth in global electricity demand in the next three years
IEA Electricity Market Outlook 2023-2025 projects faster demand growth as renewables and nuclear dominate supply,…
View more
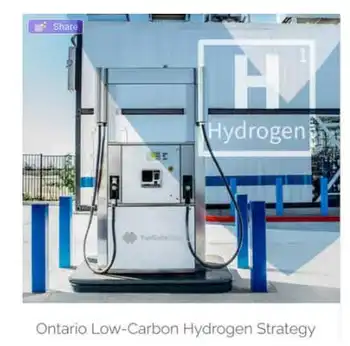
Ontario Launches Hydrogen Innovation Fund
Ontario Hydrogen Innovation Fund accelerates clean electricity integration, hydrogen storage, grid balancing, and electrolyzer pilot…
View more
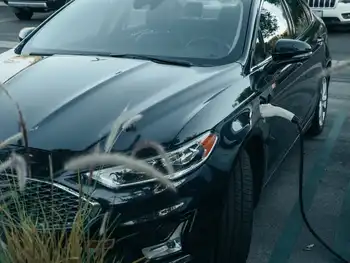
How much does it cost to charge an electric vehicle? Here's what you can expect.
Electric Vehicle Charging Costs and Times explain kWh usage, electricity rates, Level 2 vs DC…
View more
World renewable power on course to shatter more records
Global Renewable Capacity Additions 2023 surge on policy momentum, high fossil prices, and energy security,…
View more

Wind power is Competitive on Reliability and Resilience Says AWEA CEO
Wind farm reliability services now compete in wholesale markets, as FERC and NERC endorse market-based…
View more
Sign Up for Electricity Forum’s Newsletter
Stay informed with our FREE Newsletter — get the latest news, breakthrough technologies, and expert insights, delivered straight to your inbox.
Electricity Today T&D Magazine Subscribe for FREE

Stay informed with the latest T&D policies and technologies.
- Timely insights from industry experts
- Practical solutions T&D engineers
- Free access to every issue
