Hedonistic Sustainability turns Copenhagen's ARC waste-to-energy plant into a public playground, blending ski slope, climbing wall, and trails with carbon-neutral heating, renewables, circular economy design, and green growth for climate action and liveability.
Key Points
A design approach fusing public recreation with clean-energy infrastructure to drive carbon-neutral, livable urban growth.
✅ Waste-to-energy plant doubles as recreation hub
✅ Supports carbon-neutral heating and renewables
✅ Stakeholder-driven, scalable urban climate model
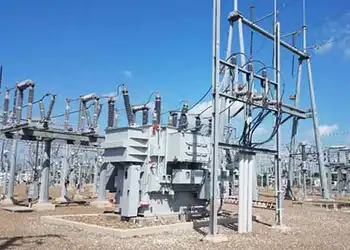
“We call it hedonistic sustainability,” says Jacob Simonsen of the decision to put an artificial ski slope on the roof of the £485m Amager Resource Centre (Arc), Copenhagen’s cutting-edge new waste-to-energy power plant that feeds the city’s district heating network as well. “It’s not just good for the environment, it’s good for life.”
Skiing is just one of the activities that Simonsen, Arc’s chief executive, and Bjarke Ingels, its lead architect, hope will enhance the latest jewel in Copenhagen’s sustainability crown. The incinerator building also incorporates hiking and running trails, a street fitness gym and the world’s highest outdoor climbing wall, an 85-metre “natural mountain” complete with overhangs that rises the full height of the main structure.
In Copenhagen, green transformation goes hand-in-hand with job creation, a growing economy and a better quality of life
Frank Jensen, lord mayor
It’s all part of Copenhagen’s plan to be net carbon-neutral by 2025. Even now, after a summer that saw wildfires ravagethe Arctic Circle and ice sheets in Greenland suffer near-record levels of melt, the goal seems ambitious. In 2009, when the project was formulated, it was positively revolutionary.
“A green, smart, carbon-neutral city,” declared the cover of the climate action plan, aligning with a broader electric planet vision, before detailing the scale of the challenge: 100 new wind turbines; a 20% reduction in both heat and commercial electricity consumption; 75% of all journeys to be by bike, on foot, or by public transport; the biogas-ification of all organic waste; 60,000 sq metres of new solar panels; and 100% of the city’s heating requirements to be met by renewables.
Radical and far-reaching, the scheme dared to rethink the very infrastructure underpinning the city. There’s still not a climate project anywhere else in the world that comes close, even as leaders elsewhere champion a fully renewable grid by 2030.
And, so far, it’s working. CO2 emissions have been reduced by 42% since 2005, and while challenges around mobility and energy consumption remain (new technologies such as better batteries and carbon capture are being implemented, and global calls for clean electricity investment grow), the city says it is on track to achieve its ultimate goal.
More significant still is that Copenhagen has achieved this while continuing to grow in traditional economic terms. Even as some commentators insist that nothing short of a total rethink of free-market economics and corporate structures is required to stave off global catastrophe, the Danish capital’s carbon transformation has happened alongside a 25% growth in its economy over two decades. Copenhagen’s experience will be a model for other world cities as the global energy transition unfolds.
The sentiment that lies behind Arc’s conception as a multi-use public good – “hedonistic sustainability” – is echoed by Bo Asmus Kjeldgaard, former mayor of Copenhagen for the environment and the man originally tasked, back in 2010, with making the plan a reality.
“We combined life quality with sustainability and called it ‘liveability’,” says Kjeldgaard, now CEO of his own climate adaptation company, Greenovation. “We succeeded in building a good narrative around this, one that everybody could believe in.”
The idea was first floated in the late 1990s, when the newly elected Kjeldgaard had a vision of Copenhagen as the environmental capital of Europe. His enthusiasm ran into political intransigence, however, and despite some success, a lack of budget meant most of his work became “just another branding exercise – it was greenwashing”.
We’re such a rich country – change should be easy for us
Claus Nielsen, furniture maker and designer
But after stints as mayor of family and the labour market, and children and young people, he ended up back at environment in 2010 with renewed determination and, crucially, a broader mandate from the city council. “I said: ‘This time, we have to do it right,’” he recalls, “so we made detailed, concrete plans for every area, set the carbon target, and demanded the money and the manpower to make it a reality.”
He brought on board more than 200 stakeholders, from businesses to academia to citizen representatives, and helped them develop 22 specific business plans and 65 separate projects. So far the plan appears on track: there has been a 15% reduction in heat consumption, 66% of all trips in the city are now by bike, on foot or public transport, and 51% of heat and power comes from renewable electricity sources.
The onus placed on ordinary Copenhageners to walk and cycle more, pay higher taxes (especially on cars) and put up with the inconvenience of infrastructure construction has generally been met with understanding and good grace. And while some people remain critical of the fact that Copenhagen airport is not factored into the CO2 calculations – it lies beyond the city’s boundaries – and grumble about precise definitions and formulae, dissent has been rare.
This relative lack of nimbyism and carping about change can, says Frank Jensen, the city’s lord mayor, be traced to longstanding political traditions.
“Caring for the environment and taking responsibility for society in general has been an integral part of the upbringing of many Danes,” he says. “Moreover, there is a general awareness that climate change now calls for immediate, ambitious and collective action.” A 2018 survey by Concito, a thinktank, found that such action was a top priority for voters.
Jensen is keen to stress the cooperative nature of the plan and says “our visions have to be grounded in the everyday lives of people to be politically feasible”. Indeed, involving so many stakeholders, and allowing them to actively help shape both the ends and the means, has been key to the plan’s success so far and the continued goodwill it enjoys. “It’s so important to note that we [the authorities] cannot do this alone,” says Jørgen Abildgaard, Copenhagen’s executive climate programme director.
Many businesses around the world have typically been reluctant to embrace sustainability when a dip in profits or inconvenience might be the result, but not in Copenhagen. Martin Manthorpe, director of strategy, business development and public affairs at NCC, one of Scandinavia’s largest construction and industrial groups, was brought in early on by Abildgaard to represent industry on the municipality’s climate panel, and to facilitate discussions with the wider business community. He thinks there are several reasons why.
“The Danes have a trading mindset, meaning ‘What will I have to sell tomorrow?’ is just as important as ‘What am I producing today?’” he says. “Also, many big Danish companies are still ultimately family-owned, so the culture leans more towards long-term thinking.”
It is, he says, natural for business to be concerned with issues around sustainability and be willing to endure short-term pain: “To do responsible, long-term business, you need to see yourself as part of the larger puzzle that is called ‘society’.”
Furthermore, in Denmark climate change denial is given extremely short shrift. “We believe in the science,” says Anders Haugaard, a local entrepreneur. “Why wouldn’t you? We’re told sustainability brings only benefits and we’ve got no reason to be suspicious.”
“No one would dare argue against the environment,” says his friend Claus Nielsen, a furniture maker and designer. “We’re such a rich country – change should be easy for us.” Nielsen talks about how enlightened his kids are – “my 11-year-old daughter is now a flexitarian ” – and says that nowadays he mainly buys organic; Haugaard doesn’t see a problem with getting rid of petrol cars (the whole country is aiming to be fossil fuel-free by 2050 as the EU electricity use by 2050 is expected to double).
Above all, there’s a belief that sustainability need not make the city poorer: that innovation and “green growth” can be lucrative in and of themselves. “In Copenhagen, green transformation goes hand-in-hand with job creation, a growing economy and a better quality of life,” says Jensen. “We have also shown that it’s possible to combine this transition with economic growth and market opportunities for businesses, and I think that other countries can learn from our example.”
Besides, as Jensen notes, there is little alternative, and even less time: “National states have failed to take enough responsibility, but cities have the power and will to create concrete solutions. We need to start accelerating their implementation – we need to act now.”
Related News