Freedom Cannabis solar array powers an Acheson cannabis facility with 4,574 rooftop panels, a 1,830-kilowatt system by Enmax, cutting greenhouse gas emissions, lowering energy costs, and advancing renewable energy, sustainability, and operational efficiency in Edmonton.
Key Points
A 1,830-kW rooftop solar system with 4,574 panels, cutting GHG emissions and energy costs at the Acheson facility.
✅ 1,830-kW array offsets 1,000+ tonnes GHG annually
✅ Supplies ~8% of annual power; saves $200k-$300k per year
✅ 4,574 rooftop panels installed by Enmax in Acheson
Electricity consumption is one of the biggest barriers to going green in the cannabis industry, where the energy demands of cannabis cultivation often complicate sustainability, but an Edmonton-area pot producer has come up with a sunny solution.
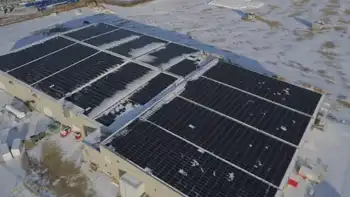
Freedom Cannabis unveiled the largest rooftop solar system used by a cannabis facility in Canada at its 126,000-square foot Acheson location, 20 kilometres west of Edmonton, as solar power in Alberta continues to surge, on Tuesday.
The "state-of-the-art" 1,830-kilowatt solar array—made up of 4,574 panels—was supplied by Enmax and will offset more than 1,000 tonnes of greenhouse gas emissions each year, reflecting how new Alberta solar facilities are undercutting natural gas on price, the company said.
The state-of-the-art solar array—made up of 4,574 panels—was supplied by Enmax and will offset more than 1,000 tonnes of greenhouse gas emissions at Freedom Cannabis every year. Nov. 12, 2019. (Freedom Cannabis)
That will supply roughly eight per cent of the building's annual power consumption and reduce costs by $200,000 to $300,000 annually.
"This strategy will supplement our operating costs for power by up to eight to 10 per cent, so it is something that in time will save us costs on power requirements," said Troy Dezwart, co-founder of Freedom Cannabis.
Dezwart said sustainability was an important issue to the company from its outset, aligning with an Alberta renewable energy surge that is expected to power thousands of jobs.
"We're fortunate enough to be able to have these types of options and pursue them," said Dezwart.
The entire system cost Freedom Cannabis $2.6 million to build, but nearly a million of that came from a provincial rebate program that has since been cancelled by the UCP government, even as a federal green electricity deal with an Edmonton company signals ongoing support.
The company cited a 2017 report that found cannabis growers in the U.S. used enough electricity to power 1.7-million homes, and said cannabis-related power consumption is expected to increase by 1,250 per cent in Ontario over the next five years, even though Canadian solar demand has been lagging overall.
“It’s more important than ever for businesses to manage their energy footprint, and solar is an important part of that solution,” Enmax director Jason Atkinson, said. “This solar installation will help reduce operating costs and offset a significant portion of GHG emissions for decades to come.”
Freedom says it has other initiatives underway to reduce its footprint, in a region planning the Edmonton airport solar farm among other projects, including water remediation and offering 100 per cent recyclable cannabis packaging tins.
The company's first crops are expected to go to market in December.
Related News