Power outages disrupt life in India

By San Francisco Chronicle


NFPA 70e Training

Our customized live online or in‑person group training can be delivered to your staff at your location.

  • Live Online
  • 6 hours Instructor-led
  • Group Training Available
Regular Price:
$199
Coupon Price:
$149
Reserve Your Seat Today
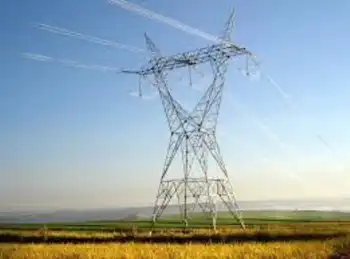
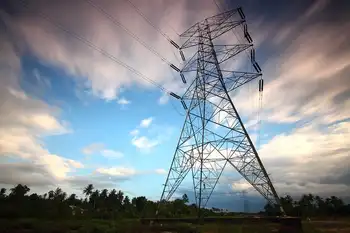
Two 12-hour-long power blackouts shut factories and businesses, disrupted trains and left millions of people without power in and around India's capital recently.

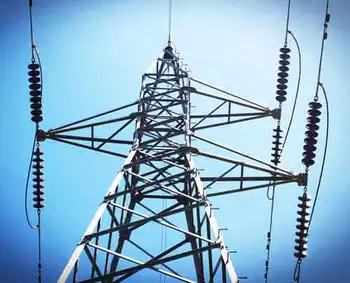
The outages on March 8 and 9 in New Delhi and several neighboring states were blamed on heavy fog and pollution that settled on transmission lines, tripping them when their insulation proved insufficient to handle the conditions, said Shailendra Dubey, chief engineer of the state-run Uttar Pradesh Power Corporation.

Dozens of trains came to a standstill or ran behind schedule, said Amrish Saxena, a railroad official in Lucknow, the capital of Uttar Pradesh state.

Federal Power Secretary Anil Razdan ordered replacement of conventional insulators with polymer insulators in transmission lines to prevent collapse of the power supply in the region, the Hindustan Times newspaper reported.

India faces regular power shortages, particularly in the hot summers when demand rises, sometimes outstripping supply by 25 percent.

Despite more than a decade of rapid economic growth, India's infrastructure still lags far behind, particularly the energy sector needed to fuel the economy, raising concerns it could slow further development.

India needs to build hundreds of new power plants over the next five years to end the massive electricity shortages that threaten the country's rapid economic growth rate.

The government has set a target of generating at least 200,000 megawatts of power by 2012. Currently, the country has a total capacity to produce 130,000 megawatts.

The power sector in the country is mostly run by state governments, which have been slow in adding new capacities because of lack of funds. Although the sector was opened to private capital more than a decade ago, few companies have invested in building new plants because of regulatory bottlenecks.

Currently, 30 to 45 percent of electricity produced in many states is lost in transmission and distribution, according to government figures.

Related News

Electric cars will challenge state power grids

Electric Vehicle Grid Integration aligns EV charging with grid capacity using smart charging, time-of-use rates, V2G, and demand response to reduce peak load, enable renewable energy, and optimize infrastructure planning.


Key Points

Aligning EV charging with grid needs via smart charging, TOU pricing, and V2G to balance load and support renewables.

✅ Time-of-use rates shift charging to off-peak hours

✅ Smart charging responds to real-time grid signals

✅ V2G turns fleets into distributed energy storage


When Seattle City Light unveiled five new electric vehicle charging stations last month in an industrial neighborhood south of downtown, the electric utility wasn't just offering a new spot for drivers to fuel up. It also was creating a way for the service to figure out how much more power it might need as electric vehicles catch on.

Seattle aims to have nearly a third of its residents driving electric vehicles by 2030. Washington state is No. 3 in the nation in per capita adoption of plug-in cars, behind California and Hawaii. But as Washington and other states urge their residents to buy electric vehicles — a crucial component of efforts to reduce carbon emissions — they also need to make sure the electric grid can handle it amid an accelerating EV boom nationwide.

The average electric vehicle requires 30 kilowatt hours to travel 100 miles — the same amount of electricity an average American home uses each day to run appliances, computers, lights and heating and air conditioning.

An Energy Department study found that increased electrification across all sectors of the economy could boost national consumption by as much as 38 percent by 2050, in large part because of electric vehicles. The environmental benefit of electric cars depends on the electricity being generated by renewables.

So far, states predict they will be able to sufficiently boost power production. But whether electric vehicles will become an asset or a liability to the grid largely depends on when drivers charge their cars.

Electricity demand fluctuates throughout the day; demand is higher during daytime hours, peaking in the early evening. If many people buy electric vehicles and mostly try to charge right when they get home from work — as many now do — the system could get overloaded or force utilities to deliver more electricity than they are capable of producing.

In California, for example, the worry is not so much with the state’s overall power capacity, but rather with the ability to quickly ramp up production and maintain grid stability when demand is high, said Sandy Louey, media relations manager for the California Energy Commission, in an email. About 150,000 electric vehicles were sold in California in 2018 — 8 percent of all state car sales.

The state projects that electric vehicles will consume 5.4 percent of the state’s electricity, or 17,000 gigawatt hours, by 2030.

Responding to the growth in electric vehicles will present unique challenges for each state. A team of researchers from the University of Texas at Austin estimated the amount of electricity that would be required if every car on the road transitioned to electric. Wyoming, for instance, would need to nudge up its electricity production only 17 percent, while Maine would have to produce 55 percent more.

Efficiency Maine, a state trust that oversees energy efficiency and greenhouse gas reduction programs, offers rebates for the purchase of electric vehicles, part of state efforts to incentivize growth.

“We’re certainly mindful that if those projections are right, then there will need to be more supply,” said Michael Stoddard, the program’s executive director. “But it’s going to unfold over a period of the next 20 years. If we put our minds to it and plan for it, then we should be able to do it.”

A November report sponsored by the Energy Department found that there has been almost no increase in electricity demand nationwide over the past 10 years, while capacity has grown an average of 12 gigawatts per year (1 GW can power more than a half-million homes). That means energy production could climb at a similar rate and still meet even the most aggressive increase in electric vehicles, with proper planning.

Charging during off-peak hours would allow not only many electric vehicles to be added to the roads but also utilities to get more use out of power plants that run only during the limited peak times through improved grid coordination and flexible demand.

Seattle City Light and others are looking at various ways to promote charging during ideal times. One method is time-of-day rates. For the Seattle chargers unveiled last month, users will pay 31 cents per kilowatt hour during peak daytime hours and 17 cents during off-peak hours. The utility will monitor use at its charging stations to see how effective the rates are at shifting charging to more favorable times.

The utility also is working on a pilot program to study charging behavior at home. And it is partnering with customers such as King County Metro that are electrifying large vehicle fleets, including growing electric truck fleets that will demand significant power, to make sure they have both the infrastructure and charging patterns to integrate smoothly.

“Traditionally, our utility approach is to meet the load demand,” said Emeka Anyanwu, energy innovation and resources officer for Seattle City Light.

Instead, he said, the utility is working with customers to see whether they can use existing assets without the need for additional investment.

Numerous analysts say that approach is crucial.

“Even if there’s an overall increase in consumption, it really matters when that occurs,” said Sally Talberg, head of the Michigan Public Service Commission, which oversees the state’s utilities. “The encouragement of off-peak charging and other technology solutions that could come to bear could offset any negative impact.”

One of those solutions is smart charging, a system in which vehicles are plugged in but don’t charge until they receive a signal from the grid that demand has tapered off a sufficient amount. This is often paired with a lower rate for drivers who use it. Several smart-charging pilot programs are being conducted by utilities, although they have not yet been phased in widely, amid ongoing debates over charging control among manufacturers and utilities.

In many places, the increased electricity demand from electric vehicles is seen as a benefit to utilities and rate payers. In the Northwest, electricity consumption has remained relatively stagnant since 2000, despite robust population growth and development. That’s because increasing urbanization and building efficiency have driven down electricity needs.

Electric vehicles could help push electricity consumption closer to utilities’ capacity for production. That would bring in revenue for the providers, which would help defray the costs for maintaining that capacity, lowering rates for all customers.

“Having EV loads is welcome, because it’s environmentally cleaner and helps sustain revenues for utilities,” said Massoud Jourabchi, manager of economic analysis for the Northwest Power and Conservation Council, which develops power plans for the region.

Colorado also is working to promote electric cars, with the aim of putting 940,000 on the road by 2030. The state has adopted California’s zero-emission vehicles mandate, which requires automakers to reach certain market goals for their sales of cars that don’t burn fossil fuels, while extending tax credits for the purchase of such cars, investing in charging stations and electrifying state fleets.

Auto dealers have opposed the mandate, saying it infringes on consumer freedom.

“We think it should be a customer choice, a consumer choice and not a government mandate,” said Tim Jackson, president and chief executive of the Colorado Automobile Dealers Association.

Jackson also said that there’s not yet a strong consumer appetite for electric vehicles, meaning that manufacturers that fail to sell the mandated number of emission-free vehicles would be required to purchase credits, which he thinks would drive up the price of their other models.

Republicans in the state have registered similar concerns, saying electric vehicle adoption should take place based on market forces, not state intervention.

Many in the utility community are excited about the potential for electric cars to serve as mobile energy storage for the grid. Vehicle-to-grid technology, known as V2G, would allow cars charging during the day to take on surplus power from renewable energy sources.

Then, during peak demand times, electric vehicles would return some of that stored energy to the grid. As demand tapers off in the evening, the cars would be able to recharge.

In practice, V2G technology could be especially beneficial if used by heavy-duty fleets, such as school buses or utility vehicles. Those fleets would have substantial battery storage and long periods where they are idle, such as evenings and weekends — and even longer periods such as summer and the holiday season when school is out. The batteries on a bus, Jourabchi said, could store as much as 10 times the electricity needed to power a home for a day.


Related News

View more

Atlantic grids, forestry, coastlines need rethink in era of intense storms: experts

Atlantic Canada Hurricane Resilience focuses on climate change adaptation: grid hardening, burying lines, coastline resiliency to sea-level rise, mixed forests, and aggressive tree trimming to reduce outages from hurricane-force winds and post-tropical storms.


Key Points

A strategy to harden grids, protect coasts, and manage forests to limit hurricane damage across Atlantic Canada.

✅ Grid hardening and selective undergrounding to cut outage risk.

✅ Coastal defenses: seawalls, dikes, and shoreline vegetation upgrades.

✅ Mixed forests and proactive tree trimming to reduce windfall damage.


In an era when storms with hurricane-force winds are expected to keep battering Atlantic Canada, experts say the region should make major changes to electrical grids, power utilities and shoreline defences and even the types of trees being planted.

Work continues today to reconnect customers after post-tropical storm Dorian knocked out power to 80 per cent of homes and businesses in Nova Scotia. By early afternoon there were 56,000 customers without electricity in the province, compared with 400,000 at the storm's peak on the weekend, a reminder that major outages can linger long after severe weather.

Recent scientific literature says 35 hurricanes -- not including post-tropical storms like Dorian -- have made landfall in the region since 1850, an average of one every five years that underscores the value of interprovincial connections like the Maritime Link for reliability.

Heavy rains and strong winds batter Shelburne, N.S. on Saturday, Sept. 7, 2019 as Hurricane Dorian approaches, making storm safety practices crucial for residents. (Suzette Belliveau/ CTV Atlantic)

Anthony Taylor, a forest ecologist scientist with Natural Resources Canada, wrote in a recent peer-reviewed paper that climate change is expected to increase the frequency of severe hurricanes.

He says promoting more mixed forests with hardwoods would reduce the rate of destruction caused by the storms.

Erni Wiebe, former director of distribution at Manitoba Hydro, says the storms should cause Atlantic utilities to rethink their view that burying lines is too expensive and to contemplate other long-term solutions such as the Maritime Link that enhance grid resilience.

Blair Feltmate, head of the Intact Centre on Climate Change at the University of Waterloo, says Atlantic Canada should also develop standards for coastline resiliency due to predictions of rising sea levels combining with the storms, while considering how delivery rate changes influence funding timelines.

He says that would mean a more rapid refurbishing of sea walls and dike systems, along with more shoreline vegetation.

Feltmate also calls for an aggressive tree-trimming program to limit power outages that he says "will otherwise continue to plague the Maritimes," while addressing risks like copper theft through better security.


Related News

View more

DP Energy Sells 325MW Solar Park to Medicine Hat

Saamis Solar Park advances Medicine Hat's renewable energy strategy, as DP Energy secures AUC approval for North America's largest urban solar, repurposing contaminated land; capacity phased from 325 MW toward an initial 75 MW.


Key Points

A 325 MW solar project in Medicine Hat, Alberta, repurposing contaminated land; phased to 75 MW under city ownership.

✅ City acquisition scales capacity to 75 MW in phased build

✅ AUC approval enables construction and grid integration

✅ Reuses phosphogypsum-impacted land near fertilizer plant


DP Energy, an Irish renewable energy developer, has finalized the sale of the Saamis Solar Park—a 325 megawatt (MW) solar project—to the City of Medicine Hat in Alberta, Canada. This transaction marks the development of North America's largest urban solar initiative, while mirroring other Canadian clean-energy deals such as Canadian Solar project sales that signal market depth.

Project Development and Approval

DP Energy secured development rights for the Saamis Solar Park in 2017 and obtained a development permit in 2021. In 2024, the Alberta Utilities Commission (AUC) granted approval for construction and operation, reflecting Alberta's solar growth trends in recent years, paving the way for the project's advancement.

Strategic Acquisition by Medicine Hat

The City of Medicine Hat's acquisition of the Saamis Solar Park aligns with its commitment to enhancing renewable energy infrastructure. Initially, the project was slated for a 325 MW capacity, which would significantly bolster the city's energy supply. However, the city has proposed scaling the project to a 75 MW capacity, focusing on a phased development approach, and doing so amid challenges with solar expansion in Alberta that influence siting and timing. This adjustment aims to align the project's scale with the city's current energy needs and strategic objectives.

Utilization of Contaminated Land

An innovative aspect of the Saamis Solar Park is its location on a 1,600-acre site previously affected by industrial activity. The land, near Medicine Hat's fertilizer plant, was previously compromised by phosphogypsum—a byproduct of fertilizer production. DP Energy's decision to develop the solar park on this site exemplifies a productive reuse of contaminated land, transforming it into a source of clean energy.

Benefits to Medicine Hat

The development of the Saamis Solar Park is poised to deliver multiple benefits to Medicine Hat:

  • Energy Supply Enhancement: The project will augment the city's energy grid, much like municipal solar projects that provide local power, providing a substantial portion of its electricity needs.

  • Economic Advantages: The city anticipates financial savings by reducing carbon tax liabilities, as lower-cost solar contracts have shown competitiveness, through the generation of renewable energy.

  • Environmental Impact: By investing in renewable energy, Medicine Hat aims to reduce its carbon footprint and contribute to global sustainability efforts.

DP Energy's Ongoing Commitment

Despite the sale, DP Energy maintains a strong presence in Canada, where Indigenous-led generation is expanding, with a diverse portfolio of renewable energy projects, including solar, onshore wind, storage, and offshore wind initiatives. The company continues to focus on sustainable development practices, striving to minimize environmental impact while maximizing energy production efficiency.

The transfer of the Saamis Solar Park to the City of Medicine Hat represents a significant milestone in renewable energy development. It showcases effective land reutilization, strategic urban planning, and a shared commitment to sustainable energy solutions, aligning with federal green electricity procurement that reinforces market demand. This project not only enhances the city's energy infrastructure but also sets a precedent for integrating large-scale renewable energy projects within urban environments.


Related News

View more

Parsing Ontario's electricity cost allocation

Ontario Global Adjustment and ICI balance hydro rates, renewable cost shift, and peak demand. Class A and Class B customers face demand response decisions amid pandemic occupancy uncertainty and volatile GA charges through 2022.


Key Points

A pricing model where GA costs and ICI peak allocation shape Class A/B bills, driven by renewables cost shifts.

✅ Renewable cost shift trims GA; larger Class A savings expected.

✅ Class A peak strategy returns; occupancy uncertainty persists.

✅ Class B faces volatile GA; limited levers beyond efficiency.


Ontario’s large commercial electricity customers can approach the looming annual decision about their billing structure for the 12 months beginning July 1 with the assurance of long-term relief on a portion of their costs, amid changes coming for electricity consumers that could affect planning. That’s to be weighed against uncertainties around energy demand and whether a locked-in cost allocation formula that looked favourable in pre-pandemic times will remain so until June 30, 2022.

“The biggest unknown is we just don’t know when the people are coming back,” Jon Douglas, director of sustainability with Menkes Property Management Services, reflected during a webinar sponsored by the Building Owners and Managers Association (BOMA) of Greater Toronto last week. “The occupancy in our office buildings this fall, and going into the new year, could really impact the outcome of the decision.”

After a year of operational upheaval and more modifications to provincial electricity pricing policies, BOMA Toronto’s regularly scheduled workshop ahead of the June 15 deadline for eligible customers to opt into the Industrial Conservation Initiative (ICI) program had a lot of ground to cover. Notably, beginning in January, all commercial customers have seen a reduction in the global adjustment (GA) component of their monthly hydro bills after the Ontario government shifted costs associated with contracted non-hydroelectric renewable supply to reduce the burden on industrial ratepayers from electricity rates to the general provincial account — a move that trims approximately $258 million per month from the total GA charged to industrial and commercial customers. However, they won’t garner the full benefit of that until 2022 since they’re currently repaying about $333 million in GA costs that were deferred in April, May and June of 2020.

Renewable cost shift pares the global adjustment
For now, Ontario government officials estimate the renewable cost shift equates to a 12 per cent discount relative to 2020 prices, even as typical bills may rise about 2% as fixed pricing ends in some cases. Once last year’s GA deferral is repaid at the end of 2021, they project the average Class A customer participating in the ICI program should realize a 16 per cent saving on the total hydro bill, while Class B customers paying the GA on a volumetric per kilowatt-hour (kWh) basis will see a slightly more moderate 15 per cent decrease.

“This is the biggest change to electricity pricing that’s happened since the introduction of ICI,” Tim Christie, director of electricity policy, economics and system planning for Ontario’s Ministry of Energy, Northern Development and Mines, told online workshop attendees. “The government is funding the out-of-market costs of renewables. It does tail off into the 2030s as those contracts (for wind, solar and biomass generation) expire, but over the next eight-ish years, it’s pretty steady at around just over $3 billion per year.”

Extrapolating from 2020 costs, he pegged average electricity costs at roughly 9.1 cents/kWh for Class A commercial customers and 13.2 cents/kWh for Class B, a point of concern for Ontario manufacturers facing high rates as well. However, energy management specialists suggest actual 2021 numbers haven’t proved that out.

“In commercial buildings, we’re averaging 10 to 12 cents for Class A in 2021, and we’re seeing more than that for about 14, 15 cents for Class B,” reported Scott Rouse, managing partner with the consulting firm, Energy@Work.

GA costs for Class B customers dropped nearly 30 per cent in the first four months of 2021 compared to the last four months of 2020, when they averaged 11.8 cents/kWh. Thus far, though, there have been significant month-to-month fluctuations, with a low of 5.04 cents/kWh in February and a high of 10.9 cents/kWh in April contributing to the four-month average of 8.3 cents/kWh.

“In 2020, system-wide GA very often averaged more than $1 billion per month,” Rouse said. “This February it dropped to $500 million, which was really quite surprising. So it is a very volatile cost.”

Although welcome, the renewable cost shift does alter the payback on energy-saving investments, particularly for demand response mechanisms like energy storage. When combined with pandemic-related uncertainty and a series of policy and program reversals alongside calls to clean up Ontario’s hydro policy in recent years, the industry’s appetite for some more capital-intensive technologies appears to be flagging.

“Volatility puts a pause on some of the innovation,” said Terry Flynn, general manager with BentallGreenOak and chair of BOMA Toronto’s energy committee. “It could be a leading edge, but it might be a bleeding edge that won’t bear any fruit because the way the commodity costs are structured will change.”

“There’s kind of a wait-and-see approach on some of these bigger investments,” Douglas concurred.

Industrial Conservation Initiative underpins commercial class divide
Turning to the ICI, Class A customers — defined as those with average monthly energy demand of at least 1 megawatt (MW) — encountered some unexpected changes to the program rules during 2020. Meanwhile, Class B customers — encompassing the vast share of commercial properties smaller than about 350,000 square feet — confront the persistent reality of electricity cost allocation that offloads the burden from larger players onto them.

Through the ICI, participating Class A customers pay a share of the global adjustment that’s prorated to their energy use during the five hours of the period from May 1 to April 30 when the highest overall system demand is recorded. This gives Class A customers the opportunity to lock in a favourable factor for calculating their share of monthly system-wide global adjustment costs if they can successful project and curtail energy loads during those five hours of peak demand. On the flipside, Class B customers pay the remainder of those system-wide costs, on a straightforward per-kWh basis, once Class A payments have been reconciled.

“Class B has sometimes been regarded as the forgotten middle child of the customer classes in Ontario where all the shifted costs in the system kind of pile up,” acknowledged Mark Olsheski, vice president, energy and environment, with Sussex Strategy Group. “Likewise, there can be big unpredictable and uncontrollable swings in the global adjustment rate from month to month and, outside of pure energy efficiency, there really is precious little opportunity or empowerment for a Class B customer to take actions to lower their bills.”

Nevertheless, COVID-19 presents a few extra hiccups for Class A customers this year. Conventionally, late May is when they receive notification of the cost allocation factor that would be used to determine their GA for the upcoming July 1 to June 30 period. This year, though, all current ICI participants will retain the factor they secured by responding to the five hours of peak demand during the 12 months from May 1, 2019 to April 30, 2020 after the Ontario government placed a temporary halt on the peak demand response aspect of the program last summer. Regardless, eligible ICI participants must formally opt into the program by June 15 or they will be billed as Class B customers.

Peak chasing resumes for summer 2021
Since peak demand hours conventionally occur from June to September, Class A customers will once again be studying forecasts intently and preparing to respond via Peak Perks as the heat wave season sets in. That should help alleviate some of the system stresses that arose last summer — prompting policy-makers to reject lobbying for a continued pause on peak demand response.

“The policy rationale was to allow consumers to focus on their operations when recovering from COVID as opposed to reducing peaks. The other issue was that we did not expect the peaks to be high last summer given COVID shutdowns,” Christie recounted. “But due to some hot weather, more people at home and also the lack of ICI response, we saw peaks we haven’t seen in many, many years come up last summer. So the peak hiatus has ended and this summer we’ll be back to responding to ICI as per normal.”

Among Class A customers, owners/managers of office and retail facilities generally have the most to lose from a billing formula tied to the energy demand of more densely occupied buildings in the summer of 2019. However, they could be much more competitively positioned for 2022-23 if their buildings remain below full occupancy and energy demand stays lower than usual this summer.

“Where we can improve is the IESO (Independent Electricity System Operator) and the LDCs (local distribution companies) need to help customers get their real-time data, especially in light of the phantom demand issue, interpret their bills and their Class A versus B scenarios much more easily and comprehensively,” urged Lee Hodgkinson, vice president, technical services, sustainability and ESG, with Dream Unlimited. “ I look for APIs (application programming interface) and direct data flow from the LDCs to the building owners so that we can access that data really easily.”

Given Class A’s historic advantages, few eligible ICI participants are expected to migrate out to Class B. From a sustainability perspective, there’s perhaps more cause to question how the ICI’s 1-MW threshold encourages strategies to move in the other direction.

“You could jack up demand in some buildings and get them into Class A basically by firing up the chillers on the weekend and then pouring cooling outside to get rid of it,” Douglas noted. “That has nothing to do with climate change strategy or sustainability, but it’s a cost- saving strategy, and, sometimes, when you look at the math, it’s hundreds of thousands of dollars you can save.”

Brian Hewson, vice president, consumer protection and industry performance with the Ontario Energy Board (OEB), confirmed the OEB is currently scrutinizing the discrepancy that leaves Class B as the only consumer group with no flexibility to curtail energy load during higher-priced periods, and will be providing advice to the Ministry of Energy. In the interim, that status does, at least, simplify tactics.

“Just reduce your kWh and it doesn’t matter what time of day because you’re paying that fixed rate for 24 hours a day. So if you can curb your demand at night, you get a big bang for your dollar,” Rouse advised.

“We do talk about rates a lot, but if you’re not using it, you’re not paying for it,” Flynn agreed. “A lot of our focus is still on really to try to reduce the number of kilowatts that we use. That seems to be the best thing to do.”


Related News

View more

US January power generation jumps 9.3% on year: EIA

US January power generation climbed to 373.2 TWh, EIA data shows, with coal edging natural gas, record wind output, record nuclear generation, rising hydro, and stable utility-scale solar amid higher Henry Hub prices.


Key Points

US January power generation hit 373.2 TWh; coal led gas, wind and nuclear set records, with solar edging higher.

✅ Coal 31.8% share; gas 29.4%; coal output 118.7 TWh, gas 109.6 TWh.

✅ Wind hit record 26.8 TWh; nuclear record 74.6 TWh.

✅ Total generation 373.2 TWh, highest January since 2014.


The US generated 373.2 TWh of power in January, up 7.9% from 345.9 TWh in December and 9.3% higher than the same month in 2017, Energy Information Administration data shows.

The monthly total was the highest amount in January since 377.3 TWh was generated in January 2014.

Coal generation totaled 118.7 TWh in January, up 11.4% from 106.58 TWh in December and up 2.8% from the year-ago month, consistent with projections of a coal-fired generation increase for the first time since 2014. It was also the highest amount generated in January since 132.4 TWh in 2015.

For the second straight month, more power was generated from coal than natural gas, as 109.6 TWh came from gas, up 3.3% from 106.14 TWh in December and up 19.9% on the year.

However, the 118.7 TWh generated from coal was down 9.6% from the five-year average for the month, due to the higher usage of gas and renewables and a rising share of non-fossil generation in the overall mix.

#google#

Coal made up 31.8% of the total US power generation in January, up from 30.8% in December but down from 33.8% in January 2017.

Gas` generation share was at 29.4% in the latest month, with momentum from record gas-fired electricity earlier in the period, down from 30.7% in December but up from 26.8% in the year-ago month.

In January, the NYMEX Henry Hub gas futures price averaged $3.16/MMBtu, up 13.9% from $2.78/MMBtu averaged in December but down 4% from $3.29/MMBtu averaged in the year-ago month.


WIND, NUCLEAR GENERATION AT RECORD HIGHS

Wind generation was at a record-high 26.8 TWh in January, up 29.3% from 22.8 TWh in December and the highest amount on record, according to EIA data going back to January 2001. Wind generated 7.2% of the nation`s power in January, as an EIA summer outlook anticipates larger wind and solar contributions, up from 6.6% in December and 6.1% in the year-ago month.

Utility-scale solar generated 3.3 TWh in January, up 1.3% from 3.1 TWh in December and up 51.6% on the year. In January, utility-scale solar generation made up 0.9% of US power generation, during a period when solar and wind supplied 10% of US electricity in early 2018, flat from December but up from 0.6% in January 2017.

Nuclear generation was also at a record-high 74.6 TWh in January, up 1.3% month on month and the highest monthly total since the EIA started tracking it in January 2001, eclipsing the previous record of 74.3 TWh set in July 2008. Nuclear generation made up 20% of the US power in January, down from 21.3% in December and 21.4% in the year-ago month.

Hydro power totaled 25.4 TWh in January, making up 6.8% of US power generation during the month, up from 6.5% in December but down from 8.2% in January 2017.


Related News

View more

Germany - A needed nuclear option for climate change

Germany Nuclear Debate Amid Energy Crisis highlights nuclear power vs coal and natural gas, renewables and hydropower limits, carbon emissions, energy security, and baseload reliability during Russia-related supply shocks and winter demand.


Key Points

Germany Nuclear Debate Amid Energy Crisis weighs reactor extensions vs coal revival to bolster security, curb emissions.

✅ Coal plants restarted; nuclear shutdown stays on schedule.

✅ Energy security prioritized amid Russian gas supply cuts.

✅ Emissions likely rise despite renewables expansion.


Peel away the politics and the passion, the doomsaying and the denialism, and climate change largely boils down to this: energy. To avoid the chances of catastrophic climate change while ensuring the world can continue to grow — especially for poor people who live in chronically energy-starved areas — we’ll need to produce ever more energy from sources that emit little or no greenhouse gases.

It’s that simple — and, of course, that complicated.

Zero-carbon sources of renewable energy like wind and solar have seen tremendous increases in capacity and equally impressive decreases in price in recent years, while the decades-old technology of hydropower is still what the International Energy Agency calls the “forgotten giant of low-carbon electricity.”

And then there’s nuclear power. Viewed strictly through the lens of climate change, nuclear power can claim to be a green dream, even as Europe is losing nuclear power just when it really needs energy most.

Unlike coal or natural gas, nuclear plants do not produce direct carbon dioxide emissions when they generate electricity, and over the past 50 years they’ve reduced CO2 emissions by nearly 60 gigatonnes. Unlike solar or wind, nuclear plants aren’t intermittent, and they require significantly less land area per megawatt produced. Unlike hydropower — which has reached its natural limits in many developed countries, including the US — nuclear plants don’t require environmentally intensive dams.

As accidents at Chernobyl and Fukushima have shown, when nuclear power goes wrong, it can go really wrong. But newer plant designs reduce the risk of such catastrophes, which themselves tend to garner far more attention than the steady stream of deaths from climate change and air pollution linked to the normal operation of conventional power plants.

So you might imagine that those who see climate change as an unparalleled existential threat would cheer the development of new nuclear plants and support the extension of nuclear power already in service.

In practice, however, that’s often not the case, as recent events in Germany underline.

When is a Green not green?
The Russian war in Ukraine has made a mess of global energy markets, but perhaps no country has proven more vulnerable than Germany, reigniting debate over a possible resurgence of nuclear energy in Germany among policymakers.

At the start of the year, Russian exports supplied more than half of Germany’s natural gas, along with significant portions of its oil and coal imports. Since the war began, Russia has severely curtailed the flow of gas to Germany, putting the country in a state of acute energy crisis, with fears growing as next winter looms.

With little natural gas supplies of the country’s own, and its heavily supported renewable sector unable to fully make up the shortfall, German leaders faced a dilemma. To maintain enough gas reserves to get the country through the winter, they could try to put off the closure of Germany’s last three remaining nuclear reactors temporarily, which were scheduled to shutter by the end of 2022 as part of Germany’s post-Fukushima turn against nuclear power, and even restart already closed reactors.

Or they could try to reactivate mothballed coal-fired power plants, and make up some of the electricity deficit with Germany’s still-ample coal reserves.

Based on carbon emissions alone, you’d presumably go for the nuclear option. Coal is by far the dirtiest of fossil fuels, responsible for a fifth of all global greenhouse gas emissions — more than any other single source — as well as a soup of conventional air pollutants. Nuclear power produces none of these.

German legislators saw it differently. Last week, the country’s parliament, with the backing of members of the Green Party in the coalition government, passed emergency legislation to reopen coal-powered plants, as well as further measures to boost the production of renewable energy. There would be no effort to restart closed nuclear power plants, or even consider a U-turn on the nuclear phaseout for the last active reactors.

“The gas storage tanks must be full by winter,” Robert Habeck, Germany’s economy minister and a member of the Green Party, said in June, echoing arguments that nuclear would do little to solve the gas issue for the coming winter.

Partially as a result of that prioritization, Germany — which has already seen carbon emissions rise over the past two years, missing its ambitious emissions targets — will emit even more carbon in 2022.

To be fair, restarting closed nuclear power plants is a far more complex undertaking than lighting up old coal plants. Plant operators had only bought enough uranium to make it to the end of 2022, so nuclear fuel supplies are set to run out regardless.

But that’s also the point. Germany, which views itself as a global leader on climate, is grasping at the most carbon-intensive fuel source in part because it made the decision in 2011 to fully turn its back on nuclear for good at the time, enshrining what had been a planned phase-out into law.


Related News

View more

Sign Up for Electricity Forum’s Newsletter

Stay informed with our FREE Newsletter — get the latest news, breakthrough technologies, and expert insights, delivered straight to your inbox.

Electricity Today T&D Magazine Subscribe for FREE

Stay informed with the latest T&D policies and technologies.
  • Timely insights from industry experts
  • Practical solutions T&D engineers
  • Free access to every issue

Live Online & In-person Group Training

Advantages To Instructor-Led Training – Instructor-Led Course, Customized Training, Multiple Locations, Economical, CEU Credits, Course Discounts.

Request For Quotation

Whether you would prefer Live Online or In-Person instruction, our electrical training courses can be tailored to meet your company's specific requirements and delivered to your employees in one location or at various locations.