European Electricity Market Trends 2020 highlight decarbonisation, rising renewables, EV adoption, shifting energy mix, COVID-19 impacts, fuel switching, hydro, wind and solar growth, gas price dynamics, and wholesale electricity price increases.
Key Points
EU power in 2020 saw lower emissions, more renewables, EV growth, demand shifts, and higher wholesale prices.
✅ Power sector CO2 down 14% on higher renewables, lower coal
✅ Renewables 39% vs fossil 36%; hydro, wind, solar expanded
✅ EV share hit 17%; wholesale prices rose with gas, ETS costs
According to the Market Observatory for Energy DG Energy report, the COVID-19 pandemic and favorable weather conditions are the two key drivers of the trends experienced within the European electricity market in 2020. However, the two drivers were exceptional or seasonal.
The key trends within Europe’s electricity market include:
1. Decrease in power sector’s carbon emissions
As a result of the increase in renewables generation and decrease in fossil-fueled power generation in 2020, the power sector was able to reduce its carbon footprint by 14% in 2020. The decrease in the sector’s carbon footprint in 2020 is similar to trends witnessed in 2019 when fuel switching was the main factor behind the decarbonisation trend.
However, most of the drivers in 2020 were exceptional or seasonal (the pandemic, warm winter, high
hydro generation). However, the opposite is expected in 2021, with the first months of 2021 having relatively cold weather, lower wind speeds and higher gas prices, with stunted hydro and nuclear output also cited, developments which suggest that the carbon emissions and intensity of the power sector could rise.
The European Union is targeting to completely decarbonise its power sector by 2050 through the introduction of supporting policies such as the EU Emissions Trading Scheme, the Renewable Energy Directive and legislation addressing air pollutant emissions from industrial installations, with expectations that low-emissions sources will cover most demand growth in the coming years.
According to the European Environment Agency, Europe halved its power sector’s carbon emissions in 2019 from 1990 levels.
2. Changes in energy consumption
EU consumption of electricity fell by -4% as majority of industries did not operate at full level during the first half of 2020. Although majority of EU residents stayed at home, meaning an increase in residential energy use, rising demand by households could not reverse falls in other sectors of the economy.
However, as countries renewed COVID-19 restrictions, energy consumption during the 4th quarter was closer to the “normal levels” than in the first three quarters of 2020.
The increase in energy consumption in the fourth quarter of 2020 was also partly due to colder temperatures compared to 2019 and signs of surging electricity demand in global markets.
3. Increase in demand for EVs
As the electrification of the transport system intensifies, the demand for electric vehicles increased in 2020 with almost half a million new registrations in the fourth quarter of 2020. This was the highest figure on record and translated into an unprecedented 17% market share, more than two times higher than in China and six times higher than in the United States.
However, the European Environment Agency (EEA)argues that the EV registrations were lower in 2020 compared to 2019. EEA states that in 2019, electric car registrations were close to 550 000 units, having reached 300 000 units in 2018.
4. Changes in the region’s energy mix and increase in renewable energy generation
The structure of the region’s energy mix changed in 2020, according to the report.
Owing to favorable weather conditions, hydro energy generation was very high and Europe was able to expand its portfolio of renewable energy generation such that renewables (39%) exceeded the share of fossil fuels (36%) for the first time ever in the EU energy mix.
Rising renewable generation was greatly assisted by 29 GW of wind and solar capacity additions in 2020, which is comparable to 2019 levels. Despite disrupting the supply chains of wind and solar resulting in project delays, the pandemic did not significantly slow down renewables’ expansion.
In fact, coal and lignite energy generation fell by 22% (-87 TWh) and nuclear output dropped by 11% (-79 TWh). On the other hand, gas energy generation was not significantly impacted owing to favorable prices which intensified coal-to-gas and lignite-to-gas switching, even as renewables crowd out gas in parts of the market.
5. Retirement of coal energy generation intensify
As the outlook for emission-intensive technologies worsens and carbon prices rise, more and more early coal retirements have been announced. Utilities in Europe are expected to continue transitioning from coal energy generation under efforts to meet stringent carbon emissions reduction targets and as they try to prepare themselves for future business models that they anticipate to be entirely low-carbon reliant.
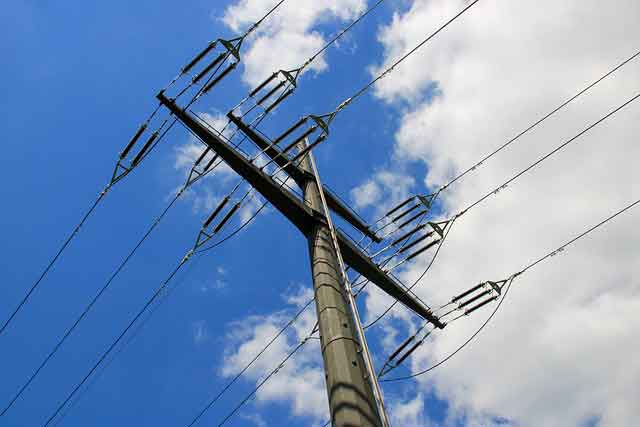
6. Increase in wholesale electricity prices
In recent months, more expensive emission allowances, along with rising gas prices, have driven up wholesale electricity prices on many European markets to levels last seen at the beginning of 2019. The effect was most pronounced in countries that are dependent on coal and lignite. The wholesale electricity prices dynamic is expected to filter through to retail prices.
The rapid sales growth in the EVs sector was accompanied by expanding charging infrastructure. The number of high-power charging points per 100 km of highways rose from 12 to 20 in 2020.
Related News