Power-to-gas converts surplus renewable electricity into green hydrogen or synthetic methane via electrolysis and methanation, enabling seasonal energy storage, grid balancing, hydrogen injection into gas pipelines, and decarbonization of heat, transport, and industry.
Key Points
Power-to-gas turns excess renewable power into hydrogen or methane for storage, grid support, and clean fuel.
✅ Enables hydrogen injection into existing natural gas networks
✅ Balances grids and provides seasonal energy storage capacity
✅ Supplies low-carbon fuels for industry, heat, and heavy transport
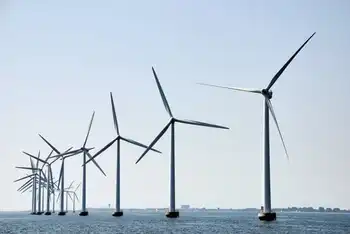
Last month Denmark’s biggest energy firm, Ørsted, said wind farms it is proposing for the North Sea will convert some of their excess power into gas. Electricity flowing in from offshore will feed on-shore electrolysis plants that split water to produce clean-burning hydrogen, with oxygen as a by-product. That would supply a new set of customers who need energy, but not as electricity. And it would take some strain off of Europe’s power grid as it grapples with an ever-increasing share of hard-to-handle EU wind and solar output on the grid.
Turning clean electricity into energetic gases such as hydrogen or methane is an old idea that is making a comeback as renewable power generation surges and crowds out gas in Europe. That is because gases can be stockpiled within the natural gas distribution system to cover times of weak winds and sunlight. They can also provide concentrated energy to replace fossil fuels for vehicles and industries. Although many U.S. energy experts argue that this “power-to-gas” vision may be prohibitively expensive, some of Europe’s biggest industrial firms are buying in to the idea.
European power equipment manufacturers, anticipating a wave of renewable hydrogen projects such as Ørsted’s, vowed in January that, as countries push for hydrogen-ready power plants across Europe, all of their gas-fired turbines will be certified by next year to run on up to 20 percent hydrogen, which burns faster than methane-rich natural gas. The natural gas distributors, meanwhile, have said they will use hydrogen to help them fully de-carbonize Europe’s gas supplies by 2050.
Converting power to gas is picking up steam in Europe because the region has more consistent and aggressive climate policies and evolving electricity pricing frameworks that support integration. Most U.S. states have goals to clean up some fraction of their electricity supply; coal- and gas-fired plants contribute a little more than a quarter of U.S. greenhouse gas emissions. In contrast, European countries are counting on carbon reductions of 80 percent or more by midcentury—reductions that will require an economywide switch to low-carbon energy.
Cleaning up energy by stripping the carbon out of fossil fuels is costly. So is building massive new grid infrastructure, including transmission lines and huge batteries, amid persistent grid expansion woes in parts of Europe. Power-to-gas may be the cheapest way forward, complementing Germany’s net-zero roadmap to cut electricity costs by a third. “In order to reach the targets for climate protection, we need even more renewable energy. Green hydrogen is perceived as one of the most promising ways to make the energy transition happen,” says Armin Schnettler, head of energy and electronics research at Munich-based electric equipment giant Siemens.
Europe already has more than 45 demonstration projects to improve power-to-gas technologies and their integration with power grids and gas networks. The principal focus has been to make the electrolyzers that convert electricity to hydrogen more efficient, longer-lasting and cheaper to produce.
The projects are also scaling up the various technologies. Early installations converted a few hundred kilowatts of electricity, but manufacturers such as Siemens are now building equipment that can convert 10 megawatts, which would yield enough hydrogen each year to heat around 3,000 homes or fuel 100 buses, according to financial consultancy Ernst & Young.
The improvements have been most dramatic for proton-exchange membrane electrolyzers, which are akin to the fuel cells used in hydrogen vehicles (but optimized to produce hydrogen rather than consume it). The price of proton-exchange electrolyzers has dropped by roughly 40 percent during the past decade, according to a study published in February in Nature Energy. They are also five times more compact than older alkaline electrolysis plants, enabling onsite hydrogen production near gas consumers, and they can vary their power consumption within seconds to operate on fluctuating wind and solar generation.
Many European pilot projects are demonstrating “methanation” equipment that converts hydrogen to methane, too, which can be used as a drop-in replacement for natural gas. Europe’s electrolyzer plants, however, are showing that methanation is not as critical to the power-to-gas vision as advocates long believed. Many electrolyzers are injecting their hydrogen directly into natural gas pipelines—something that U.S. gas firms forbid—and they are doing so without impacting either the gas infrastructure or natural gas consumers.
Europe’s first large-scale hydrogen injection began in eastern Germany in 2013 at a two-megawatt electrolyzer installed by Essen-based power firm E.ON. Germany has since ratcheted up the amount of hydrogen it allows in natural gas lines from an initial 2 percent by volume to 10 percent, in a market where renewables now outpace coal and nuclear in Germany, and other European states have followed suit with their own hydrogen allowances. Christopher Hebling, head of hydrogen technologies at the Freiburg-based Fraunhofer Institute for Solar Energy Systems, predicts that such limits will rise to the 20-percent level anticipated by Europe’s turbine manufacturers.
Moving renewable hydrogen and methane via natural gas pipelines promises to cut the cost of switching to renewable energy. For example, gas networks have storage caverns whose reserves could be tapped to run gas-fired electric generation power plants during periods of low wind and solar output. Hebling notes that Germany’s gas network can store 240 terawatt-hours of energy—roughly 25 times more energy than global power grids can presently store by pumping water uphill to refill hydropower reservoirs. Repurposing gas infrastructure to help the power system could save European consumers 138 billion euros ($156 billion) by 2050, according to Dutch energy consultancy Navigant (formerly Ecofys).
For all the pilot plants and promise, renewable hydrogen presently supplies a tiny fraction of Europe’s gas. And, globally, around 4 percent of hydrogen is supplied via electrolysis, with the bulk refined from fossil fuels, according to the International Renewable Energy Agency.
Power-to-gas is catching up, however. According to the February Nature Energy study, renewable hydrogen already pays for itself in some niche applications, and further electrolyzer improvements will progressively extend its market. “If costs continue to decline as they have done in recent years, power-to-gas will become competitive at large scale within the next decade,” says study co-author Gunther Glenk, an economist at the Technical University of Munich.
Glenk says power-to-gas could scale up faster if governments guaranteed premium prices for renewable hydrogen and methane, as they did to mainstream solar and wind power.
Tim Calver, an energy storage researcher turned consultant and Ernst & Young’s executive director in London, agrees that European governments need to step up their support for power-to-gas projects and markets. Calver calls the scale of funding to date, “not proportionate to the challenge that we face on long-term decarbonization and the potential role of hydrogen.”
Related News