Program discounts solar for the poor

By Knight Ridder Tribune


Electrical Testing & Commissioning of Power Systems

Our customized live online or in‑person group training can be delivered to your staff at your location.

  • Live Online
  • 12 hours Instructor-led
  • Group Training Available
Regular Price:
$599
Coupon Price:
$499
Reserve Your Seat Today
The cost of going solar just dropped for some low-income California families.

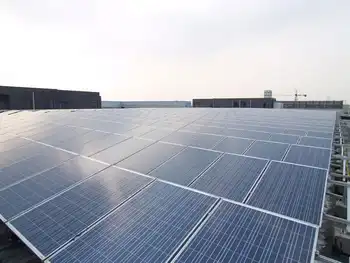
Nearly 7,000 such households could get free or discounted solar roofs thanks to a $108 million subsidy program adopted by the state Public Utilities Commission. A solar roof for a two-bedroom California home generally runs from $20,000 to $24,000, putting the price out of reach for many homeowners. The program aims to help low-income families get the advantages of solar energy - lower monthly bills and environmental benefits.

Under the program, about 50 percent to 75 percent of the cost of a new solar roof will be covered for about 5,000 low-income homeowners. In addition, about 1,800 households with incomes of as much as 50 percent of their area's median income will get free roofs subsidized by the Public Utilities Commission.

In Alameda County, the median household income in 2004 was $57,659, and Contra Costa County's median income was $65,459 that year, according to the U.S. Census Bureau.

Harnessing energy from the sun provides power without adding nearly as much pollution into the air as traditional coal-powered energy plants.

"This is terrific for low-income Californians," said Susan Carothers of the Public Utilities Commission. "It's going to open up opportunities for all." A spokeswoman for the Utilities Reform Network, or TURN, a consumer advocacy organization focused on California utilities, was less optimistic.

"It sounds like a good idea," said Mindy Spatt. "TURN pushed very hard to have this program not be about subsidizing wealthy homeowners to go solar. Benefits of this program should flow to everybody, but the devil is in the details.

"Our concern is whether there will be actual benefits to these people," she said. "Will word get out to low-income households so they can apply? Will the program really make solar accessible to the poorest of the poor?"

In response, Carothers said, "I think that's why it's so critical that we hire the most knowledgeable program manager. That person will be opening doors for those with low incomes and educating them on how to apply for this." The hunt for a program manager has just begun, Carothers said.

The selection process will be wrapped up in early 2008, and it could be mid-2008 before homeowners can start applying to be approved for solar roofs. "(The program manager) is going to have to understand the benefits of solar and they're going to have to develop an outreach plan to find those who qualify across this beautiful state of ours," Carothers said.

The program is part of a statewide initiative to install enough solar panels to generate 3,000 megawatts of electricity. Under normal conditions, 1 megawatt is enough to power 750 homes.

Related News

Customers on the hook for $5.5 billion in deferred BC Hydro operating costs: report

BC Hydro Deferred Regulatory Assets detail $5.5 billion in costs under rate-regulated accounting, to be recovered from ratepayers, highlighting B.C. Utilities Commission oversight, audit scrutiny, financial reporting impacts, and public utility governance.


Key Points

BC Hydro defers costs as regulatory assets to recover from ratepayers, influencing rates and financial reporting.

✅ $5.5B in deferred costs recorded as net regulatory assets

✅ Rate impacts tied to B.C. Utilities Commission oversight

✅ Auditor General to assess accounting and governance


Auditor General Carol Bellringer says BC Hydro has deferred $5.5 billion in expenses that it plans to recover from ratepayers in the future, as rates to rise by 3.75% over two years.

Bellringer focuses on the deferred expenses in a report on the public utility's use of rate-regulated accounting to control electricity rates for customers.

"As of March 31, 2018, BC Hydro reported a total net regulatory asset of $5.455 billion, which is what ratepayers owe," says the report. "BC Hydro expects to recover this from ratepayers in the future. For BC Hydro, this is an asset. For ratepayers, this is a debt."

She says rate-regulated accounting is used widely across North America, but cautions that Hydro has largely overridden the role of the independent B.C. Utilities Commission to regulate rates.

"We think it's important for the people of B.C. and our members of the legislative assembly to better understand rate-regulated accounting in order to appreciate the impact it has on the bottom line for BC Hydro, for government as a whole, for ratepayers and for taxpayers, especially following a three per cent rate increase in April 2018," Bellringer said in a conference call with reporters.

Last June, the B.C. government launched a two-phase review of BC Hydro to find cost savings and look at the direction of the Crown utility, amid calls for change from advocates.

The review came shortly after a planned government rate freeze was overturned by the utilities commission, which resulted in a three per cent rate increase in April 2018.

A statement by BC Hydro and the government says a key objective of the review due this month is to enhance the regulatory oversight of the commission.

Bellringer's office will become BC Hydro's auditor next year — and will be assessing the impact of regulation on the utility's financial reporting.

"It is a complex area and confidence in the regulatory system is critical to protect the public interest," wrote Bellringer.


Related News

View more

Which of the cleaner states imports dirty electricity?

Hourly Electricity Emissions Tracking maps grid balancing areas, embodied emissions, and imports/exports, revealing carbon intensity shifts across PJM, ERCOT, and California ISO, and clarifying renewable energy versus coal impacts on health and climate.


Key Points

An hourly method tracing generation, flows, and embodied emissions to quantify carbon intensity across US balancing areas.

✅ Hourly traces of imports/exports and generation mix

✅ Consumption-based carbon intensity by balancing area

✅ Policy insights for renewables, coal, health costs


In the United States, electricity generation accounts for nearly 30% of our carbon emissions. Some states have responded to that by setting aggressive renewable energy standards; others are hoping to see coal propped up even as its economics get worse. Complicating matters further is the fact that many regional grids are integrated, and as America goes electric the stakes grow, meaning power generated in one location may be exported and used in a different state entirely.

Tracking these electricity exports is critical for understanding how to lower our national carbon emissions. In addition, power from a dirty source like coal has health and environment impacts where it's produced, and the costs of these aren't always paid by the parties using the electricity. Unfortunately, getting reliable figures on how electricity is produced and where it's used is challenging, even for consumers trying to find where their electricity comes from in the first place, leaving some of the best estimates with a time resolution of only a month.

Now, three Stanford researchers—Jacques A. de Chalendar, John Taggart, and Sally M. Benson—have greatly improved on that standard, and they have managed to track power generation and use on an hourly basis. The researchers found that, of the 66 grid balancing areas within the United States, only three have carbon emissions equivalent to our national average, and they have found that imports and exports of electricity have both seasonal and daily changes. de Chalendar et al. discovered that the net results can be substantial, with imported electricity increasing California's emissions/power by 20%.

Hour by hour
To figure out the US energy trading landscape, the researchers obtained 2016 data for grid features called balancing areas. The continental US has 66 of these, providing much better spatial resolution on the data than the larger grid subdivisions. This doesn't cover everything—several balancing areas in Canada and Mexico are tied in to the US grid—and some of these balancing areas are much larger than others. The PJM grid, serving Pennsylvania, New Jersey, and Maryland, for example, is more than twice as large as Texas' ERCOT, in a state that produces and consumes the most electricity in the US.

Despite these limitations, it's possible to get hourly figures on how much electricity was generated, what was used to produce it, and whether it was used locally or exported to another balancing area. Information on the generating sources allowed the researchers to attach an emissions figure to each unit of electricity produced. Coal, for example, produces double the emissions of natural gas, which in turn produces more than an order of magnitude more carbon dioxide than the manufacturing of solar, wind, or hydro facilities. These figures were turned into what the authors call "embodied emissions" that can be traced to where they're eventually used.

Similar figures were also generated for sulfur dioxide and nitrogen oxides. Released by the burning of fossil fuels, these can both influence the global climate and produce local health problems.

Huge variation
The results were striking. "The consumption-based carbon intensity of electricity varies by almost an order of magnitude across the different regions in the US electricity system," the authors conclude. The low is the Bonneville Power grid region, which is largely supplied by hydropower; it has typical emissions below 100kg of carbon dioxide per megawatt-hour. The highest emissions come in the Ohio Valley Electric region, where emissions clear 900kg/MW-hr. Only three regional grids match the overall grid emissions intensity, although that includes the very large PJM (where capacity auction payouts recently fell), ERCOT, and Southern Co balancing areas.

Most of the low-emissions power that's exported comes from the Pacific Northwest's abundant hydropower, while the Rocky Mountains area exports electricity with the highest associated emissions. That leads to some striking asymmetries. Local generation in the hydro-rich Idaho Power Company has embodied emissions of only 71kg/MW-hr, while its imports, coming primarily from Rocky Mountain states, have a carbon content of 625kg/MW-hr.

The reliance on hydropower also makes the asymmetry seasonal. Local generation is highest in the spring as snow melts, but imports become a larger source outside this time of year. As solar and wind can also have pronounced seasonal shifts, similar changes will likely be seen as these become larger contributors to many of these regional grids. Similar things occur daily, as both demand and solar production (and, to a lesser extent, wind) have distinct daily profiles.

The Golden State
California's CISO provides another instructive case. Imports represent less than 30% of its total electric use in 2016, yet California electricity imports provided 40% of its embodied emissions. Some of these, however, come internally from California, provided by the Los Angeles Department of Water and Power. The state itself, however, has only had limited tracking of imported emissions, lumping many of its sources as "other," and has been exporting its energy policies to Western states in ways that shape regional markets.

Overall, the 2016 inventory provides a narrow picture of the US grid, as plenty of trends are rapidly changing our country's emissions profile, including the rise of renewables and the widespread adoption of efficiency measures and other utility trends in 2017 that continue to evolve. The method developed here can, however, allow for annual updates, providing us with a much better picture of trends. That could be quite valuable to track things like how the rapid rise in solar power is altering the daily production of clean power.

More significantly, it provides a basis for more informed policymaking. States that wish to promote low-emissions power can use the information here to either alter the source of their imports or to encourage the sites where they're produced to adopt more renewable power. And those states that are exporting electricity produced primarily through fossil fuels could ensure that the locations where the power is used pay a price that includes the health costs of its production.


Related News

View more

Does Providing Electricity To The Poor Reduce Poverty? Maybe Not

Rural Electrification Poverty Impact examines energy access, grid connections, and reliability, testing economic development claims via randomized trials; findings show minimal gains without appliances, reliable supply, and complementary services like education and job creation initiatives.


Key Points

Study of household grid connections showing modest poverty impact without reliable power and appliances.

✅ Randomized grid connections showed no short-term income gains.

✅ Low reliability and few appliances limited electricity use.

✅ Complementary investments in jobs, education, health may be needed.


The head of Swedfund, the development finance group, recently summarized a widely-held belief: “Access to reliable electricity drives development and is essential for job creation, women’s empowerment and combating poverty.” This view has been the driving force behind a number of efforts to provide electricity to the 1.1 billion people around the world living in energy poverty, such as India's village electrification initiatives in recent years.

But does electricity really help lift households out of poverty? My co-authors and I set out to answer this question. We designed an experiment in which we first identified a sample of “under grid” households in Western Kenya—structures that were located close to but not connected to a grid. These households were then randomly divided into treatment and control groups. In the treatment group, we worked closely with the rural electrification agency to connect the households to the grid for free or at various discounts. In the control group, we made no changes. After eighteen months, we surveyed people from both groups and collected data on an assortment of outcomes, including whether they were employed outside of subsistence agriculture (the most common type of work in the region) and how many assets they owned. We even gave children basic tests, as a frequent assertion is that electricity helps children perform better in school since they are able to study at night.

When we analyzed the data, we found no differences between the treatment and control groups. The rural electrification agency had spent more than $1,000 to connect each household. Yet eighteen months later, the households we connected seemed to be no better off. Even the children’s test scores were more or less the same. The results of our experiment were discouraging, and at odds with the popular view that supplying households with access to electricity will drive economic development. Lifting people out of poverty may require a more comprehensive approach to ensure that electricity is not only affordable (with some evidence that EV growth can benefit all customers in mature markets), but is also reliable, useable, and available to the whole community, paired with other important investments.

For instance, in many low-income countries, the grid has frequent blackouts and maintenance problems, making electricity unreliable, as seen in Nigeria's electricity crisis in recent years. Even if the grid were reliable, poor households may not be able to afford the appliances that would allow for more than just lighting and cell phone charging. In our data, households barely bought any appliances and they used just 3 kilowatt-hours per month. Compare that to the U.S. average of 900 kilowatt-hours per month, a figure that could rise as EV adoption increases electricity demand over time.

There are also other factors to consider. After all, correlation does not equal causation. There is no doubt that the 1.1 billion people without power are the world’s poorest citizens. But this is not the only challenge they face. The poor may also lack running water, basic sanitation, consistent food supplies, quality education, sufficient health care, political influence, and a host of other factors that may be harder to measure but are no less important to well-being. Prioritizing investments in some of these other factors may lead to higher immediate returns. Previous work by one of my co-authors, for example, shows substantial economic gains from government spending on treatment for intestinal worms in children.

It’s possible that our results don’t generalize. They certainly don’t apply to enhancing electricity services for non-residential customers, like factories, hospitals, and schools, and electric utilities adapting to new load patterns. Perhaps the households we studied in Western Kenya are particularly poor (although measures of well-being suggest they are comparable to rural households across Sub-Saharan Africa) or politically disenfranchised. Perhaps if we had waited longer, or if we had electrified an entire region, the household impacts we measured would have been much greater. But others who have studied this question have found similar results. One study, also conducted in Western Kenya, found that subsidizing solar lamps helped families save on kerosene, but did not lead children to study more. Another study found that installing solar-powered microgrids in Indian villages resulted in no socioeconomic benefits.


Related News

View more

B.C.'s Green Energy Ambitions Face Power Supply Challenges

British Columbia Green Grid Constraints underscore BC Hydro's rising imports, peak demand, electrification, hydroelectric variability, and transmission bottlenecks, challenging renewable energy expansion, energy security, and CleanBC targets across industry and zero-emission transportation.


Key Points

They are capacity and supply limits straining B.C.'s clean electrification, driving imports and risking reliability.

✅ Record 25% imports in FY2024 raise emissions and costs

✅ Peak demand and transmission limits delay new connections

✅ Drought reduces hydro output; diversified generation needed


British Columbia's ambitious green energy initiatives are encountering significant hurdles due to a strained electrical grid and increasing demand, with a EV demand bottleneck adding pressure. The province's commitment to reducing carbon emissions and transitioning to renewable energy sources is being tested by the limitations of its current power infrastructure.

Rising Demand and Dwindling Supply

In recent years, B.C. has experienced a surge in electricity demand, driven by factors such as population growth, increased use of electric vehicles, and the electrification of industrial processes. However, the province's power supply has struggled to keep pace, and one study projects B.C. would need to at least double its power output to electrify all road vehicles. In fiscal year 2024, BC Hydro imported a record 13,600 gigawatt hours of electricity, accounting for 25% of the province's total consumption. This reliance on external sources, particularly from fossil-fuel-generated power in the U.S. and Alberta, raises concerns about energy security and sustainability.

Infrastructure Limitations

The current electrical grid is facing capacity constraints, especially during peak demand periods, and regional interties such as a proposed Yukon connection are being discussed to improve reliability. A report from the North American Electric Reliability Corporation highlighted that B.C. could be classified as an "at-risk" area for power generation as early as 2026. This assessment underscores the urgency of addressing infrastructure deficiencies to ensure a reliable and resilient energy supply.

Government Initiatives and Investments

In response to these challenges, the provincial government has outlined plans to expand the electrical system. Premier David Eby announced a 10-year, $36-billion investment to enhance the grid's capacity, including grid development and job creation measures to support local economies. The initiative focuses on increasing electrification, upgrading high-voltage transmission lines, refurbishing existing generating facilities, and expanding substations. These efforts aim to meet the growing demand and support the transition to clean energy sources.

The Role of Renewable Energy

Renewable energy sources, particularly hydroelectric power, play a central role in B.C.'s energy strategy. However, the province's reliance on hydroelectricity has its challenges. Drought conditions in recent years have led to reduced water levels in reservoirs, impacting the generation capacity of hydroelectric plants. This variability underscores the need for a diversified energy mix, with options like a hydrogen project complementing hydro, to ensure a stable and reliable power supply.

Balancing Environmental Goals and Energy Needs

B.C.'s commitment to environmental sustainability is evident in its policies, such as the CleanBC initiative, which aims to phase out natural gas heating in new homes by 2030 and achieve 100% zero-emission vehicle sales by 2035, supported by networks like B.C.'s Electric Highway that expand charging access. While these goals are commendable, they place additional pressure on the electrical grid. The increased demand from electric vehicles and electrified heating systems necessitates a corresponding expansion in power generation and distribution infrastructure.

British Columbia's green energy ambitions are commendable and align with global efforts to combat climate change. However, achieving these goals requires a robust and resilient electrical grid capable of meeting the increasing demand for power. The province's reliance on external power sources and the challenges posed by climate variability highlight the need for strategic investments in infrastructure and a diversified energy portfolio, guided by BC Hydro review recommendations to keep electricity affordable. By addressing these challenges proactively, B.C. can pave the way for a sustainable and secure energy future.


Related News

View more

Ontario utilities team up to warn customers about ongoing scams

Ontario Utility Scam Alert: protect against phishing, spoofed calls, texts, and emails, disconnection threats, and demands for prepaid cards or bitcoin. Tips from Alectra, Elexicon, Hydro One, Hydro Ottawa, and Toronto Hydro.


Key Points

A joint warning by Ontario utilities on tactics and steps to prevent customer fraud, phishing, and spoofed contacts.

✅ Verify bills; call your utility using the official number.

✅ Ignore links; do not accept unexpected e-transfers.

✅ Never pay with gift cards, prepaid cards, or bitcoin.


Five of Ontario's largest utilities have joined forces to raise awareness about ongoing sophisticated utility scams targeting utility customers.

Some common tactics fraudsters use to target Ontarians include impersonation of the local utility or its employees; sending threatening phone calls, texts and emails; or showing up in-person at a customer's home or business and requesting personal information or payment. The requests can include pressure for immediate payment, threats to disconnect service the same day, and demands to purchase prepaid debit cards, gift cards or bitcoin.

The utilities are encouraging all customers to protect themselves and are providing them with the following tips to stay safe, noting that customers want more choice and flexibility in how they manage accounts:

  • Never make a payment for a charge that isn't listed on your most recent bill
  • Ignore text messages or emails with suspicious links promising refunds
  • Don't call the number provided to you — instead, call your utility directly to check the status of your account
  • Only provide personal information or details about your account when you have initiated the contact with the utility representative  
  • Utility companies will never threaten immediate disconnection for non-payment, and many offer relief programs during hardship
  • If you feel threatened in any way, contact your local police
  • Steps you can take to protect yourself against fraud:

Take five minutes to ask additional questions and listen to your instincts — if something doesn't seem right, ask someone about it, and look for news of official utility support efforts that confirm legitimate outreach

  • Immediately hang up on suspicious phone calls
  • Don't click any links in emails/text messages asking you to accept electronic transfers
  • Avoid sharing personal information
  • Always compare bills to previous ones, including the dollar amount and account number, and stay informed about any official rate changes from your utility
  • Reporting suspicious behaviour, including suspected electricity theft, helps authorities

If you believe you may be a victim of fraud, please contact the Canadian Anti-Fraud Centre at 1-888-495-8501 and your local utility.

Customers can find more information at:

  • Alectra Utilities
  • Elexicon Energy
  • Hydro One
  • Hydro Ottawa 
  • Toronto Hydro


Related News

View more

Alberta sets new electricity usage record during deep freeze

Alberta Electricity Demand Record surges during a deep freeze, as AESO reports peak load in megawatts and ENMAX notes increased usage in Calgary and Edmonton, with thermostats up amid a cold snap straining power grid.


Key Points

It is the highest electricity peak load recorded by AESO, reflecting maximum grid usage during cold snaps.

✅ AESO reported 11,729 MW peak during the deep freeze

✅ ENMAX saw a 13 percent demand jump week over week

✅ Cold snap drove thermostats up in Calgary and Edmonton


Albertans are cranking up their thermostats and blasting heat into their homes at overwhelmingly high rates as the deep freeze continues across the region. 

It’s so cold that the province set a new all-time record Tuesday evening for electricity usage. 

According to the Alberta Electric System Operator (AESO), as electricity prices spike in Alberta during extreme demand, 11,729 MW of power was used around 7 p.m. Tuesday, passing the previous record set in January of last year by 31 MW.

Temperatures reached a low of -29 C in Calgary, where rising electricity bills have strained budgets, on Tuesday while Edmonton saw a low of -30 C, according to Environment Canada. Wind chill  made it feel closer to -40.

“That increase — 31 Megawatts — is sizeable and about the equivalent of a moderately sized generation facility,” said AESO communications director, Mike Deising. 

“We do see higher demand in winter because it’s cold and it’s dark and that’s really exactly what we’re seeing right now as demand goes up, people turn on their lights and turn up their furnaces,” and with the UCP scrapping the price cap earlier that’s really exactly what we’re seeing right now as demand goes up, people turn on their lights and turn up their furnaces.”

Deising adds Alberta’s electricity usage over the last year has actually been much lower than average, though experts urge Albertans to lock in rates amid expected volatility, despite more people staying home during the pandemic. 

That trend was continuing into 2021, but as Alberta's rising electricity prices draw attention, it’s expected that more records could be broken. 

“If the cold snap continues we may likely set another record (Wednesday) or (Thursday), depending on what happens with the temperatures,” he said. 

Meanwhile, ENMAX has reported an average real-time system demand of 1,400 MW for the city of Calgary. 

That amount is still a far cry from the current season record of 1,619 MW (Aug. 18, 2020), the all-time winter record of 1,653MW (Dec. 2, 2013), and the all-time summer record of 1,692 MW (Aug. 10, 2018). 

ENMAX says electricity demand has increased quite significantly over the past week — by about 13 per cent — since the cold snap set in. 

As a result, the energy company is once again rolling out its ‘Winter Wise’ campaign in an effort to encourage Calgarians to manage both electricity and natural gas use in the winter, even as a consumer price cap on power bills is enabled by new legislation.


Related News

View more

Sign Up for Electricity Forum’s Newsletter

Stay informed with our FREE Newsletter — get the latest news, breakthrough technologies, and expert insights, delivered straight to your inbox.

Electricity Today T&D Magazine Subscribe for FREE

Stay informed with the latest T&D policies and technologies.
  • Timely insights from industry experts
  • Practical solutions T&D engineers
  • Free access to every issue

Download the 2025 Electrical Training Catalog

Explore 50+ live, expert-led electrical training courses –

  • Interactive
  • Flexible
  • CEU-cerified