NB Power copper thefts highlight risks at high-voltage substations, with vandalism, fatalities, infrastructure damage, ratepayer costs, and law enforcement alerts tied to metal prices, stolen electricity, and safety concerns across New Brunswick and Nova Scotia.
Key Points
Substation metal thefts causing fatalities, outages, safety risks, and higher costs that impact NB ratepayers.
✅ Spike aligns with copper price near $3 per pound
✅ Fatal break-ins at high-voltage facilities in Bathurst
✅ Repairs, delays, and safety risks for crews, customers
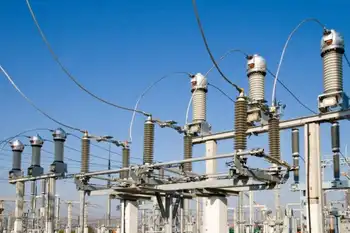
New Brunswick's power utility is urging people to stay away from its substations, saying the valuable copper they contain is proving hard to resist for thieves.
NB Power has seen almost as many incidents of theft and vandalism to its property in April and May of this year, than in all of last year.
In the 2018-2019 fiscal year, the utility recorded 16 cases of theft and/or vandalism.
In April and May, there have already been 13 cases.
One of those was a fatal incident in Bathurst. On April 13, a 41-year-old man was found unresponsive and later died, after breaking into a substation. It was the second fatality linked to a break-in at an NB Power facility in 10 years.
The investigation is still ongoing, but NB Power believes the man was trying to steal copper.
The power utility has been ramping up its efforts -- finding alternate ways to secure its properties, and educate the public -- on the dangers of copper theft, as utilities work to adapt to climate change that can exacerbate severe weather.
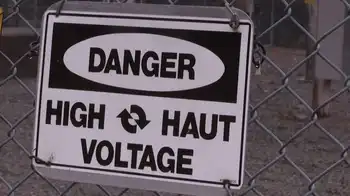
“We really, really, really want to stress that if you’re hitting the wrong wire, cutting the wrong wire, breaking in to or cutting fences, a lot of very bad things can happen,” said NB Power spokesperson Marc Belliveau.
In the 2017-2018 fiscal year, there were 24 recorded cases of theft and/or vandalism.
It also comes at a financial cost for NB Power, and ratepayers -- on average, $330,000 a year. About two-thirds of that is copper. The rest is vehicle break-ins or stolen electricity.
“We’ve done analysis,” Belliveau said. “Often the number of break-ins correspond with the price spiking in copper. So, right now, copper’s about $3 a pound. If it was half of that, there might be half as many incidents.”
New Brunswick Public Safety Minister Carl Urquhart says he knows the utility and police are working to dissuade people from the dangers of the theft, and notes that debates around Site C dam stability issues reflect broader infrastructure safety concerns.
“We all know of incident after incident of major injuries and death caused by, simply by, copper,” he said.
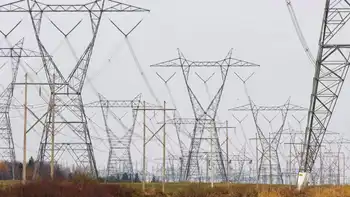
Last November, a Dawson Settlement substation was targeted during a major, storm-related power outage in the province.
It meant NB Power had to divert crews to fix and secure the substation, delaying restoration times for some residents and underscoring efforts to improve local reliability across the grid.
Belliveau says that’s “most frustrating.”
“We’re really trying to take a more proactive approach. And certainly, we encourage people that if you know somebody who’s thinking of doing something like that, to really try and talk them out of it because it’s unbelievably dangerous to break in to a substation,” he said.
Nova Scotia Power, connected through the Maritime Link, was not able to provide details on thefts at their substations, but spokesman David Rodenhiser said "the value of the stolen copper is minor in comparison to the risk that’s created when thieves break into our high-voltage electrical substations."
It's not just risky for the people breaking in, and public opposition to projects like Site C underscores broader community safety concerns.
"It also puts the safety of the workers who maintain our substations at risk, because when thieves steal copper, the protective safety devices in the substations don’t work properly," Rodenhiser said.
Additionally, in Nova Scotia, projects like the Maritime Link have advanced regional transmission, and Nova Scotia Power’s copper components have identifying markers, which make that copper difficult to fence. Anyone who buys or sells stolen propery is at risk of criminal charges.
Related News