Protective Relay Training - Basic
Our customized live online or in‑person group training can be delivered to your staff at your location.

- Live Online
- 12 hours Instructor-led
- Group Training Available
Regular Price:
$699
Coupon Price:
$599
LOS ANGELES
—
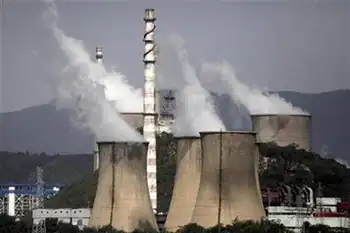
India Coal Power PLF rose as capacity utilisation improved on rising peak demand and hydropower shortfall; thermal plants lifted plant load factor, IPPs lagged, and generation beat program targets amid weak rainfall and slower snowmelt.
What This Means
Coal plant load factor in India rose in May on higher demand and weak hydropower, with generation beating targets.
PLF rose to 65.3%, up 1.7 pp YoY on stronger peak demand
Central 75.5%, state 64.5%, IPPs 57.8% below 60% comfort
Thermal generation 96,580 MU: +4% vs program, +5.2% YoY
Hydro 10,638 MU: -10% vs target, -14% YoY amid weak inflows
Peak demand hit 162,132 MW, +4.3% YoY on last day of May
Capacity utilisation levels of coal-based power plants improved in May because of a surge in electricity demand and lower generation from hydroelectric sources. The plant load factor (PLF) of thermal power plants went up to 65.3% in the month, 1.7 percentage points higher than the year-ago period.
While PLFs of central and state government-owned plants were 75.5% and 64.5%, respectively, the same for independent power producers (IPPs) stood at 57.8%, even as coal and electricity shortages eased across the market. Though PLFs of IPPs were higher than May 2017 levels, it failed to cross the 60% mark, which eases debt servicing capabilities of power generation assets.
Thermal power plants generated 96,580 million units (MU) in May, 4% more than the programme set for the month and 5.2% higher than last year, partly supported by higher imported coal volumes in the market. On the other hand, hydel plants produced 10,638 MU, 10% lower than the target, reflecting a 14% decline from last year.
#google#
Peak demand of power on the last day of the month was 1,62,132 MW, 4.3% higher than the demand registered in the same day a year ago, underscoring India's position as the third-largest electricity producer globally.
According to sources, hydropower plants have been generating lesser than expected electricity due to inadequate rainfall and snow melting at a slower pace than previous years, even as the US reported a power generation jump year on year. Data for power generation from renewable sources have not been made available yet.
Related News
Related News
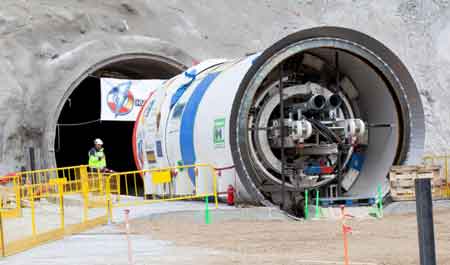
France to speed up data centre grid connections via underground cables
France Data Centre Grid Connections move ahead as the government considers temporary links to underground…
View more

Geothermal Power Plant In Hawaii Nearing Dangerous Meltdown?
Geothermal Power Plant Risks include hydrogen sulfide leaks, toxic gases, lava flow hazards, well blowouts,…
View more
Canada's looming power problem is massive but not insurmountable: report
Canada Net-Zero Electricity Buildout will double or triple power capacity, scaling clean energy, renewables, nuclear,…
View more

Battery-electric buses hit the roads in Metro Vancouver
TransLink Electric Bus Pilot launches zero-emission service in Metro Vancouver, cutting greenhouse gas emissions with…
View more

Lebanon Cabinet approves watershed electricity sector reform
Lebanon Electricity Sector Reform aims to overhaul tariffs, modernize the grid, cut fuel oil subsidies,…
View more
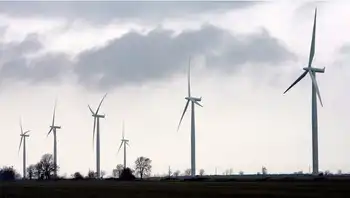
Cancelling Ontario's wind project could cost over $100M, company warns
White Pines Project cancellation highlights Ontario's wind farm contract dispute in Prince Edward County, involving…
View more
Sign Up for Electricity Forum’s Newsletter
Stay informed with our FREE Newsletter — get the latest news, breakthrough technologies, and expert insights, delivered straight to your inbox.
Electricity Today T&D Magazine Subscribe for FREE

Stay informed with the latest T&D policies and technologies.
- Timely insights from industry experts
- Practical solutions T&D engineers
- Free access to every issue
