Sulphur Hexafluoride (SF6) Emissions drive rising greenhouse gas impacts in electrical switchgear, power grids, and renewables, with extreme global warming potential, long atmospheric lifetime, and leakage risks challenging climate targets and grid decarbonization.
Key Points
SF6 emissions are leaks from electrical switchgear and grids, a high-GWP gas with ~1,000-year lifetime.
✅ 23,500x CO2 global warming potential (GWP)
✅ Leaks from switchgear, breakers, gas-insulated substations
✅ Clean air and vacuum alternatives emerging for MV/HV
Sulphur hexafluoride, or SF6, is widely used in the electrical industry to prevent short circuits and accidents.
But leaks of the little-known gas in the UK and the rest of the EU in 2017 were the equivalent of putting an extra 1.3 million cars on the road.
Levels are rising as an unintended consequence of the green energy boom and the broader global energy transition worldwide.
Cheap and non-flammable, SF6 is a colourless, odourless, synthetic gas. It makes a hugely effective insulating material for medium and high-voltage electrical installations.
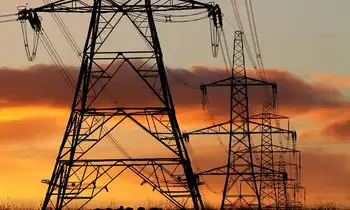
It is widely used across the industry, from large power stations to wind turbines to electrical sub-stations in towns and cities.
It prevents electrical accidents and fires.
However, the significant downside to using the gas is that it has the highest global warming potential of any known substance. It is 23,500 times more warming than carbon dioxide (CO2).
Just one kilogram of SF6 warms the Earth to the same extent as 24 people flying London to New York return.
It also persists in the atmosphere for a long time, warming the Earth for at least 1,000 years.
So why are we using more of this powerful warming gas?
The way we make electricity around the world is changing rapidly, with New Zealand's push to electrify in its energy system.
Where once large coal-fired power stations brought energy to millions, the drive to combat climate change and to move away from coal means they are now being replaced by mixed sources of power including wind, solar and gas.
This has resulted in many more connections to the electricity grid, and with EU electricity use could double by 2050, a rise in the number of electrical switches and circuit breakers that are needed to prevent serious accidents.
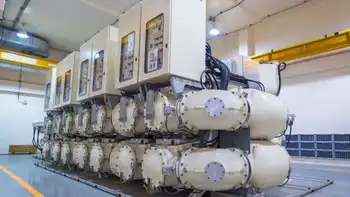
Collectively, these safety devices are called switchgear. The vast majority use SF6 gas to quench arcs and stop short circuits.
"As renewable projects are getting bigger and bigger, we have had to use it within wind turbines specifically," said Costa Pirgousis, an engineer with Scottish Power Renewables on its new East Anglia wind farm, which doesn't use SF6 in turbines.
"As we are putting in more and more turbines, we need more and more switchgear and, as a result, more SF6 is being introduced into big turbines off shore.
"It's been proven for years and we know how it works, and as a result it is very reliable and very low maintenance for us offshore."
How do we know that SF6 is increasing?
Across the entire UK network of power lines and substations, there are around one million kilograms of SF6 installed.
A study from the University of Cardiff found that across all transmission and distribution networks, the amount used was increasing by 30-40 tonnes per year.
This rise was also reflected across Europe with total emissions from the 28 member states in 2017 equivalent to 6.73 million tonnes of CO2. That's the same as the emissions from 1.3 million extra cars on the road for a year.
Researchers at the University of Bristol who monitor concentrations of warming gases in the atmosphere say they have seen significant rises in the last 20 years.
"We make measurements of SF6 in the background atmosphere," said Dr Matt Rigby, reader in atmospheric chemistry at Bristol.
"What we've seen is that the levels have increased substantially, and we've seen almost a doubling of the atmospheric concentration in the last two decades."
How does SF6 get into the atmosphere?
The most important means by which SF6 gets into the atmosphere is from leaks in the electricity industry.
Electrical company Eaton, which manufactures switchgear without SF6, says its research indicates that for the full life-cycle of the product, leaks could be as high as 15% - much higher than many other estimates.
Louis Schaeffer, electrical business manager at Eaton, said: "The newer gear has very low leak rates but the key question is do you have newer gear?
"We looked at all equipment and looked at the average of all those leak rates, and we didn't see people taking into account the filling of the gas. Plus, we looked at how you recycle it and return it and also included the catastrophic leaks."
How damaging to the climate is this gas?
Concentrations in the atmosphere are very small right now, just a fraction of the amount of CO2 in the air.
However, the global installed base of SF6 is expected to grow by 75% by 2030, as data-driven electricity demand surges worldwide.
Another concern is that SF6 is a synthetic gas and isn't absorbed or destroyed naturally. It will all have to be replaced and destroyed to limit the impact on the climate.
Developed countries are expected to report every year to the UN on how much SF6 they use, but developing countries do not face any restrictions on use.
Right now, scientists are detecting concentrations in the atmosphere that are 10 times the amount declared by countries in their reports. Scientists say this is not all coming from countries like India, China and South Korea.
One study found that the methods used to calculate emissions in richer countries "severely under-reported" emissions over the past two decades.
Why hasn't this been banned?
SF6 comes under a group of human-produced substances known as F-gases. The European Commission tried to prohibit a number of these environmentally harmful substances, including gases in refrigeration and air conditioning, back in 2014.
But they faced strong opposition from industries across Europe.
"In the end, the electrical industry lobby was too strong and we had to give in to them," said Dutch Green MEP Bas Eickhout, who was responsible for the attempt to regulate F-gases.
"The electric sector was very strong in arguing that if you want an energy transition, and you have to shift more to electricity, you will need more electric devices. And then you also will need more SF6.
"They used the argument that otherwise the energy transition would be slowed down."
What do regulator and electrical companies say about the gas?
Everyone is trying to reduce their dependence on the gas, and US control efforts suggest targeted policies can drive declines, as it is universally recognised as harmful to the climate.
In the UK, energy regulator Ofgem says it is working with utilities to try to limit leaks of the gas.
"We are using a range of tools to make sure that companies limit their use of SF6, a potent greenhouse gas, where this is in the interest of energy consumers," an Ofgem spokesperson told BBC News.
"This includes funding innovation trials and rewarding companies to research and find alternatives, setting emissions targets, rewarding companies that beat those targets, and penalising those that miss them."
Are there alternatives - and are they very expensive?
The question of alternatives to SF6 has been contentious over recent years.
For high-voltage applications, experts say there are very few solutions that have been rigorously tested.
"There is no real alternative that is proven," said Prof Manu Haddad from the school of engineering at Cardiff University.
"There are some that are being proposed now but to prove their operation over a long period of time is a risk that many companies don't want to take."
Medium voltage operations there are several tried-and-tested materials. Some in the industry say that the conservative nature of the electrical industry is the key reason that few want to change to a less harmful alternative.
"I will tell you, everyone in this industry knows you can do this; there is not a technical reason not to do it," said Louis Schaffer from Eaton.
"It's not really economic; it's more a question that change takes effort and if you don't have to, you won't do it."
Some companies are feeling the winds of change
Sitting in the North Sea some 43km from the Suffolk coast, Scottish Power Renewables has installed one of world's biggest wind farms, in line with a sustainable electric planet vision, where the turbines will be free of SF6 gas.
East Anglia One will see 102 of these towering generators erected, with the capacity to produce up to 714MW (megawatts) of power by 2020, enough to supply half a million homes.
Previously, an installation like this would have used switchgear supplied with SF6, to prevent the electrical accidents that can lead to fires.
Each turbine would normally have contained around 5kg of SF6, which, if it leaked into the atmosphere, would add the equivalent of around 117 tonnes of carbon dioxide. This is roughly the same as the annual emissions from 25 cars.
"In this case we are using a combination of clean air and vacuum technology within the turbine. It allows us to still have a very efficient, reliable, high-voltage network but to also be environmentally friendly," said Costa Pirgousis from Scottish Power Renewables.
"Once there are viable alternatives on the market, there is no reason not to use them. In this case, we've got a viable alternative and that's why we are using it."
But even for companies that are trying to limit the use of SF6, there are still limitations. At the heart of East Anglia One sits a giant offshore substation to which all 102 turbines will connect. It still uses significant quantities of the highly warming gas.
What happens next ?
The EU will review the use of SF6 next year and will examine whether alternatives are available. However, even the most optimistic experts don't think that any ban is likely to be put in place before 2025.
Related News