Nuclear Power for Net-Zero Grids anchors reliable baseload, integrating renewables with grid stability as solar, wind, and battery storage scale. Advanced reactors complement hydropower, curb natural gas reliance, and accelerate deep decarbonization of electricity systems.
Key Points
Uses nuclear baseload and advanced reactors to stabilize power grids and integrate higher shares of variable renewables.
✅ Provides firm, zero-carbon baseload for renewable-heavy grids
✅ Reduces natural gas dependence and peaker emissions
✅ Advanced reactors enhance safety, flexibility, and cost
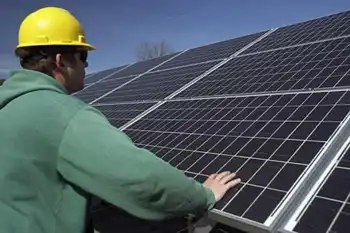
Declining solar, wind, and battery technology costs are helping to grow the share of renewables in the world’s power mix to the point that governments are pledging net-zero emission electricity generation in two to three decades to fight global warming.
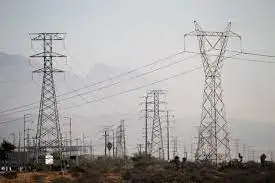
Yet, electricity grids will continue to require stable baseload to incorporate growing shares of renewable energy sources and ensure lights are on even when the sun doesn’t shine, or the wind doesn’t blow. Until battery technology evolves enough—and costs fall far enough—to allow massive storage and deployment of net-zero electricity to the grid, the systems will continue to need power from sources other than solar and wind.
And these will be natural gas and nuclear power, regardless of concerns about emissions from the fossil fuel natural gas and potential disasters at nuclear power facilities such as the ones in Chernobyl or Fukushima.
As natural gas is increasingly considered as just another fossil fuel, nuclear power generation provides carbon-free electricity to the countries that have it, even as debates over nuclear power’s outlook continue worldwide, and could be the key to ensuring a stable power grid capable of taking in growing shares of solar and wind power generation.
The United States, where nuclear energy currently provides more than half of the carbon-free electricity, is supporting the development of advanced nuclear reactors as part of the clean energy strategy.
But Europe, which has set a goal to reach carbon neutrality by 2050, could find itself with growing emissions from the power sector in a decade, as many nuclear reactors are slated for decommissioning and questions remain over whether its aging reactors can bridge the gap. The gap left by lost nuclear power is most easily filled by natural gas-powered electricity generation—and this, if it happens, could undermine the net-zero goals of the European Union (EU) and the bloc’s ambition to be a world leader in the fight against climate change.
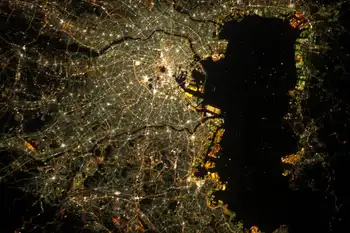
U.S. Power Grid Will Need Nuclear For Net-Zero Emissions
A 2020 report from the University of California, Berkeley, said that rapidly declining solar, wind, and storage prices make it entirely feasible for the U.S. to meet 90 percent of its power needs from zero-emission energy sources by 2035 with zero increases in customer costs from today’s levels.
Still, natural gas-fired generation will be needed for 10 percent of America’s power needs. According to the report, in 2035 it would be possible that “during normal periods of generation and demand, wind, solar, and batteries provide 70% of annual generation, while hydropower and nuclear provide 20%.” Even with an exponential rise in renewable power generation, the U.S. grid will need nuclear power and hydropower to be stable with such a large share of solar and wind.
The U.S. Backs Advanced Nuclear Reactor Technology
The U.S. Department of Energy is funding programs of private companies under DOE’s new Advanced Reactor Demonstration Program (ARDP) to showcase next-gen nuclear designs for U.S. deployment.
“Taking leadership in advanced technology is so important to the country’s future because nuclear energy plays such a key role in our clean energy strategy,” U.S. Secretary of Energy Dan Brouillette said at the end of December when DOE announced it was financially backing five teams to develop and demonstrate advanced nuclear reactors in the United States.
“All of these projects will put the U.S. on an accelerated timeline to domestically and globally deploy advanced nuclear reactors that will enhance safety and be affordable to construct and operate,” Secretary Brouillette said.
According to Washington DC-based Nuclear Energy Institute (NEI), a policy organization of the nuclear technologies industry, nuclear energy provides nearly 55 percent of America’s carbon-free electricity. That is more than 2.5 times the amount generated by hydropower, nearly 3 times the amount generated by wind, and more than 12 times the amount generated by solar. Nuclear energy can help the United States to get to the deep carbonization needed to hit climate goals.
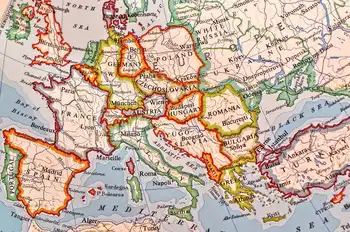
Europe Could See Rising Emissions Without Nuclear Power
While the United States is doubling down on efforts to develop advanced and cheaper nuclear reactors, including microreactors and such with new types of technology, Europe could be headed to growing emissions from the electricity sector as nuclear power facilities are scheduled to be decommissioned over the next decade and Europe is losing nuclear power just when it really needs energy, according to a Reuters analysis from last month.
In many cases, it will be natural gas that will come to the rescue to power grids to ensure grid stability and enough capacity during peak demand because solar and wind generation is variable and dependent on the weather.
For example, Germany, the biggest economy in Europe, is boosting its renewables targets, but it is also phasing out nuclear by next year, amid a nuclear option debate over climate strategy, while its deadline to phase out coal-fired generation is 2038—more than a decade later compared to phase-out plans in the UK and Italy, for example, where the deadline is the mid-2020s.
The UK, which left the EU last year, included support for nuclear power generation as one of the ten pillars in ‘The Ten Point Plan for a Green Industrial Revolution’ unveiled in November.
The UK’s National Grid has issued several warnings about tight supply since the fall of 2020, due to low renewable output amid high demand.
“National Grid’s announcement underscores the urgency of investing in new nuclear capacity, to secure reliable, always-on, emissions-free power, alongside other zero-carbon sources. Otherwise, we will continue to burn gas and coal as a fallback and fall short of our net zero ambitions,” Tom Greatrex, Chief Executive of the Nuclear Industry Association, said in response to one of those warnings.
But it’s in the UK that one major nuclear power plant project has notoriously seen a delay of nearly a decade—Hinkley Point C, originally planned in 2007 to help UK households to “cook their 2017 Christmas turkeys”, is now set for start-up in the middle of the 2020s.
Nuclear power development and plant construction is expensive, but it could save the plans for low-carbon emission power generation in many developed economies, including in the United States.
Related News