Ecofiscal Commission EV Policy Shift examines carbon pricing limits, endorsing signal boosters like subsidies, EV incentives, and coal bans, amid advisory changes and public pushback, to accelerate emissions cuts beyond market-based taxes and regulations.
Key Points
An updated stance recognizing carbon pricing limits and backing EV incentives, subsidies, and rules to reduce emissions.
✅ Carbon pricing plus subsidies, EV incentives
✅ Advisory shift; Jack Mintz departs
✅ Focus on emissions cuts, coal power bans
Something strange happened at the Ecofiscal Commission recently. Earlier this month, the carbon-tax advocacy group featured on its website as one of its advisers the renowned Canadian economist (and FP Comment columnist) Jack M. Mintz. The other day, suddenly and without fanfare, Mintz was gone from the website, and the commission’s advisory board.
Advisers come and advisers go, of course, but it turns out there was an impetus for Mintz’s departure. The Ecofiscal Commission in its latest report, dropped just before Canada Day, seemingly shifted from its position that carbon prices were so excellent at mimicking market forces that the tax could repeal and replace virtually the entire vast expensive gallimaufry of subsidies, caps, rules and regulations that are costing Canada a fortune in business and bureaucrats. As some Ecofiscal commissioners wrote just a few months ago, policies that “dictate specific technologies or methods for reducing emissions constrain private choice and increase costs” and were a bad idea.
But, in this latest report, the commission is now musing about the benefits of carbon-tax “signal boosters”: that is, EV subsidies and rules to, for instance, get people to start buying electric vehicles (EVs), as well as bans on coal-fired power. “Even well designed carbon pricing can have limitations,” rationalized the commission. Mintz said he had “misgivings” about the change of tack. He decided it best if he focus his advisory energies elsewhere.
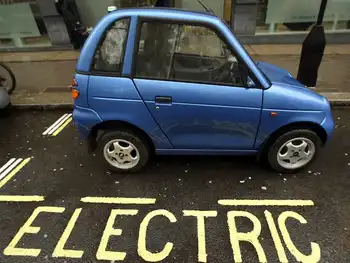
It’s hard to blame the commission for falling like everyone else for the electric-car mania that’s sweeping the nation and the world. Electric cars offer a sexiness that dreary old carbon taxes can never hope to match — especially in light of a new Angus Reid poll last week that showed the majority of Canadians now want governments to shelve any plans for carbon taxes.
So far, because nobody’s really driving these miracle machines, said mania has been limited to breathless news reports about how the electric-vehicle revolution is about to rock our world. EVs comprise just two-tenths of a per cent of all passenger vehicles in North America, despite the media’s endless hype and efforts of green-obsessed governments to cover much of the price tag, like Ontario’s $14,000 rebate for Tesla buyers. In Europe, where virtue-signalling urban environmentalism is the coolest, they’re not feeling the vehicular electricity much more: EVs account for barely one per cent of personal vehicles in France, the U.K. and Germany. When Hong Kong cancelled Tesla rebates in April, sales fell to zero.
Going by the ballyhoo, you’d think EVs were at an inflection point and an unstoppable juggernaut. But it’s one that has yet to even get started. In his 2011 State of the Union address, then president Barack Obama predicted one million electric cars on the road by 2015. Four years later, there wasn’t even a third that many. California offered so many different subsidies for electric vehicles that low-income families could get rebates of up to US$13,500, but it still isn’t even close to reaching its target of having zero-emission vehicles make up 15 per cent of California auto sales by 2025, being stuck at three per cent since 2014. Ontario’s Liberal government last year announced to much laughter its plan to ensure that every family would have at least one zero-emission vehicle (ZEV) by 2024, and Quebec made a plan to make ZEVs worth 15.5 per cent of sales by 2020, while Ottawa’s 2035 EV mandate attracts criticism too. Let’s see how that’s going: Currently, ZEVs make up 0.16 per cent of new vehicle sales in Ontario and 0.38 per cent in Quebec.
The latest sensational but bogus EV news out last week was France’s government announcing the “end of the sale of gasoline and diesel cars by 2040,” and Volvo apparently announcing that as of 2019, all its models would be “electric.” Both announcements made international headlines. Both are baloney. France provided no actual details about this plan (will it literally become a crime to sell a gasoline car? Will hybrids, run partly on gasoline, be allowed?), but more importantly, as automotive writer Ed Wiseman pointed out in The Guardian, a lot will happen in technology and automotive use over the next 23 years that France has no way to predict, with changes in self-driving cars, public car-sharing and fuel technologies. Imagine making rules for today’s internet back in 1994.
Volvo, meanwhile, looked to be recycling and repackaging years-old news to seize on today’s infatuation with electric vehicles to burnish its now Chinese-owned brand. Since 2010, Volvo’s plan has been to focus on engines that were partly electric, with electric turbochargers, but still based on gasoline. Volvo doesn’t actually have an all-electric model, but the gasoline-swigging engine of its popular XC90 SUV is, partly, electrical. When Volvo said all its models would in two years be “electric,” it meant this kind of engine, not that it was phasing out the internal-combustion gasoline engine. But that is what it wanted reporters to think, and judging by all the massive and inaccurate coverage, it worked.
The real story being missed is just how pathetic things look right now for electric cars. Gasoline prices in the U.S. turned historically cheap in 2015 and stayed cheap, icing demand for gasless cars. Tesla, whose founder’s self-promotion had made the niche carmaker magically more valuable than powerhouses like Ford and GM, haemorrhaged US$12 billion in market value last week after tepid sales figures brought some investors back to Earth, even as the company’s new Model 3 began rolling off the line.
Not helping is that environmental claims about environmental cars are falling apart. In June, Tesla was rocked by a controversial Swedish study that found that making one of its car batteries released as much CO2 as eight years of gasoline-powered driving. And Bloomberg reported last week on a study by Chinese engineers that found that electric vehicles, because of battery manufacturing and charging by fossil-fuel-powered electricity sources, emit 50-per-cent more carbon than do internal-combustion engines. Still, the electric-vehicle hype not only continues unabated, it gets bigger and louder every day. If some car company figures out how to harness it, we’d finally have a real automotive revolution on our hands.
Kevin Libin, Financial Post
Related News