Xcel Energy, Attorney General resolve carbon disclosure issues

By Business Wire


Substation Relay Protection Training

Our customized live online or in‑person group training can be delivered to your staff at your location.

  • Live Online
  • 12 hours Instructor-led
  • Group Training Available
Regular Price:
$699
Coupon Price:
$599
Reserve Your Seat Today
Xcel Energy and New York Attorney General Andrew Cuomo announced an agreement that resolves greenhouse gas disclosure issues raised by Cuomo last fall.

"Xcel Energy voluntarily has reduced its carbon emissions by large amounts in recent years and plans to continue making significant reductions in CO2 emissions in the future," said Dick Kelly, chairman, president and CEO.

"We previously provided detailed information concerning the expected impact of climate change and greenhouse gas emissions regulations on our operations, and under this agreement we will make even more detailed disclosures. This agreement will enhance our already aggressive efforts to be responsible environmental stewards."

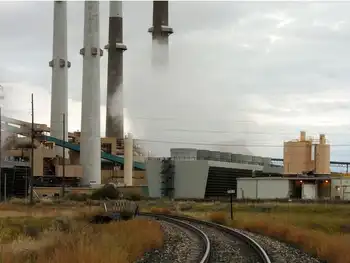
In a Sept. 14 subpoena, Cuomo sought information about Xcel Energy's public disclosures in filings with the U.S. Securities and Exchange Commission regarding the expected impact of climate change and the regulation of greenhouse gas emissions on the company's operations, financial condition and plans to construct a new coal-fired electricity generating unit at the Comanche station in Pueblo, Colo.

In response, Xcel Energy provided documents including its 2006 response to a questionnaire from the Carbon Disclosure Project, an independent not-for-profit organization that solicits information and makes corporate responses publicly available; its Triple Bottom Line report, which describes the company's social, environmental and economic impacts, and information filed with the Colorado Public Utilities Commission about the Comanche plant addition.

"Xcel Energy represents that it has voluntarily reduced its GHG (greenhouse gas) emissions by a cumulative total of over 18 million tons since 2003," the agreement states.

"Xcel Energy is the largest utility provider of wind energy in the United States, according to the American Wind Energy Association. The Company also has announced plans to expand its renewable energy portfolio by at least 6,000 MW (megawatts) of additional renewable electric generating capacity by 2020."

Without admitting or denying any violation of law or wrongdoing, Xcel Energy agreed to resolve the attorney general's investigation voluntarily by agreeing to expand and/or continue to provide a discussion of climate change and possible attendant risks in its 10-K filings with the Securities and Exchange Commission.

The disclosures are to include analyses of financial risks from current and probable future laws, from litigation and from physical impacts of climate change, and strategic analysis of climate change risk and emissions management.

Related News

China boosts wind energy, photovoltaic and concentrated solar power

China Renewable Energy Law drives growth in wind power, solar thermal, and photovoltaic capacity, supporting grid integration and five-year plans, even as China leads CO2 emissions, with policy incentives, compliance inspections, and national resource assessments.


Key Points

A legal framework that speeds wind, solar thermal, and PV growth in China via mandates, incentives, and grid rules.

✅ 2018 renewables: 1.87T kWh, 26.7% of national power

✅ Over 100 State Council policies enabling deployment

✅ Law inspections and regional oversight across six provinces


China leads renewable energies, installing more wind power, solar thermal and photovoltaic than any other country, as seen in the China solar PV growth reported in 2016, but also leads CO2 emissions, and much remains to be done.

The effective application of Chinas renewable energy law has boosted the use of renewable energy in the country and facilitated the rapid development of the sector, as solar parity across Chinese cities indicates, a report said.

The report on compliance with renewable energy law was presented today at the current bimonthly session of the Standing Committee of the National Peoples Assembly (APN).

Electricity generated by renewable energy amounted to about 1.87 trillion kilowatts per hour in 2018, representing 26.7 percent of Chinas total energy production in the year, aligning with trends where wind and solar doubling globally over five years, the report said.

Ding Zhongli, vice president of the NPC Standing Committee, presented the report to the legislators at the second plenary meeting of the session.

An inspection of the law enforcement was carried out from August to November, as U.S. renewables hit 28% record showed momentum elsewhere. A total of 21 members of the NPC Standing Committee and the NPC Environmental Protection and Resource Conservation Committee, as well as national legislators, traveled to six regions at the provincial level on inspection visits. Twelve legislative bodies at the provincial level inspected the law enforcement efforts in their jurisdictions.

The relevant State Council agencies have implemented more than 100 regulations and policies to foster a good policy environment for the development of renewable energy, as seen in markets where U.S. renewable electricity surpassed coal in 2022. Local regulations have also been formulated based on local conditions, according to the report.

In accordance with the law, a thorough investigation of the national conditions of renewable energy resources was undertaken.

In 2008 and 2014 atlas of solar energy resources and wind energy evaluation of China were issued. The relevant agencies of the State Council have also implemented five-year plans for the development of renewable energy, which have provided guidance to the sector, while countries like Ireland's one-third green power target remain in focus within four years.

The main provisions of the law have been met, the law has been effectively applied and the purpose of the legislation has been met, and this momentum is echoed abroad, with U.S. renewables near one-fourth according to projections, Ding said.


Related News

View more

Imported coal volumes up 17% during Apr-Oct as domestic supplies shrink

India Thermal Power Coal Imports surged 17.6% as CEA-monitored plants offset weaker CIL and SCCL supplies, driven by Saubhagya-led electricity demand, regional power deficits, and varied consumption across Uttar Pradesh, Bihar, Maharashtra, and Gujarat.


Key Points

Fuel volumes imported for Indian thermal plants, tracked by CEA, reflecting shifts in CIL/SCCL supply, demand, and regional power deficits.

✅ Imports up 17.6% as domestic CIL/SCCL deliveries lag targets

✅ Saubhagya-driven demand lifts generation in key beneficiary states

✅ Industrial slowdowns cut usage in Maharashtra, Tamil Nadu, Gujarat


The receipt of imported coal by thermal power plants, where plant load factors have risen, has shot up by 17.6 per cent during April-October. The coal import volumes refer to the power plants monitored by the Central Electricity Authority (CEA), and come amid moves to ration coal supplies as electricity demand surges, a power update report from CARE Ratings showed.

Imports escalated as domestic supplies by Coal India Ltd (CIL) and another state run producer- Singareni Collieries Company Ltd (SCCL) dipped in the period, after earlier shortages that have since eased in later months. Rate of supplies by the two coal companies to the CEA monitored power stations stood at 80.4 per cent, indicating a shortfall of 19.6 per cent against the allocated quantity.

According to the study by CARE Ratings, total coal supplied by CIL and SCCL to the power sector stood at 315.9 million tonnes (mt) during April-October as against 328.5 mt in the comparable period of last fiscal year.

The study noted that growth in power generation during the April-October 2019, with India now the third-largest electricity producer globally, was on account of higher demand from Pradhan Mantri Sahaj Bijli Har Ghar Yojana or Saubhagya Scheme beneficiary states. Providing connection to households in order to achieve 100% per cent electrification has in part helped the sector avert de-growth, as part of efforts to rewire Indian electricity and expand access.

Large states namely Uttar Pradesh, Bihar, Punjab, West Bengal and Rajasthan have recorded over five per cent growth in consumption of power. These states along with Odisha, Madhya Pradesh and Assam accounted for 75 per cent of the beneficiaries under the Saubhagya Scheme (Household Electrification Scheme). The ongoing economic downturn has led to a sharp fall in electricity demand from industrialised states. Maharashtra, which is also the largest power consuming state in India, recorded a decline in consumption of 5.6 per cent.

Other states namely Tamil Nadu, Telangana, Gujarat and Odisha too recorded fall in power consumed, echoing global dips in daily electricity demand seen later during the pandemic. These states house large clusters of mining, automobile, cement and other manufacturing industries, and a decline in these sectors led to fall in demand for power across these states. - The demand-supply gap or power deficit has remained at 0.6 per cent during the April-October 2019. North-East reported 4.8 per cent of power deficit followed by Northern Region at 1.3 per cent. Within Northern Region, Jammu & Kashmir and Uttar Pradesh accounted for 65 per cent and 30 per cent respectively of the regions power supply deficit.


Related News

View more

Which of the cleaner states imports dirty electricity?

Hourly Electricity Emissions Tracking maps grid balancing areas, embodied emissions, and imports/exports, revealing carbon intensity shifts across PJM, ERCOT, and California ISO, and clarifying renewable energy versus coal impacts on health and climate.


Key Points

An hourly method tracing generation, flows, and embodied emissions to quantify carbon intensity across US balancing areas.

✅ Hourly traces of imports/exports and generation mix

✅ Consumption-based carbon intensity by balancing area

✅ Policy insights for renewables, coal, health costs


In the United States, electricity generation accounts for nearly 30% of our carbon emissions. Some states have responded to that by setting aggressive renewable energy standards; others are hoping to see coal propped up even as its economics get worse. Complicating matters further is the fact that many regional grids are integrated, and as America goes electric the stakes grow, meaning power generated in one location may be exported and used in a different state entirely.

Tracking these electricity exports is critical for understanding how to lower our national carbon emissions. In addition, power from a dirty source like coal has health and environment impacts where it's produced, and the costs of these aren't always paid by the parties using the electricity. Unfortunately, getting reliable figures on how electricity is produced and where it's used is challenging, even for consumers trying to find where their electricity comes from in the first place, leaving some of the best estimates with a time resolution of only a month.

Now, three Stanford researchers—Jacques A. de Chalendar, John Taggart, and Sally M. Benson—have greatly improved on that standard, and they have managed to track power generation and use on an hourly basis. The researchers found that, of the 66 grid balancing areas within the United States, only three have carbon emissions equivalent to our national average, and they have found that imports and exports of electricity have both seasonal and daily changes. de Chalendar et al. discovered that the net results can be substantial, with imported electricity increasing California's emissions/power by 20%.

Hour by hour
To figure out the US energy trading landscape, the researchers obtained 2016 data for grid features called balancing areas. The continental US has 66 of these, providing much better spatial resolution on the data than the larger grid subdivisions. This doesn't cover everything—several balancing areas in Canada and Mexico are tied in to the US grid—and some of these balancing areas are much larger than others. The PJM grid, serving Pennsylvania, New Jersey, and Maryland, for example, is more than twice as large as Texas' ERCOT, in a state that produces and consumes the most electricity in the US.

Despite these limitations, it's possible to get hourly figures on how much electricity was generated, what was used to produce it, and whether it was used locally or exported to another balancing area. Information on the generating sources allowed the researchers to attach an emissions figure to each unit of electricity produced. Coal, for example, produces double the emissions of natural gas, which in turn produces more than an order of magnitude more carbon dioxide than the manufacturing of solar, wind, or hydro facilities. These figures were turned into what the authors call "embodied emissions" that can be traced to where they're eventually used.

Similar figures were also generated for sulfur dioxide and nitrogen oxides. Released by the burning of fossil fuels, these can both influence the global climate and produce local health problems.

Huge variation
The results were striking. "The consumption-based carbon intensity of electricity varies by almost an order of magnitude across the different regions in the US electricity system," the authors conclude. The low is the Bonneville Power grid region, which is largely supplied by hydropower; it has typical emissions below 100kg of carbon dioxide per megawatt-hour. The highest emissions come in the Ohio Valley Electric region, where emissions clear 900kg/MW-hr. Only three regional grids match the overall grid emissions intensity, although that includes the very large PJM (where capacity auction payouts recently fell), ERCOT, and Southern Co balancing areas.

Most of the low-emissions power that's exported comes from the Pacific Northwest's abundant hydropower, while the Rocky Mountains area exports electricity with the highest associated emissions. That leads to some striking asymmetries. Local generation in the hydro-rich Idaho Power Company has embodied emissions of only 71kg/MW-hr, while its imports, coming primarily from Rocky Mountain states, have a carbon content of 625kg/MW-hr.

The reliance on hydropower also makes the asymmetry seasonal. Local generation is highest in the spring as snow melts, but imports become a larger source outside this time of year. As solar and wind can also have pronounced seasonal shifts, similar changes will likely be seen as these become larger contributors to many of these regional grids. Similar things occur daily, as both demand and solar production (and, to a lesser extent, wind) have distinct daily profiles.

The Golden State
California's CISO provides another instructive case. Imports represent less than 30% of its total electric use in 2016, yet California electricity imports provided 40% of its embodied emissions. Some of these, however, come internally from California, provided by the Los Angeles Department of Water and Power. The state itself, however, has only had limited tracking of imported emissions, lumping many of its sources as "other," and has been exporting its energy policies to Western states in ways that shape regional markets.

Overall, the 2016 inventory provides a narrow picture of the US grid, as plenty of trends are rapidly changing our country's emissions profile, including the rise of renewables and the widespread adoption of efficiency measures and other utility trends in 2017 that continue to evolve. The method developed here can, however, allow for annual updates, providing us with a much better picture of trends. That could be quite valuable to track things like how the rapid rise in solar power is altering the daily production of clean power.

More significantly, it provides a basis for more informed policymaking. States that wish to promote low-emissions power can use the information here to either alter the source of their imports or to encourage the sites where they're produced to adopt more renewable power. And those states that are exporting electricity produced primarily through fossil fuels could ensure that the locations where the power is used pay a price that includes the health costs of its production.


Related News

View more

China power cuts: What is causing the country's blackouts?

China Energy Crisis drives electricity shortages, power cuts, and blackouts as coal prices surge, carbon-neutrality rules tighten, and manufacturing hubs ration energy, disrupting supply chains and industrial output ahead of winter demand peaks.


Key Points

A power shortfall from costly coal, price caps, and emissions targets, causing blackouts and industrial rationing.

✅ Coal prices soar while electricity tariffs are capped

✅ Factories in northeast hubs face rationing and downtime

✅ Supply chains risk delays ahead of winter demand


China is struggling with a severe shortage of electricity which has left millions of homes and businesses hit by power cuts.

Blackouts are not that unusual in the country but this year a number of factors have contributed to a perfect storm for electricity suppliers, including surging electricity demand globally.

The problem is particularly serious in China's north eastern industrial hubs as winter approaches - and is something that could have implications for the rest of the world.

Why has China been hit by power shortages?
The country has in the past struggled to balance electricity supplies with demand, which has often left many of China's provinces at risk of power outages.

During times of peak power consumption in the summer and winter the problem becomes particularly acute.

But this year a number of factors have come together to make the issue especially serious.

As the world starts to reopen after the pandemic, demand for Chinese goods is surging and the factories making them need a lot more power, highlighting China's electricity appetite in recent months.

Rules imposed by Beijing as it attempts to make the country carbon neutral by 2060 have seen coal production slow, even as the country still relies on coal for more than half of its power and as low-emissions generation is set to cover most global demand growth.

And as electricity demand has risen, the price of coal has been pushed up.

But with the government strictly controlling electricity prices, coal-fired power plants are unwilling to operate at a loss, with many drastically reducing their output instead.

Who is being affected by the blackouts?
Homes and businesses have been affected by power cuts as electricity has been rationed in several provinces and regions.

A coal-burning power plant can be seen behind a factory in China"s Inner Mongolia Autonomous Region

The state-run Global Times newspaper said there had been outages in four provinces - Guangdong in the south and Heilongjiang, Jilin and Liaoning in the north east. There are also reports of power cuts in other parts of the country.

Companies in major manufacturing areas have been called on to reduce energy usage during periods of peak demand or limit the number of days that they operate.

Energy-intensive industries such as steel-making, aluminium smelting, cement manufacturing and fertiliser production are among the businesses hardest hit by the outages.

What has the impact been on China's economy?
Official figures have shown that in September 2021, Chinese factory activity shrunk to the lowest it had been since February 2020, when power demand dropped as coronavirus lockdowns crippled the economy.

Concerns over the power cuts have contributed to global investment banks cutting their forecasts for the country's economic growth.

Goldman Sachs has estimated that as much as 44% of the country's industrial activity has been affected by power shortages. It now expects the world's second largest economy to expand by 7.8% this year, down from its previous prediction of 8.2%.

Globally, the outages could affect supply chains, including solar supply chains as the end-of-the-year shopping season approaches.

Since economies have reopened, retailers around the world have already been facing widespread disruption amid a surge in demand for imports.

China's economic planner, the National Development and Reform Commission (NDRC), has outlined a number of measures to resolve the problem, with energy supplies in the northeast of the country as its main priority this winter.

The measures include working closely with generating firms to increase output, ensuring full supplies of coal and promoting the rationing of electricity.

The China Electricity Council, which represents generating firms, has also said that coal-fired power companies were now "expanding their procurement channels at any cost" in order to guarantee winter heat and electricity supplies.

However, finding new sources of coal imports may not be straightforward.

Russia is already focused on its customers in Europe, Indonesian output has been hit by heavy rains and nearby Mongolia is facing a shortage of road haulage capacity,

Are energy shortages around the world connected?
Power cuts in China, UK petrol stations running out of fuel, energy bills jumping in Europe, near-blackouts in Japan and soaring crude oil, natural gas and coal prices on wholesale markets - it would be tempting to assume the world is suddenly in the grip of a global energy drought.

However, it is not quite as simple as that - there are some distinctly different issues around the world.

For example, in the UK petrol stations have run dry as motorists rushed to fill up their vehicles over concerns that a shortage of tanker drivers would mean fuel would soon become scarce.

Meanwhile, mainland Europe's rising energy bills and record electricity prices are due to a number of local factors, including low stockpiles of natural gas, weak output from the region's windmills and solar farms and maintenance work that has put generating operations out of action.


Related News

View more

Here's what we know about the mistaken Pickering nuclear alert one week later

Pickering Nuclear Alert Error prompts Ontario investigation into the Alert Ready emergency alert system, Pelmorex safeguards, and public response at Pickering Nuclear Generating Station, including potassium iodide orders and geo-targeted notification issues.


Key Points

A mistaken Ontario emergency alert about the Pickering plant, now under probe for human error and system safeguards.

✅ Investigation led by Emergency Management Ontario

✅ Alert Ready and Pelmorex safeguards under review

✅ KI pill demand surged; geo-targeting questioned


A number of questions still remain a week after an emergency alert was mistakenly sent out to people across Ontario warning of an unspecified incident at the Pickering Nuclear Generating Station. 

The province’s solicitor general has stepped in and says an investigation into the incident should be completed fairly quickly according to the minister.

However, the nuclear scare has still left residents on edge with tens of thousands of people ordering potassium iodide, or KI, pills that protect the body from radioactive elements in the days following the incident.

Here’s what we know and still don’t know about the mistaken Pickering nuclear plant alert:

Who sent the alert?

According to the Alert Ready Emergency Alert System website, the agency works with several federal, provincial and territorial emergency management officials, Environment and Climate Change Canada and Pelmorex, a broadcasting industry and wireless service provider, to send the alerts.

Martin Belanger, the director of public alerting for Pelmorex, a company that operates the alert system, said there are a number of safeguards built in, including having two separate platforms for training and live alerts.

"The software has some steps and some features built in to minimize that risk and to make sure that users will be able to know whether or not they're sending an alert through the... training platform or whether they're accessing the live system in the case of a real emergency," he said.

Only authorized users have access to the system and the province manages that, Belanger said. Once in the live system, features make the user aware of which platform they are using, with various prompts and messages requiring the user's confirmation. There is a final step that also requires the user to confirm their intent of issuing an alert to cellphones, radio and TVs, Belanger said.

Last Sunday, a follow-up alert was sent to cellphones nearly two hours after the original notification, and during separate service disruptions such as a power outage in London residents also sought timely information.

What has the investigation revealed?

It’s still unclear as to how exactly the alert was sent in error, but Solicitor General Sylvia Jones has tapped the Chief of Emergency Management Ontario to investigate.

"It's very important for me, for the people of Ontario, to know exactly what happened on Sunday morning," Jones said.

Jones said initial observations suggest human error was responsible for the alert that was sent out during routine tests of the emergency alert.

“I want to know what happened and equally important, I want some recommendations on insurances and changes we can make to the system to make sure it doesn't happen again,” Jones said.

Jones said she expects the results of the probe to be made public.

Can you unsubscribe from emergency alerts?

It’s not possible to opt out of receiving the alerts, according to the Alert Ready Emergency Alert System website, and Ontario utilities warn about scams to help customers distinguish official notices.

“Given the importance of warning Canadians of imminent threats to the safety of life and property, the CRTC requires wireless service providers to distribute alerts on all compatible wireless devices connected to an LTE network in the target area,” the website reads.

The agency explains that unlike radio and TV broadcasting, the wireless public alerting system is geo-targeted and is specific to the a “limited area of coverage”, and examples like an Alberta grid alert have highlighted how jurisdictions tailor notices for their systems.

“As a result, if an emergency alert reaches your wireless device, you are located in an area where there is an imminent danger.”

The Pickering alert, however, was received by people from as far as Ottawa to Windsor.

Is the Pickering Nuclear Generating Station closing?

The Pickering nuclear plant has been operating since 1971, and had been scheduled to be decommissioned this year, but the former Liberal government -- and the current Progressive Conservative government -- committed to keeping it open until 2024. Decommissioning is now set to start in 2028.

It operates six CANDU reactors, and in contingency planning operators have considered locking down key staff to maintain reliability, generates 14 per cent of Ontario's electricity and is responsible for 4,500 jobs across the region, according to OPG, while utilities such as Hydro One's relief programs have supported customers during broader crises.

What should I do if I receive an emergency alert?

Alert Ready says that if you received an alert on your wireless device it’s important to take action “safely”.

“Stop what you are doing when it is safe to do so and read the emergency alert,” the agency says on their website.

“Alerting authorities will include within the emergency alert the information you need and guidance for any action you are required to take, and insights from U.S. grid pandemic response underscore how critical infrastructure plans intersect with public safety.”

“This could include but is not limited to: limit unnecessary travel, evacuate the areas, seek shelter, etc.”

The wording of last Sunday's alert caused much initial confusion, warning residents within 10 kilometres of the plant of "an incident," though there was no "abnormal" release of radioactivity and residents didn't need to take protective steps, but emergency crews were responding.

“In the event of a real emergency, the wording would be different,” Jones said.


Related News

View more

New England Is Burning the Most Oil for Electricity Since 2018

New England oil-fired generation surges as ISO New England manages a cold snap, dual-fuel switching, and a natural gas price spike, highlighting winter reliability challenges, LNG and pipeline limits, and rising CO2 emissions.


Key Points

Reliance on oil-burning power plants during winter demand spikes when natural gas is costly or constrained.

✅ Driven by dual-fuel switching amid high natural gas prices

✅ ISO-NE winter reliability rules encourage oil stockpiles

✅ Raises CO2 emissions despite coal retirements and renewables growth


New England is relying on oil-fired generators for the most electricity since 2018 as a frigid blast boosts demand for power and natural gas prices soar across markets. 

Oil generators were producing more than 4,200 megawatts early Thursday, accounting for about a quarter of the grid’s power supply, according to ISO New England. That was the most since Jan. 6, 2018, when oil plants produced as much as 6.4 gigawatts, or 32% of the grid’s output, said Wood Mackenzie analyst Margaret Cashman.  

Oil is typically used only when demand spikes, because of higher costs and emissions concerns. Consumption has been consistently high over the past three weeks as some generators switch from gas, which has surged in price in recent months. New England generators are producing power from oil at an average rate of almost 1.8 gigawatts so far this month, the highest for January in at least five years. 

Oil’s share declined to 16% Friday morning ahead of an expected snowstorm, which was “a surprise,” Cashman said. 

“It makes me wonder if some of those generators are aiming to reserve their fuel for this weekend,” she said.

During the recent cold snap, more than a tenth of the electricity generated in New England has been produced by power plants that haven’t happened for at least 15 years.

Burning oil for electricity was standard practice throughout the region for decades. It was once our most common fuel for power and as recently as 2000, fully 19% of the six-state region’s electricity came from burning oil, according to ISO-New England, more than any other source except nuclear power at the time.

Since then, however, natural gas has gotten so cheap that most oil-fired plants have been shut or converted to burn gas, to the point that just 1% of New England’s electricity came from oil in 2018, whereas about half our power came from natural gas generation regionally during that period. This is good because natural gas produces less pollution, both particulates and greenhouse gasses, although exactly how much less is a matter of debate.

But as you probably know, there’s a problem: Natural gas is also used for heating, which gets first dibs. Prolonged cold snaps require so much gas to keep us warm, a challenge echoed in Ontario’s electricity system as supply tightens, that there might not be enough for power plants – at least, not at prices they’re willing to pay.

After we came close to rolling brownouts during the polar vortex in the 2017-18 winter because gas-fired power plants cut back so much, ISO-NE, which has oversight of the power grid, established “winter reliability” rules. The most important change was to pay power plants to become dual-fuel, meaning they can switch quickly between natural gas and oil, and to stockpile oil for winter cold snaps.

We’re seeing that practice in action right now, as many dual-fuel plants have switched away from gas to oil, just as was intended.

That switch is part of the reason EPA says the region’s carbon emissions have gone up in the pandemic, from 22 million tons of CO2 in 2019 to 24 million tons in 2021. That reverses a long trend caused partly by closing of coal plants and partly by growing solar and offshore wind capacity: New England power generation produced 36 million tons of CO2 a decade ago.

So if we admit that a return to oil burning is bad, and it is, what can we do in future winters? There are many possibilities, including tapping more clean imports such as Canadian hydropower to diversify supply.

The most obvious solution is to import more natural gas, especially from fracked fields in New York state and Pennsylvania. But efforts to build pipelines to do that have been shot down a couple of times and seem unlikely to go forward and importing more gas via ocean tanker in the form of liquefied natural gas (LNG) is also an option, but hits limits in terms of port facilities.

Aside from NIMBY concerns, the problem with building pipelines or ports to import more gas is that pipelines and ports are very expensive. Once they’re built they create a financial incentive to keep using natural gas for decades to justify the expense, similar to moves such as Ontario’s new gas plants that lock in generation. That makes it much harder for New England to decarbonize and potentially leaves ratepayers on the hook for a boatload of stranded costs.


Related News

View more

Sign Up for Electricity Forum’s Newsletter

Stay informed with our FREE Newsletter — get the latest news, breakthrough technologies, and expert insights, delivered straight to your inbox.

Electricity Today T&D Magazine Subscribe for FREE

Stay informed with the latest T&D policies and technologies.
  • Timely insights from industry experts
  • Practical solutions T&D engineers
  • Free access to every issue

Live Online & In-person Group Training

Advantages To Instructor-Led Training – Instructor-Led Course, Customized Training, Multiple Locations, Economical, CEU Credits, Course Discounts.

Request For Quotation

Whether you would prefer Live Online or In-Person instruction, our electrical training courses can be tailored to meet your company's specific requirements and delivered to your employees in one location or at various locations.