Website tracks worst polluting power plants

By Toronto Star


Substation Relay Protection Training

Our customized live online or in‑person group training can be delivered to your staff at your location.

  • Live Online
  • 12 hours Instructor-led
  • Group Training Available
Regular Price:
$699
Coupon Price:
$599
Reserve Your Seat Today
How dirty is your electricity?

The information is on a new website, and its creators hope the public disclosure will inspire a global cleanup of polluting power plants.

Around the world, 50,000 plants generate electricity: Every year, the thousands that burn coal and other fossil fuels spew 10 billion tons of carbon dioxide, making a major contribution to climate change, according to the Carbon Monitoring for Action (CARMA) site.

The problem stands to get worse, with hundreds more coal-fired plants set to be built during the next decade, says David Wheeler of the Centre for Global Development, which compiled the database.

Political rhetoric increasingly stresses the need to cut emissions, "but the reality on the ground is going in the other direction," Wheeler said in an interview.

"Information leads to action.... If you can get a coherent database to the public, you can have quite a substantial impact."

About 60 per cent of the world's electricity is generated by burning fossil fuels, and those power plants create one-quarter of all greenhouse gas emissions, CARMA says.

The countries with, by far, the most dirty plants are the United States and China: Together, they produce more than half the global power plant emissions.

Canada is well back in 15th place. Thanks to its many sources of hydro and nuclear power, Canada also produces relatively few greenhouse gases in proportion to the electricity generated.

Among individual plants, the biggest emitters are in China, Taiwan, South Korea, Russia and the U.S.

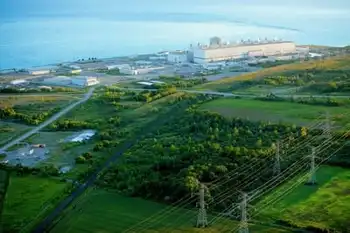
Ontario Power Generation's Nanticoke plant on Lake Erie is 65th on the list, at about 17.6 million tons of greenhouse gases a year.

It operates only intermittently to generate electricity at times of peak demand. If it ran as often as most large plants it would be a "world scale" polluter, Wheeler said.

While 4,000 companies run power plants, only 100 produce 57 per cent of the emissions, Wheeler noted. "One hundred CEOs are accountable for that much."

Research for the site – CARMA.org – confirmed "the dismaying persistence" of coal as a fuel, despite its well-known contribution to climate change, he said.

Along with hundreds of coal-fired plants being built in Asia, the U.S. plans 83 and Western Europe, 38.

The work also undermined the argument, often made in international negotiations, that climate change is caused by wealthy industrialized nations and, therefore, the developing world merits a pass while it attempts to rise out of poverty. This year, for the first time, greenhouse emissions from power plants in developing nations will exceed those in the developed world.

The view that the "South" can wait is outmoded, Wheeler said.

It's "moving into crisis territory on its own now, even if there was no more carbon dioxide from the 'North.'"

The solution, Wheeler said, must be "some grand bargain" among all 203 nations included in the database to regulate emissions and reduce them through new technology, renewable sources, conservation and efficiency.

Public disclosure is already credited with reducing air and water emissions of toxic substances in Canada, the U.S. and even in China, Wheeler said.

It can lead to public pressure on polluters. As well, he said, banks are sometimes unwilling to back companies that might face pollution lawsuits or appear to be wasteful. And corporate executives occasionally want to improve their image. Disclosure can, "set off soul-searching in corporate suites."

Related News

NEW Hydro One shares down after Ontario government says CEO, board out

Hydro One Leadership Shakeup unsettles investors as Ontario government ousts CEO and board, pressuring shares; analysts cite political and regulatory risk, stock volatility, trimmed price targets, and dividend stability at the regulated utility.


Key Points

An abrupt CEO exit and board overhaul at Hydro One, driving share declines and raising political and regulatory risk.

✅ Shares fall as CEO retires and board resigns under provincial pressure.

✅ Analysts cut price targets; warn of political, regulatory risks.

✅ New board to pick CEO; province consults on compensation.


Hydro One Ltd. shares slid Thursday with some analysts sounding warnings of greater uncertainty after the new Ontario government announced the retirement of the electrical utility's chief executive and the replacement of its board of directors.

 After sagging by almost eight per cent in early trading on the Toronto Stock Exchange, following news that Q2 profit plunged 23% amid weaker electricity revenue, shares of the company were later down four per cent, or 81 cents, at $19.36 as of 11:42 a.m. ET.

On Wednesday, after stock markets had closed for the day, Ontario Premier Doug Ford announced the immediate retirement of Hydro One CEO Mayo Schmidt. He leaves with a $400,000 payout in lieu of post-retirement benefits and allowances, Hydro One said.

Doug Ford's government forces out Hydro One '$6-million man'

During the recent provincial election campaign, Ford vowed to fire Schmidt, who earned $6.2 million last year and whose salary wouldn't be reduced despite calls to cut electricity costs.

Paul Dobson, Hydro One's chief financial officer, will serve as acting CEO until a new top executive is selected.

Ford also said the entire board of directors of the utility would resign. Hydro One said a new board — four members of which will be nominated by the province — will select the company's next CEO, and the province will be consulted on the next leader's compensation.

A new board is expected to be formed by mid-August.

The provincial government is the largest single investor in Hydro One, holding a 47 per cent stake. The company was partly privatized by the former Liberal government in 2015, while the NDP has proposed to make hydro public again in Ontario to change course.


Doug Ford promises to keep Pickering nuclear plant open until 2024

In response to the government's move to supplant the utility's board and CEO, some analysts cautioned investors about too many unknowns in the near-term outlook, citing raised political or regulatory risks.

Analyst Jeremy Rosenfield of iA Securities cut his rating on Hydro One shares to hold from buy, and reduced his 12-month price target for the stock to $24 from $26.

Rosenfield said the stock is still a defensive investment supported by stable earnings and cash flows, good earnings growth and healthy dividend.

However, he said in a research note that "the heightened potential for further political interference in the province's electricity market and regulated utility framework represent key risk factors that are likely to outweigh Hydro One's fundamentals over the near term."


Potential challenge to find new CEO

Laurentian Bank Securities analyst Mona Nazir said in a research note that the magnitude of change all at once was "surprising but not shocking."

She said the agreement that will see Hydro One consult with the provincial government on matters involving executive pay could have an impact on the hiring of a new CEO for the utility.

"Given the government's open and public criticism of the company and a potential ceiling on compensation, it may be challenging to attract top talent to the position," she wrote.

Laurentian cut its rating on the Hydro One to hold and reduced its price target to $21 from $24.

Analysts at CIBC World Markets said investors face an uncertain future, noting parallels with debates at Manitoba Hydro over political direction.

"In particular, we are are concerned about the government meddling in with [power] rates," wrote Robert Catellier and Archit Kshetrapal in a research note, adding they believe the new provincial government is aiming for a 12 per cent reduction in customers' power bills.

CIBC reduced its price target on Hydro One's shares to $20.50 from its previous target of $24.


Related News

View more

Which of the cleaner states imports dirty electricity?

Hourly Electricity Emissions Tracking maps grid balancing areas, embodied emissions, and imports/exports, revealing carbon intensity shifts across PJM, ERCOT, and California ISO, and clarifying renewable energy versus coal impacts on health and climate.


Key Points

An hourly method tracing generation, flows, and embodied emissions to quantify carbon intensity across US balancing areas.

✅ Hourly traces of imports/exports and generation mix

✅ Consumption-based carbon intensity by balancing area

✅ Policy insights for renewables, coal, health costs


In the United States, electricity generation accounts for nearly 30% of our carbon emissions. Some states have responded to that by setting aggressive renewable energy standards; others are hoping to see coal propped up even as its economics get worse. Complicating matters further is the fact that many regional grids are integrated, and as America goes electric the stakes grow, meaning power generated in one location may be exported and used in a different state entirely.

Tracking these electricity exports is critical for understanding how to lower our national carbon emissions. In addition, power from a dirty source like coal has health and environment impacts where it's produced, and the costs of these aren't always paid by the parties using the electricity. Unfortunately, getting reliable figures on how electricity is produced and where it's used is challenging, even for consumers trying to find where their electricity comes from in the first place, leaving some of the best estimates with a time resolution of only a month.

Now, three Stanford researchers—Jacques A. de Chalendar, John Taggart, and Sally M. Benson—have greatly improved on that standard, and they have managed to track power generation and use on an hourly basis. The researchers found that, of the 66 grid balancing areas within the United States, only three have carbon emissions equivalent to our national average, and they have found that imports and exports of electricity have both seasonal and daily changes. de Chalendar et al. discovered that the net results can be substantial, with imported electricity increasing California's emissions/power by 20%.

Hour by hour
To figure out the US energy trading landscape, the researchers obtained 2016 data for grid features called balancing areas. The continental US has 66 of these, providing much better spatial resolution on the data than the larger grid subdivisions. This doesn't cover everything—several balancing areas in Canada and Mexico are tied in to the US grid—and some of these balancing areas are much larger than others. The PJM grid, serving Pennsylvania, New Jersey, and Maryland, for example, is more than twice as large as Texas' ERCOT, in a state that produces and consumes the most electricity in the US.

Despite these limitations, it's possible to get hourly figures on how much electricity was generated, what was used to produce it, and whether it was used locally or exported to another balancing area. Information on the generating sources allowed the researchers to attach an emissions figure to each unit of electricity produced. Coal, for example, produces double the emissions of natural gas, which in turn produces more than an order of magnitude more carbon dioxide than the manufacturing of solar, wind, or hydro facilities. These figures were turned into what the authors call "embodied emissions" that can be traced to where they're eventually used.

Similar figures were also generated for sulfur dioxide and nitrogen oxides. Released by the burning of fossil fuels, these can both influence the global climate and produce local health problems.

Huge variation
The results were striking. "The consumption-based carbon intensity of electricity varies by almost an order of magnitude across the different regions in the US electricity system," the authors conclude. The low is the Bonneville Power grid region, which is largely supplied by hydropower; it has typical emissions below 100kg of carbon dioxide per megawatt-hour. The highest emissions come in the Ohio Valley Electric region, where emissions clear 900kg/MW-hr. Only three regional grids match the overall grid emissions intensity, although that includes the very large PJM (where capacity auction payouts recently fell), ERCOT, and Southern Co balancing areas.

Most of the low-emissions power that's exported comes from the Pacific Northwest's abundant hydropower, while the Rocky Mountains area exports electricity with the highest associated emissions. That leads to some striking asymmetries. Local generation in the hydro-rich Idaho Power Company has embodied emissions of only 71kg/MW-hr, while its imports, coming primarily from Rocky Mountain states, have a carbon content of 625kg/MW-hr.

The reliance on hydropower also makes the asymmetry seasonal. Local generation is highest in the spring as snow melts, but imports become a larger source outside this time of year. As solar and wind can also have pronounced seasonal shifts, similar changes will likely be seen as these become larger contributors to many of these regional grids. Similar things occur daily, as both demand and solar production (and, to a lesser extent, wind) have distinct daily profiles.

The Golden State
California's CISO provides another instructive case. Imports represent less than 30% of its total electric use in 2016, yet California electricity imports provided 40% of its embodied emissions. Some of these, however, come internally from California, provided by the Los Angeles Department of Water and Power. The state itself, however, has only had limited tracking of imported emissions, lumping many of its sources as "other," and has been exporting its energy policies to Western states in ways that shape regional markets.

Overall, the 2016 inventory provides a narrow picture of the US grid, as plenty of trends are rapidly changing our country's emissions profile, including the rise of renewables and the widespread adoption of efficiency measures and other utility trends in 2017 that continue to evolve. The method developed here can, however, allow for annual updates, providing us with a much better picture of trends. That could be quite valuable to track things like how the rapid rise in solar power is altering the daily production of clean power.

More significantly, it provides a basis for more informed policymaking. States that wish to promote low-emissions power can use the information here to either alter the source of their imports or to encourage the sites where they're produced to adopt more renewable power. And those states that are exporting electricity produced primarily through fossil fuels could ensure that the locations where the power is used pay a price that includes the health costs of its production.


Related News

View more

Manitoba Hydro's burgeoning debt surpasses $19 billion

Manitoba Hydro Debt Load surges past $19.2B as the Crown corporation faces shrinking net income, restructuring costs, and PUB rate decisions, driven by Bipole III, Keeyask construction, aging infrastructure, and rising interest rate risks.


Key Points

Manitoba Hydro Debt Load refers to the utility's escalating borrowings exceeding $19B, pressuring rates and finances.

✅ Debt rose to $19.2B; projected near $25B within five years.

✅ Major drivers: Bipole III, Keeyask, aging assets, restructuring.

✅ Rate hikes sought; PUB approved 3.6% vs 7.9% request.


Manitoba Hydro's debt load now exceeds $19 billion as the provincial Crown corporation grapples with a shrinking net income amid ongoing efforts to slay costs.

The utility's annual report, to be released publicly on Tuesday, also shows its total consolidated net income slumped from $71 million in 2016-2017 to $37 million in the last fiscal year, mirroring a Hydro One profit drop as electricity revenue fell.

It said efforts to restructure the utility and reduce costs are partly to blame for the $34 million drop in year-over-year income.

These earnings come nowhere close, however, to alleviating Hydro's long-term debt problem, a dynamic also seen in a BC Hydro deferred costs report about customer exposure. The figure is pegged at $19.2 billion this fiscal year, up from $16.1 billion the previous year and $14.2 billion in 2016.

The utility projects its debt will grow to about $25 billion in the next five years. Its largest expenses include finishing the Bipole III line, working on the Keeyask Generating System that is halfway done and rebuilding aging wood poles and substations, the report said.

"This level of debt increases the potential financial exposure from risks facing the corporation and is a concern for both

the corporation and our customers who may be exposed to higher rate increases in the event of rising interest rates, a prolonged drought or a major system failure," outgoing president and CEO Kelvin Shepherd wrote.

The income drop is primarily a result of the $50 million spent in the form of restructuring charges associated with the utility's efforts to streamline the organization and drive down costs, amid NDP criticism of Hydro changes related to government policy.

Those efforts included the implementation of buyouts for employees through what the utility dubbed its "voluntary departure program."

Among the changes, Manitoba Hydro reduced its workforce by 800 employees, which is expected to save the utility over $90 million per year. It also reduced its management positions by 26 per cent, a Monday news release said, while Hydro One leadership upheaval in Ontario drove its shares down during comparable governance turmoil.

To improve its financial situation, Hydro has applied for rate increases, even as the Consumers Coalition pushes to have the proposal rejected. The Public Utilities Board offered a 3.6 per cent average rate hike, instead of the 7.9 per cent jump the utility asked for.

In May, when the PUB rendered its decision, it made several recommendations as an alternative to raising rates, including receiving a share of carbon tax revenue and asking the government to help pay for Bipole III.

Hydro is projecting a net income of $70 million for 2018-2019, which includes the impact of the recent rate increase. That total reflects an approximately 20 per cent reduction in net income from 2017-18 after restructuring costs are calculated.


Related News

View more

"Knowledge Gap" Is Contributing To On-the-job Electrical Injuries

BC Hydro Trades Electrical Safety addresses electric contact incidents among trade workers, emphasizing power line hazards, overhead lines clearance, the 3 m rule, jobsite planning, and safety training to prevent injuries during spring and summer.


Key Points

BC Hydro Trades Electrical Safety is guidance and training to reduce power-line contact risks for trade workers.

✅ Stay at least 3 m from overhead power lines and equipment

✅ Plan worksites and spot hazards before starting tasks

✅ Use BC Hydro electrical awareness training near electricity


A BC Hydro report finds serious electrical contact incidents are more common among trades workers, and research shows this is partly due to a knowledge gap in the electricity sector in Canada.

Trade workers were involved in more than 60 per cent of electric contact incidents that led to serious injuries over the last three years, according to BC Hydro.

One-in-five trade workers have also either made contact or had a close call with electric equipment.

A recent worksite electrocution case underscores the consequences of contact.

“New research finds many have had a close call with electricity on the job or have witnessed unsafe work near overhead lines or electrical equipment,” BC Hydro staff said in the report.

“A gap in electrical safety knowledge is a contributing factor in most of these incidents.”

Most electrical contact incidents take place in the spring and summer, when trade workers are working outdoors and are working in close proximity to power lines.

BC Hydro offered tips for trades workers who may work closely to possible electrical contact points:

  • Look up and down – Observe the site beforehand and plan work so you can avoid contact with power lines
  • Stay back – You and your tools should stay at least 3 m away from an overhead power line
  • Call for help – If you come across a fallen power line, or a tree branch or object contacts a line—stay back 10 metres and call 911. Never try and move it yourself. If you must work closer than 3 m to a power line at your worksite, call BC Hydro before you begin.
  • Learn about the risks – BC Hydro offers in-person and online electrical awareness training, such as arc flash training, for anyone who works near electricity.

The report found that 38 per cent of trades workers who participated in the report said they only feel “somewhat informed” about safety measures around working near electricity and 71 per cent were unable to identify the correct distance they should be away from active power lines or electrical equipment.

BC Hydro said trade workers should participate in its electrical awareness training courses, including arc flash training, to make sure all safety measures are taken.


Related News

View more

Energy prices trigger EU inflation, poor worst hit

EU Energy Price Surge is driving up electricity and gas costs, inflation, and cost of living across the EU, prompting tax cuts, price caps, subsidies, and household support measures in France, Italy, Spain, and Germany.


Key Points

A surge in EU gas and electricity costs driving inflation and prompting government subsidies, tax cuts, and price caps.

✅ Low-income EU households now spend 50-70 percent more on energy.

✅ Governments deploy tax cuts, price caps, and direct subsidies.

✅ Gas-dependent power markets drive electricity price spikes.


Higher energy prices, including for natural gas, are pushing up electricity prices and the cost of living for households across the EU, prompting governments to cut taxes and provide financial support to the tune of several billion euros.

In the United Kingdom, households are bracing for high winter energy bills this season.

A series of reports published by Cambridge Econometrics in October and November 2022 found that households in EU countries are spending much more on energy than in 2020 and that governments are spending billions of euros to help consumers pay bills and cut taxes.

In France, for example, the poorest households now spend roughly one-third more on energy than in 2020. Between August 2020 and August 2022, household energy prices increased by 37 percent, while overall inflation increased by 9.2 percent.

“We estimate that the increase in household energy prices make an average French household €410 worse off in 2022 compared to 2020, mostly due to higher gas prices,” said the report.

In response to rising energy prices, the French government has adopted price caps and support measures forecast to cost over €71 billion, equivalent to 2.9 percent of French GDP, according to the U.K.-based consultancy.

In Italy, fossil fuels alone were responsible for roughly 30 percent of the country’s annual rate of inflation during spring 2022, according to Cambridge Econometrics. Unlike in other European countries, retail electricity prices have outpaced other energy prices in Italy and were 112 percent higher in July 2022 than in August 2020, the report found. Over the same time period, retail petrol prices were up 14 percent, diesel up 22 percent, and natural gas up 42 percent.

We estimate that households in the lowest-income quintile now spend about 50 percent more on energy than in 2020.

“We estimate that before government support, an average Italian household will be spending around €1,400 more on energy and fuel bills this year than in 2020,” the report said. “Low-income households are worse affected by the increasing energy prices: we estimate that households in the lowest-income quintile now spend about 50 percent more on energy than in 2020.”

Electricity production in Italy is dominated by natural gas, which has also led to a spike in wholesale electricity prices. In 2010, natural gas accounted for 50 percent of all electricity production. The share of natural gas fell to 33 percent in 2014, but then rose again, reaching 48 percent in 2021, and 56 percent in the first half of 2022, according to the report, as gas filled the gap of record low hydro power production in 2022.

In Spain, where electricity prices have seen extreme spikes, low-income households are now spending an estimated 70% more on energy than in 2020, according to Cambridge Econometrics.


Low-income squeeze
In Spain, low-income households are now spending an estimated 70% more on energy than in 2020, according to Cambridge Econometrics. It noted that the Spanish government has intervened heavily in energy markets by cutting taxes, introducing cash transfers for households, and capping the price of natural gas for power generators. The latter has led to lower electricity prices than in many other EU countries.

These support measures are forecast to cost the Spanish government over €35 billion, equivalent to nearly 3 percent of Spain’s GDP. Yet consumers will still feel the burden of higher costs of living, and rolling back electricity prices may prove difficult in the near term.

In March, electricity prices alone were responsible for 45 percent of year-on-year inflation in Spain but prices have since fallen as a result of government intervention, Cambridge Econometrics said. Between May and July, fossil fuels prices accounted for 19-25 percent of the overall inflation rate, and electricity prices for 16 percent.


Support measures
Rising inflation is also a real challenge in Germany, Europe’s largest economy, where German power prices have surged this year, adding pressure. Also there, higher gas prices are to blame.

“We estimate that the increase in energy prices currently make an average household €735 worse off in 2022 compared to 2020, mostly due to higher gas prices,” Cambridge Econometrics said, in a report focused on Germany.

The German government has introduced a number of support measures in order to help households, businesses and industry to pay energy bills, amid rising heating and electricity costs for consumers, including price caps that are expected to take effect in March next year. Moreover, households’ energy bills for December this year will be paid by the state. According to the report, these interventions will mitigate the impact of higher prices “to some extent”, but the aid measures are forecast to cost the government nearly 5 percent of GDP.


Fossil-fuel effect
In addition to gas, higher coal prices have also pushed up inflation in some countries, and U.S. electricity prices have reached multi-decade highs as inflation endures.

In Poland, which is heavily dependent on coal for electricity generation, fossil fuels accounted for roughly 40 percent of Poland’s overall year-on-year inflation rate in June 2022, which stood at over 14 percent, the consultancy said.

The price of household coal, which is widely used in heating Polish homes, increased by 157 percent between August 2021 and August 2022.

Higher energy prices in Poland are partly due to Polish and EU sanctions against Russian gas and coal. Other drivers are the weakening of the Polish zloty against the U.S. dollar and the euro, and the uptick in global demand after COVID-19 lockdowns, said Cambridge Econometrics.

Electricity prices have risen at a much slower pace than energy for transport and heating, with an annualized increase of 5.1 percent.


Related News

View more

Yet another Irish electricity provider is increasing its prices

Electric Ireland Electricity Price Increase stems from rising wholesale costs as energy suppliers adjust tariffs. Customers face higher electricity bills, while gas remains unchanged; switching provider could deliver savings during winter.


Key Points

A 4% increase in Electric Ireland electricity prices from 1 Feb 2018, driven by wholesale costs; gas unchanged.

✅ 4% electricity rise effective 1 Feb 2018

✅ Increase attributed to rising wholesale energy costs

✅ Switching supplier may reduce bills and boost savings


ELECTRIC IRELAND has announced that it will increase its household electricity prices by 4% from 1 February 2018.

This comes just a week after both Bord Gáis Energy and SSE Airtricity announced increases in their gas and electricity prices, while national efforts to secure electricity supplies continue in parallel.

Electric Ireland has said that the electricity price increase is unavoidable due to the rising wholesale cost of electricity, with EU electricity prices trending higher as well.

The electricity provider said it has no plans to increase residential gas prices at the moment.

Commenting on the latest announcement, Eoin Clarke, managing director of Switcher.ie, said: “This is the third largest energy supplier to announce a price increase in the last week, so the other suppliers are probably not far behind.

“The fact that the rise is not coming into effect until 1 February will be welcomed by Electric Ireland customers who are worried about the rising cost of energy as winter sets in,” he said.

However, any increase is still bad news, especially as a quarter of consumers (27%) say their energy bill already puts them under financial pressure, and EU energy inflation has disproportionately affected lower-income households.

According to Electric Ireland, this will amount to a €2.91 per month increase for an average electricity customer, amounting to €35 per year.

Meanwhile, SSE Airtricity’s change amounts to an increase of 90 cent per week or €46.80 per year for someone with average consumption on their 24hr SmartSaver standard tariff, far below the dramatic Spain electricity price surge seen recently.

Bord Gáis Energy said its announcement will increase a typical gas bill by €2.12 a month and a typical electricity bill by €4.77 a month, reflecting wider trends such as the Germany power price spike reported recently.

In a statement, Bord Gáis Energy said: “The changes, which will take effect from 1st November 2017, are due to significant increases in the wholesale cost of energy as well as higher costs associated with distributing energy on the gas and electricity networks.

“In percentage terms, the increase represents 3.4% in a typical customer’s gas bill and an increase of 5.9% in a typical customer’s electricity bill.”

Clark said that if customers haven’t switched electricity provider in over a year that they should review the deals available at the moment.

“The market is highly competitive so there are huge savings to be made by switching,” he said.

“All suppliers use the same cables to supply electricity to your home, so you don’t need to worry about any loss in service, and you could save up to 324 by switching from typical standard tariffs to the cheapest deals on the market.”


Related News

View more

Sign Up for Electricity Forum’s Newsletter

Stay informed with our FREE Newsletter — get the latest news, breakthrough technologies, and expert insights, delivered straight to your inbox.

Electricity Today T&D Magazine Subscribe for FREE

Stay informed with the latest T&D policies and technologies.
  • Timely insights from industry experts
  • Practical solutions T&D engineers
  • Free access to every issue

Download the 2025 Electrical Training Catalog

Explore 50+ live, expert-led electrical training courses –

  • Interactive
  • Flexible
  • CEU-cerified