Substation Relay Protection Training
Our customized live online or in‑person group training can be delivered to your staff at your location.

- Live Online
- 12 hours Instructor-led
- Group Training Available
Regular Price:
$699
Coupon Price:
$599
BEIJING
—
China Power Demand-Emissions Gap highlights surging grid demand outpacing renewables, with coal filling shortages despite record solar, wind, EV charging, and hydrogen growth, threatening decarbonization targets and net-zero pathways through 2030.
What This Means
China's power demand outpaces renewables, keeping coal dominant and raising emissions risk through the 2020s.
Record solar and wind still lag fast grid demand growth
Coal fills gaps as EV charging and hydrogen loads rise
Forecasts diverge: CEC bullish vs IEA, BNEF conservative
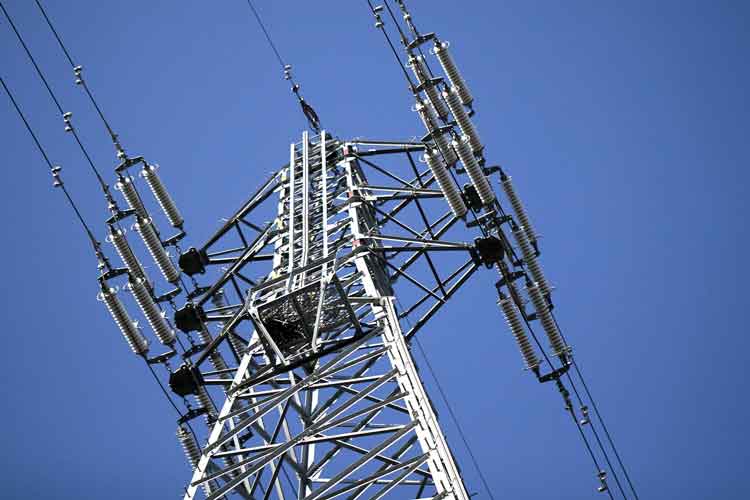
Here’s a new obstacle that could prevent the world finally turning the corner on climate change: Imagine that over the coming decade a whole new economy the size of Russia were to pop up out of nowhere. With the world’s fourth-largest electricity sector and largest burden of power plant emissions after China, the U.S. and India, this new economy on its own would be enough to throw out efforts to halt global warming — especially if it keeps on growing through the 2030s.
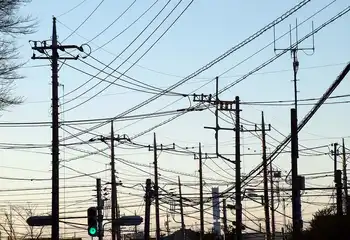
That’s the risk inherent in China’s seemingly insatiable appetite for grid power, as surging electricity demand is putting systems under strain worldwide.
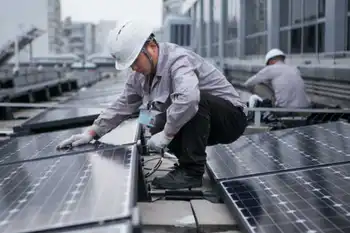
From the cracking pace of renewable build-out last year, you might think the country had broken the back of its carbon addiction. A record 55 gigawatts of solar power and 48 gigawatts of wind were connected — comparable to installing the generation capacity of Mexico in less than 12 months. This year will see an even faster pace, with 93 GW of solar and 50 GW of wind added, according to a report last week from the China Electricity Council, an industry association.
That progress could in theory see the country’s power sector emissions peak within months, rather than the late-2020s date the government has hinted at. Combined with a smaller quantity of hydro and nuclear, low-emissions sources will probably add about 310 terawatt-hours to zero-carbon generation this year. That 3.8% increase would be sufficient to power the U.K.
Countries that have reached China’s levels of per-capita electricity consumption (already on a par with most of Europe) typically see growth rates at less than half that level, even as global power demand has surged past pre-pandemic levels in recent years. Grid supply could grow at a faster pace than Brazil, Iran, South Korea or Thailand managed over the past decade without adding a ton of additional carbon to the atmosphere.
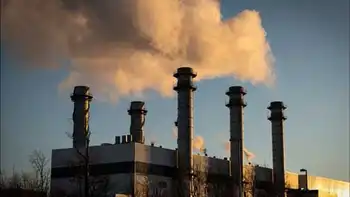
There’s a problem with that picture, however. If electricity demand grows at an even more headlong pace, there simply won’t be enough renewables to supply the grid. Fossil fuels, overwhelmingly coal, will fill the gap, a reminder of the iron law of climate dynamics in energy transitions.
Such an outcome looks distinctly possible. Electricity consumption in 2021 grew at an extraordinary rate of 10%, and will increase again by between 5% and 6% this year, according to the CEC. That suggests the country is on pace to match the CEC’s forecasts of bullish grid demand over the coming decade, with generation hitting 11,300 terawatt-hours in 2030. External analysts, such as the International Energy Agency and BloombergNEF, envisage a more modest growth to around 10,000 TWh.
The difference between those two outlooks is vast — equivalent to all the electricity produced by Russia or Japan. If the CEC is right and the IEA and BloombergNEF are wrong, even the furious rate of renewable installations we’re seeing now won’t be enough to rein in China’s power-sector emissions.
Who’s correct? On one hand, it’s fair to say that power planners usually err on the side of overestimation. If your forecast for electricity demand is too high, state-owned generators will be less profitable than they otherwise would have been — but if it’s too low, you’ll see power cuts and shutdowns like China witnessed last autumn, with resulting power woes affecting supply chains beyond its borders.
On the other hand, the decarbonization of China’s economy itself should drive electricity demand well above what we’ve seen in the past, with some projections such as electricity meeting 60% of energy use by 2060 pointing to a profound shift. Some 3.3 million electric vehicles were sold in 2021 and BloombergNEF estimates a further 5.7 million will be bought in 2022. Every million EVs will likely add in the region of 2 TWh of load to the grid. Those sums quickly mounts up in a country where electric drivetrains are taking over a market that shifts more than 25 million new cars a year.
Decarbonizing industry, a key element on China’s road to zero emissions, could also change the picture. The IEA sees the country building 25 GW of electolysers to produce hydrogen by 2030, enough to consume some 200 TWh on their own if run close to full-time.
That’s still not enough to justify the scale of demand being forecast, though. China is already one of the least efficient countries in the world when it comes to translating energy into economic growth, and despite official pressure on the most wasteful, so called “dual-high” industries such as steel, oil refining, glass and cement, its targets for more thrifty energy usage remain pedestrian.


The countries that have decarbonized fastest are those, such as Germany, the U.K and the U.S., where Americans are using less electricity, that have seen power demand plateau or even decline, giving new renewable power a chance to swap out fossil-fired generators without chasing an ever-increasing burden on the grid. China’s inability to do this as its population peaks and energy consumption hits developed-country levels isn’t a sign of strength.
Instead, it’s a sign of a country that’s chronically unable to make the transition away from polluting heavy industry and toward the common prosperity and ecological civilization that its president keeps promising. Until China reins in that credit-fueled development model, the risks to its economy and the global climate will only increase.
Related News
Related News

Ontario Providing Electricity Relief to Families, Small Businesses and Farms During COVID-19
Ontario TOU Electricity Rate Relief offers 24/7 fixed off-peak pricing at 10.1¢/kWh, suspending time-of-use tiers…
View more
Ontario government wants new gas plants to boost electricity production
Ontario Gas Plant Expansion aims to boost grid reliability as nuclear refurbishments proceed, using natural…
View more
Solar Now ‘cheaper Than Grid Electricity’ In Every Chinese City, Study Finds
China Solar Grid Parity signals unsubsidized industrial and commercial PV, rooftop solar, and feed-in tariff…
View more

Electric vehicles are a hot topic in southern Alberta
Canada Electric Vehicle Adoption is accelerating as EV range doubles, fast-charging networks expand along the…
View more
USDA Grants $4.37 Billion for Rural Energy Upgrades
USDA Rural Energy Infrastructure Funding boosts renewable energy, BESS, and transmission upgrades, delivering grid modernization,…
View more
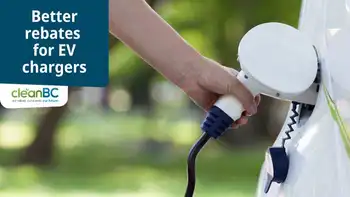
British Columbians can access more in EV charger rebates
B.C. EV Charging Rebates boost CleanBC incentives as NRCan and ZEVIP funding covers up to…
View more
Sign Up for Electricity Forum’s Newsletter
Stay informed with our FREE Newsletter — get the latest news, breakthrough technologies, and expert insights, delivered straight to your inbox.
Electricity Today T&D Magazine Subscribe for FREE

Stay informed with the latest T&D policies and technologies.
- Timely insights from industry experts
- Practical solutions T&D engineers
- Free access to every issue

