Protective Relay Training - Basic
Our customized live online or in‑person group training can be delivered to your staff at your location.

- Live Online
- 12 hours Instructor-led
- Group Training Available
Regular Price:
$699
Coupon Price:
$599
AREVAÂ’s Transmission and Distribution (T&D) Division has created a center of excellence at its existing site in La Prairie, Quebec.
As of December 1st, 2007, Protection, Substation Automation and associated service activities, currently conducted out of AREVA‘s Bethlehem, Pennsylvania facility in the U.S., are transferred to its La Prairie site.
All AREVA‘s Measurement Products (usually conducted under the BiTRONICS brand) will continue to be designed, manufactured, delivered and served from AREVA’s factory in Bethlehem and are not affected by the transfer.
AREVAÂ’s North American Protection and Control Center of Excellence will act as the repair, maintenance and technical support center for the full installed base of Protection products and Substation Automation systems in North America.
Damien Tholomier, Commercial Director of AREVA’s North American Automation products said, “We are constantly striving to provide quality, reliable and high-performance products and systems, along with outstanding service based on fast response critical to operations. The creation of this center of excellence in our existing site in La Prairie, Montreal is just another example of AREVA’s dedication to its North American customers.”
Related News
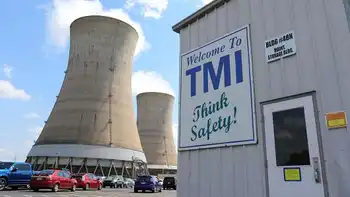
Three Mile Island at center of energy debate: Let struggling nuclear plants close or save them
Three Mile Island Nuclear Debate spotlights subsidies, carbon pricing, wholesale power markets, grid reliability, and…
View more
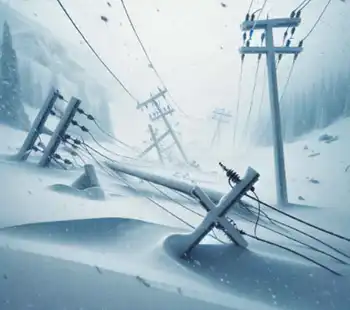
Canadian Electricity Grids Increasingly Exposed to Harsh Weather
North American Grid Reliability faces extreme weather, climate change, demand spikes, and renewable variability; utilities,…
View more

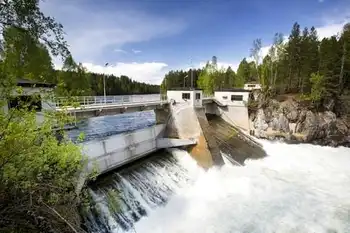
Electrifying Manitoba: How hydro power 'absolutely revolutionized' the province
Manitoba Electrification History charts arc lights, hydroelectric dams, Winnipeg utilities, transmission lines, rural electrification, and…
View more

IEA: Electricity investment surpasses oil and gas for the first time
Electricity Investment Surpasses Oil and Gas 2016, driven by renewable energy, power grids, and energy…
View more
Lawmakers question FERC licensing process for dams in West Virginia
FERC Hydropower Licensing Dispute centers on FERC authority, Clean Water Act compliance, state water quality…
View more

BC Hydro Expects To See Electricity Usage Rise This Holiday Season
BC Hydro Holiday Electricity Usage is set to rise as energy demand increases during peak…
View more
Sign Up for Electricity Forum’s Newsletter
Stay informed with our FREE Newsletter — get the latest news, breakthrough technologies, and expert insights, delivered straight to your inbox.
Electricity Today T&D Magazine Subscribe for FREE

Stay informed with the latest T&D policies and technologies.
- Timely insights from industry experts
- Practical solutions T&D engineers
- Free access to every issue

