Enabling storage in Ontario's electricity system


energy storage

NFPA 70e Training - Arc Flash

Our customized live online or in‑person group training can be delivered to your staff at your location.

  • Live Online
  • 6 hours Instructor-led
  • Group Training Available
Regular Price:
$199
Coupon Price:
$149
Reserve Your Seat Today

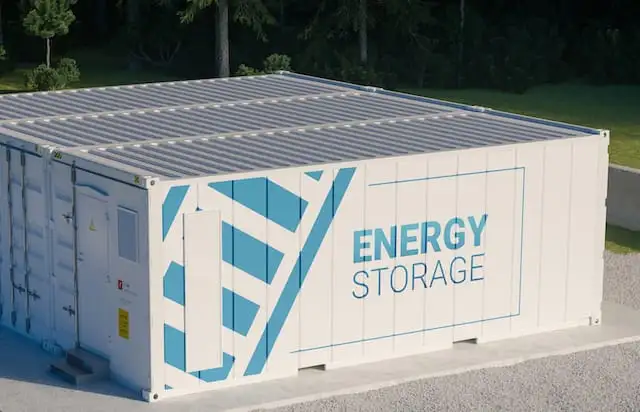
OEB Energy Storage Integration advances DERs and battery storage through CDM guidelines, streamlined connection requirements, IESO-aligned billing, grid modernization incentives, and the Innovation Sandbox, providing regulatory clarity and consumer value across Ontario's electricity system.


Key Points

A suite of OEB initiatives enabling storage and DERs via modern rules, cost recovery, billing reforms, and pilots.

✅ Updated CDM guidelines recognize storage at all grid levels.

✅ Standardized connection rules for DERs effective Oct 1, 2022.

✅ Innovation Sandbox supports pilots and temporary regulatory relief.


The energy sector is in the midst of a significant transition, where energy storage is creating new opportunities to provide more cost-effective, reliable electricity service. The OEB recognizes it has a leadership role to play in providing certainty to the sector while delivering public value, and a responsibility to ensure that the wider impacts of any changes to the regulatory framework, including grid rule changes, are well understood. 

Accordingly, the OEB has led a host of initiatives to better enable the integration of storage resources, such as battery storage, where they provide value for consumers.

Energy storage integration – our journey 
We have supported the integration of energy storage by:

Incorporating energy storage in Conservation and Demand Management (CDM) Guidelines for electricity distributors. In December 2021, the OEB released updated CDM guidelines that, among other things, recognize storage – either behind-the-meter, at the distribution level or the transmission level – as a means of addressing specific system needs. They also provide options for distributor cost recovery, aligning with broader industrial electricity pricing discussions, where distributor CDM activities also earn revenues from the markets administered by the Independent Electricity System Operator (IESO).
 
Modernizing, standardizing and streamlining connection requirements, as well as procedures for storage and other DERs, to help address Ontario's emerging supply crunch while improving project timelines. This was done through amendments to the Distribution System Code that take effect October 1, 2022, as part of our ongoing DER Connections Review.
 
Facilitating the adoption of Distributed Energy Resources (DERs), which includes storage, to enhance value for consumers by considering lessons from BESS in New York efforts. In March 2021, we launched the Framework for Energy Innovation consultation to achieve that goal. A working group is reviewing issues related to DER adoption and integration. It is expected to deliver a report to the OEB by June 2022 with recommendations on how electricity distributors can assess the benefits and costs of DERs compared to traditional wires and poles, as well as incentives for distributors to adopt third-party DER solutions to meet system needs.
 
Examining the billing of energy storage facilities. A Generic Hearing on Uniform Transmission Rates is underway. In future phases, this proceeding is expected to examine the basis for billing energy storage facilities and thresholds for gross-load billing. Gross-load billing demand includes not just a customer’s net load, but typically any customer load served by behind-the-meter embedded generation/storage facilities larger than one megawatt (or two megawatts if the energy source is renewable).
 
Enabling electricity distributors to use storage to meet system needs. Through a Bulletin issued in August 2020, we gave assurance that behind-the-meter storage assets may be considered a distribution activity if the main purpose is to remediate comparatively poor reliability of service.
 
Offering regulatory guidance in support of technology integration, including for storage, through our OEB Innovation Sandbox, as utilities see benefits across pilot deployments. Launched in 2019, the Innovation Sandbox can also provide temporary relief from a regulatory requirement to enable pilot projects to proceed. In January 2022, we unveiled Innovation Sandbox 2.0, which improves clarity and transparency while providing opportunities for additional dialogue. 
Addressing the barriers to storage is a collective effort and we extend our thanks to the sector organizations that have participated with us as we advanced these initiatives. In that regard, we provided an update to the IESO on these initiatives for a report it submitted to the Ministry of Energy, which is also exploring a hydrogen economy to support decarbonization.

Related News

Ukraine sees new virtue in wind power: It's harder to destroy

Ukraine Wind Energy Resilience shields the grid with wind power along the Black Sea, dispersing turbines to withstand missile attacks, accelerate clean energy transition, aid EU integration, and strengthen energy security and rapid recovery.


Key Points

A strategy in Ukraine using wind farms to harden the grid, ensure clean power, and speed recovery from missile strikes.

✅ Distributed turbines reduce single-point-of-failure risk

✅ Faster repair of substations and lines than power plants

✅ Supports EU-aligned clean energy and grid security goals


The giants catch the wind with their huge arms, helping to keep the lights on in Ukraine — newly built windmills, on plains along the Black Sea.

In 15 months of war, Russia has launched countless missiles and exploding drones at power plants, hydroelectric dams and substations, trying to black out as much of Ukraine as it can, as often as it can, even amid talk of limiting attacks on energy sites that has surfaced, in its campaign to pound the country into submission.

The new Tyligulska wind farm stands only a few dozen miles from Russian artillery, but Ukrainians say it has a crucial advantage over most of the country’s grid, helping stabilize the system even as electricity exports have occasionally resumed under fire.

A single, well-placed missile can damage a power plant severely enough to take it out of action, but Ukrainian officials say that doing the same to a set of windmills — each one tens of meters apart from any other — would require dozens of missiles. A wind farm can be temporarily disabled by striking a transformer substation or transmission lines, but these are much easier to repair than power plants.

“It is our response to Russians,” said Maksym Timchenko, CEO of DTEK Group, the company that built the turbines in the southern Mykolaiv region — the first phase of what is planned as Eastern Europe’s largest wind farm. “It is the most profitable and, as we know now, most secure form of energy.”

Ukraine has had laws in place since 2014 to promote a transition to renewable energy, both to lower dependence on Russian energy imports, with periods when electricity exports resumed to neighbors, and because it was profitable. But that transition still has a long way to go, and the war makes its prospects, like everything else about Ukraine’s future, murky.

In 2020, 12% of Ukraine’s electricity came from renewable sources — barely half the percentage for the European Union. Plans for the Tyligulska project call for 85 turbines producing up to 500 megawatts of electricity. That’s enough for 500,000 apartments — an impressive output for a wind farm, but less than 1% of the country’s prewar generating capacity.

After the Kremlin began its full-scale invasion of Ukraine in February 2022, the need for new power sources became acute, prompting deliveries such as a mobile gas turbine power plant to bolster capacity. Russia has bombarded Ukraine’s power plants and cut off delivery of the natural gas that fueled some of them.

Russian occupation forces have seized a large part of the country’s power supply, and Russia has built power lines to reactivate the Zaporizhzhia plant in occupied territory, ensuring that its output does not reach territory still held by Ukraine. They hold the single largest generator, the 5,700-megawatt Zaporizhzhia Nuclear Power Plant, which has been damaged repeatedly in fighting and has stopped transmitting energy to the grid, with UN inspectors warning of mines at the site during recent visits. They also control 90% of Ukraine’s renewable energy plants, which are concentrated in the southeast.

The postwar recovery plans Ukraine has presented to supporters including the European Union, which it hopes to join, feature a major new commitment to clean energy, even as a controversial proposal on Ukraine’s nuclear plants continues to stir debate.


Related News

View more

Canada set to hit 5 GW milestone

Canada Solar Capacity Outlook 2022-2050 projects 500 MW new PV in 2022 and 35 GW by 2050, driven by renewables policy, grid parity, NREL analysis, IEA-PVPS data, and competitive utility-scale photovoltaic costs.


Key Points

An evidence-based forecast of Canadian PV additions to 35 GW by 2050, reflecting policy, costs, and grid parity trends.

✅ 500 MW PV expected in 2022; cumulative capacity near 5 GW

✅ NREL outlook sees 35 GW by 2050 on cost competitiveness

✅ Policy shifts, ITCs, coal retirements accelerate solar uptake


Canada is set to install 500 MW of new solar in 2022, bringing its total capacity to about 5 GW, according to data from Canmet Energy, even as the Netherlands outpaces Canada in solar power generation. The country is expected to hit 35 GW of total solar capacity by 2050.

Canada’s cumulative solar capacity is set to hit 5 GW by the end of this year, according to figures from the federal government’s Canmet Energy lab. The country is expected to add around 500 MW of new solar capacity, from 944 MW last year, according to the International Energy Agency Photovoltaic Power Systems Programme (IEA-PVPS), which recently published a report on PV applications in Canada, even as solar demand lags in Canada.

“If we look at the recent averages, Canada has installed around 500 MW annually. I expect in 2022 it will be at least 500 MW,” said Yves Poissant, research manager at Canmet Energy. “Last year it was 944 MW, mainly because of a 465 MW centralized PV power plant installed in Alberta, where the Prairie Provinces are expected to lead national renewable growth.”

The US National Renewable Energy Laboratory (NREL) studied renewables integration and concluded that Canada’s cumulative solar capacity will increase sevenfold to 35 GW by 2050, driven by cost competitiveness and that zero-emissions by 2035 is achievable according to complementary studies.

Canada now produces 80% of its electricity from power sources other than oil. Hydroelectricity leads the mix at 60%, followed by nuclear at 15%, wind at 7%, gas and coal at 7%, and PV at just 1%. While the government aims to increase the share of green electricity to 90% by 2030 and 100% by 2050, zero-emission electricity by 2035 is considered practical and profitable, yet it has not set any specific goals for PV. Each Canadian province and territory is left to determine its own targets.

“Without comprehensive pan-Canadian policy framework with annual capacity targets, PV installation in the coming years will likely continue to be highly variable across the provinces and territories, especially after Ontario scrapped a clean energy program, which scaled back growth projections. Further policies mechanisms are needed to allow PV to reach its full potential,” the IEA-PVPS said.

Popular content
Canada recently introduced investment tax credits for renewables to compete with the United States, but it is still far from being a solar powerhouse, with some experts calling it a solar laggard today. That said, the landscape has started to change in the past five years.

“Some laws have been put in place to retire coal plants by 2025. That led to new opportunities to install capacity,” said Poissant. “We expect the newly installed capacity will consist mostly of wind, but also solar.”

The cost of solar has become more competitive and the residential sector is now close to grid parity, according to Poissant. For utility-scale projects, old hydroelectric dams are still considerably cheaper than solar, but newly built installations are now more expensive than solar.

“Starting 2030, solar PV will be cost competitive compared to wind,” Poissant said.


Related News

View more

US renewable energy hit record 28% in April.

U.S. Renewable Energy Record 28% signals a cleaner power grid as wind, solar, and hydroelectric output soar; EIA data shows cost-competitive clean energy reshaping the electricity mix and reducing carbon emissions across regions.


Key Points

EIA-reported April share of electricity from wind, solar, and hydro, reflecting cost-driven growth in U.S. clean power.

✅ Wind, solar additions dominated recent U.S. capacity buildouts

✅ Lower levelized costs make renewables most competitive

✅ Seasonal factors and outages lowered fossil and nuclear output


The amount of electricity generated by renewable resources hit a record 28% in April, a breakthrough number that shows how important renewable energy has become in U.S. energy markets as it surpassed coal in 2022 overall.

"It's a 'Wow' moment," said Peter Kelly-Detwiler, an energy analyst and author of "The Energy Switch," a recent book about the transition to a carbon-free energy economy.

The percentage of U.S. electricity produced by renewable energy from wind, solar and hydroelectric dams has been steadily rising, from 8.6% in April 2001 to this April's 28%. Those numbers were released this week by the U.S. Energy Information Administration, which tracks energy data for the nation.

What explains the surge?
There are several reasons. At the top is that wind and solar installations dominated U.S. energy buildouts.

"Basically, the only things we've added to the grid in the past decade are wind, solar and natural gas," said Harrison Fell, an economist and engineer at Columbia University, where he co-leads the Power Sector and Renewables Research Initiative.

That's happening for two reasons. The first is cost. Renewables are simply the most economically competitive power currently available, Kelly-Detwiler said.

In 2021, the cost of producing a megawatt-hour of electricity from a new wind turbine was $26 to $50. The same amount of electricity from the cheapest type of natural gas plant ranged from $45 to $74, according to Lazard, a financial advisory firm that publishes annual estimates of the cost of producing electricity. 

Federal and state mandates and incentives to increase the amount of clean energy used also help, Fell said, as renewables reached 25.5% of U.S. electricity recently. 

"When you do the math on what's the most profitable thing to add, it's often going to be wind and solar at this stage," he said.

Was weather a factor?
Yes. April tends to be a particularly windy month, and this spring was windier than most, Fell said.

There's also less power coming into the grid from fossil fuels and nuclear in the spring. That's because electricity demand is generally lower because of the mild weather and fossil fuel and nuclear power plants use the time for maintenance and refueling, which reduces their production, he said.

Another surprise was that in April, wind and solar power together produced more electricity than nuclear plants nationwide. 

Historically, nuclear power plants, which are carbon-neutral, have reliably produced about 20% of America's electricity. In April that number dropped to 18% while wind and solar combined stood at 19.6%.

The nuclear decrease is partly a result of the shutdown of two plants in the past year, Indian Point in New York state and Palisades in Michigan, as well as scheduled closures for maintenance.

Will the trend continue?
When all U.S. carbon-neutral energy sources are added together – nuclear, wind, hydroelectric and solar – almost 46% of U.S. electricity in April came from sources that don't contribute greenhouse gases to the environment, federal data shows.  

"It's a milestone," Kelly-Detwiler said. "But in a few years, we'll look back and say, 'This was a nice steppingstone to the next 'Wow!' moment."


Related News

View more

Harbour Air's electric aircraft a high-flying example of research investment

Harbour Air Electric Aircraft Project advances zero-emission aviation with CleanBC Go Electric ARC funding, converting seaplanes to battery-electric power, cutting emissions, enabling commercial passenger service, and creating skilled clean-tech jobs through R&D and electrification.


Key Points

Harbour Air's project electrifies seaplanes with CleanBC ARC support to enable zero-emission flights and cut emissions.

✅ $1.6M CleanBC ARC funds seaplane electrification retrofit

✅ Target: passenger-ready, zero-emission commercial service

✅ Creates 21 full-time clean-tech jobs in British Columbia


B.C.’s Harbour Air Seaplanes is building on its work in clean technology to decarbonize aviation, part of an aviation revolution underway, and create new jobs with support from the CleanBC Go Electric Advanced Research and Commercialization (ARC) program.

”Harbour Air is decarbonizing aviation and elevating the company to new altitudes as a clean-technology leader in B.C.'s transportation sector,” said Bruce Ralston, Minister of Energy, Mines and Low Carbon Innovation. “With support from our CleanBC Go Electric ARC program, Harbour Air's project not only supports our emission-reduction goals, but also creates good-paying clean-tech jobs, exemplifying the opportunities in the low-carbon economy.”

Harbour Air is receiving almost $1.6 million from the CleanBC Go Electric ARC program for its aircraft electrification project. The funding supports Harbour Air’s conversion of an existing aircraft to be fully electric-powered and builds on its successful December 2019 flight of the world’s first all-electric commercial aircraft, and subsequent first point-to-point electric flight milestones.

That flight marked the start of the third era in aviation: the electric age. Harbour Air is working on a new design of the electric motor installation and battery systems to gain efficiencies that will allow carrying commercial passengers, as it eyes first electric passenger flights in 2023. Approximately 21 full-time jobs will be created and sustained by the project.

“CleanBC is helping accelerate world-leading clean technology and innovation at Harbour Air that supports good jobs for people in our communities,” said George Heyman, Minister of Environment and Climate Change Strategy. “Once proven, the technology supports a switch from fossil fuels to advanced electric technology, and will provide a clean transportation option, such as electric ferries, that reduces pollution and shows the way forward for others in the sector.”

Harbour Air is a leader in clean-technology adoption. The company has also purchased a fully electric, zero-emission passenger shuttle bus to pick up and drop off passengers between Harbour Air’s downtown Vancouver and Richmond locations, and the Vancouver International Airport, where new EV chargers support travellers.

“It is great to see the Province stepping up to support innovation,” said Greg McDougall, Harbour Air CEO and ePlane test pilot. “This type of funding confirms the importance of encouraging companies in all sectors to focus on what they can be doing to look at more sustainable practices. We will use these resources to continue to develop and lead the transportation industry around the world in all-electric aviation.”

In total, $8.18 million is being distributed to 18 projects from the second round of CleanBC Go Electric ARC program funding. Recipients include Damon Motors and IRDI System, both based on the Lower Mainland. The 15 other successful projects will be announced this year.

The CleanBC Go Electric ARC program supports the electric vehicle (EV) sector in B.C., which leads the country in going electric, by providing reliable and targeted support for research and development, commercialization and demonstration of B.C.-based EV technologies, services and products.

“This project is a great example of the type of leading-edge innovation and tech advancements happening in our province,” said Brenda Bailey, Parliamentary Secretary for Technology and Innovation. “By further supporting the development of the first all-electric commercial aircraft, we are solidifying our position as world leaders in innovation and using technology to change what is possible.”

The CleanBC Roadmap to 2030 is B.C.’s plan to expand and accelerate climate action, including a major hydrogen project, building on the province’s natural advantages – abundant, clean electricity, high-value natural resources and a highly skilled workforce. It sets a path for increased collaboration to build a British Columbia that works for everyone.


Related News

View more

Is residential solar worth it?

Home Solar Cost vs Utility Bills compares electricity rates, ROI, incentives, and battery storage, explaining payback, financing, and grid fees while highlighting long-term savings, rate volatility, and backup power resilience for homeowners.


Key Points

Compares home solar pricing and financing to utility rates, outlining savings, incentives, ROI, and backup power value.

✅ Average retail rates rose 59% in 20 years; volatility persists

✅ Typical 7.15 kW system costs $18,950 before incentives

✅ Federal ITC and state rebates improve ROI and payback


When shopping for a home solar system, sometimes the quoted price can leave you wondering why someone would move forward with something that seems so expensive. 

When compared with the status quo, electricity delivered from the utility, the price may not seem so high after all. First, pv magazine will examine the status quo, and how much you can expect to pay for power if you don’t get solar panels. Then, we will examine the average cost of solar arrays today and introduce incentives that boost home solar value.

The cost of doing nothing

Generally, early adopters have financially benefited from going solar by securing price certainty and stemming the impact of steadily increasing utility-bill costs, particularly for energy-insecure households who pay more for electricity.

End-use residential electric customers pay an average of $0.138/kWh in the United States, according to the Energy Information Administration (EIA). In California, that rate is $0.256/kWh, it averages $0.246/kWh across New England, $0.126/kWh in the South Atlantic region, and $0.124/kWh in the Mountain West region.

EIA reports that the average home uses 893 kWh per month, so based on the average retail rate of $0.138/kWh, that’s an electric bill of about $123 monthly, or $229 monthly in California.

Over the last 20 years, EIA data show that retail electricity prices have increased 59% across the United States, with evidence indicating that renewables are not making electricity more expensive, suggesting other factors have driven costs higher, or 2.95% each year.

This means based on historical rates, the average US homeowner can expect to pay $39,460 over the next 20 years on electricity bills. On average, Californians could pay $73,465 over 20 years.

Recent global events show just how unstable prices can be for commodities, and energy is no exception here, with solar panel sales doubling in the UK as homeowners look to cut soaring bills. What will your utility bill cost in 20 years?

These estimated bills also assume that energy use in the home is constant over 20 years, but as the United States electrifies its homes, adds more devices, and adopts electric vehicles, it is fair to expect that many homeowners will use more electricity going forward.

Another factor that may exacerbate rate raising is the upgrade of the national transmission grid. The infrastructure that delivers power to our homes is aging and in need of critical upgrades, and it is estimated that a staggering $500 billion will be spent on transmission buildout by 2035. This half-trillion-dollar cost gets passed down to homeowners in the form of raised utility bill rates.

The benefit of backup power may increase as time goes on as well. Power outages are on the rise across the United States, and recent assessments of the risk of power outages underscore that outages related to severe weather events have doubled in the last 20 years. Climate change-fueled storms are expected to continue to rise, so the role of battery backup in providing reliable energy may increase significantly.

The truth is, we don’t know how much power will cost in 20 years. Though it has increased 59% across the nation in the last 20 years, there is no way to be certain what it will cost going forward. That is where solar has a benefit over the status quo. By purchasing solar, you are securing price certainty going forward, making it easier to budget and plan for the future.

So how do these costs compare to going solar?

Cost of solar

As a general trend, prices for solar have fallen. In 2010, it cost about $40,000 to install a residential solar system, and since then, prices have fallen by as much as 70%, and about 37% in the last five years. However, prices have increased slightly in 2022 due to shipping costs, materials costs, and possible tariffs being placed on imported solar goods, and these pressures aren’t expected to be alleviated in the near-term.

When comparing quotes, the best metric for an apples-to-apples comparison is the cost per watt. Price benchmarking by the National Renewable Energy Laboratory shows the average cost per watt for the nation was $2.65/W DC in 2021, and the average system size was 7.15 kW. So, an average system would cost about $18,950. With 12.5 kWh of battery energy storage, the average cost was $4.26/W, representing an average price tag of $30,460 with batteries included.

The prices above do not include any incentives. Currently, the federal government applies a 26% investment tax credit to the system, bringing down system costs for those who qualify to $14,023 without batteries, and $22,540 with batteries. Compared to the potential $39,460 in utility bills, buying a solar system outright in cash appears to show a clear financial benefit.

Many homeowners will need financing to buy a solar system. Shorter terms can achieve rates as low as 2.99% or less, but financing for a 20-year solar loan typically lands between 5% to 8% or more. Based on 20-year, 7% annual percentage rate terms, a $14,000 system would total about $26,000 in loan payments over 20 years, and the system with batteries included would total about $42,000 in loan payments.

Often when you adopt solar, the utility will still charge you a grid access fee even if your system produces 100% of your needs. These vary from utility to utility but are often around $10 a month. Over 20 years, that equates to about $2,400 that you’ll still need to pay to the utility, plus any costs for energy you use beyond what your system provides.

Based on these average figures, a homeowner could expect to see as much as $12,000 in savings with a 20-year financed system. Homeowners in regions whose retail energy price exceeds the national average could see savings in multiples of that figure.

Though in this example batteries appear to be marginally more expensive than the status quo over a 20-year term, they improve the home by adding the crucial service of backup power, and as battery costs continue to fall they are increasingly being approved to participate in grid services, potentially unlocking additional revenue streams for homeowners.

Another thing to note is most solar systems are warranted for 25 years rather than the 20 used in the status quo example. A panel can last a good 35 years, and though it will begin to produce less in old age, any power produced by a panel you own is money back in your pocket.

Incentives and home value

Many states have additional incentives to boost the value of solar, too, and federal proposals to increase solar generation tenfold could remake the U.S. electricity system. Checking the Database of State Incentives for Renewables (DSIRE) will show the incentives available in your state, and a solar representative should be able to walk you through these benefits when you receive a quote. State incentives change frequently and vary widely, and in some cases are quite rich, offering thousands of dollars in additional benefits.

Another factor to consider is home value. A study by Zillow found that solar arrays increase a home value by 4.1% on average. For a $375,000 home, that’s an increase of $15,375 in value. In most states home solar is exempt from property taxes, making it a great way to boost value without paying taxes for it.

Bottom line

We’ve shared a lot of data on national averages and the potential cost of power going forward, but is solar for you? In the past, early adopters have been rewarded for going solar, and celebrate when they see $0 electric bills paid to the utility company.

Each home is different, each utility is different, and each homeowner has different needs, so evaluating whether solar is right for your home will take a little time and analysis. Representatives from solar companies will walk you through this analysis, and it’s generally a good rule of thumb to get at least three quotes for comparison.

A great resource for starting your research is the Solar Calculator developed by informational site SolarReviews. The calculator offers a quote and savings estimate based on local rates and incentives available to your area. The website also features reviews of installers, equipment, and more.

Some people will save tens of thousands of dollars in the long run with solar, while others may witness more modest savings. Solar will also provide the home clean, local energy, and U.S. solar generation is projected to reach 20% by 2050 as capacity expands, making an impact both on mitigating climate change and in supporting local jobs.

One indisputable benefit of solar is that it will offer greater clarity into what your electricity bills will cost over the next couple of decades, rather than leaving you exposed to whatever rates the utility company decides to charge in the future.


Related News

View more

UK electric car inquiries soar during fuel supply crisis

UK Petrol Shortages Drive EV Adoption as fuel crisis spurs electric vehicles, plug-in car demand, home charging, lower running costs, zero-emission mobility, ULEZ compliance, accelerating the shift from diesel to battery EVs.


Key Points

Fuel shortages push drivers to EVs, boosting inquiries and sales while highlighting the convenience of home charging.

✅ Surge in EV dealer inquiries and test drives

✅ Home charging avoids queues and fuel shortages

✅ Policy signals: ULEZ expansion, 2030 ICE ban


Sellers of plug-in vehicles say petrol shortages are driving people to adopt the new technology as the age of electric cars accelerates worldwide.

As petrol stations in parts of the UK started running out of fuel on Friday, business at Martin Miller’s electric car dealership in Guildford, Surrey, started soaring.

After what ended up being his company EV Experts busiest day ever, interest does not appear to be dying down. This week the diary is booked up with test drives and the business is low on stock amid supply constraints.

“People buy electric cars for environmental reasons, for cost-saving reasons and because the technology’s great, even though higher upfront prices remain a concern,” he said. “But Friday was one of those moments where people said, ‘Do you know what, this is a sign that we need to go electric’.”

While scenes of chaos play out at petrol stations across the country amid shortages, for many electric vehicle (EV) dealers the fuel crisis has led to an unexpected surge in inquiries and sales, even as some question an electric-car revolution narrative today.

EVA England, a non-profit representing new and prospective EV drivers, reports a rise in electric car inquiries and in interest at EV dealers, particularly in the last week.

“Saturday was bonkers but Friday even surpassed that, it was very strange,” said Miller, who founded his company four years ago. “I’ve now got trade-in cars with no petrol to move them.”

Along with existing factors such as the expansion of London’s ultra-low emission zone, the fuel crisis has proved to be another trigger point, he said. “People were using it as ‘this is the moment where I’m not going to put this off any longer’.”

The EV market is no longer the preserve of innovators and early adopters, he said, with the most popular models the Nissan Leaf, Volkswagen ID 3 and Jaguar I-Pace.

Ben Strzalko, the owner of Electric Cars UK in Leyland, Lancashire, said that as a small business it would take a few months to feel the knock-on effect of the fuel crisis on sales.

But every time there are problems with petrol or diesel, he said they acted as “one more tick for people making that transition to electric cars”.

He said “a lot of electric car owners will be chuffed to bits this last week” being able to plug in their cars at home. And as an EV driver himself, he admitted feeling a little smug as he drove past queues of 20 cars outside petrol stations over the weekend in his Tesla.

Matt Cleevely, the owner of Cleevely Electric Vehicles in Cheltenham, Gloucestershire, which specialises in used EVs, had a surge of inquiries over the weekend and on Monday morning from customers citing the fuel crisis as a reason for switching to electric.

He expects enthusiasm to continue rising, with petrol shortages adding “fuel to the fire”.

Although he feels sorry for non-EV drivers who have been unable to get fuel, he said as an electric car owner it was “very nice” not to have to worry about where to get petrol at the weekend.

“It’s very convenient that we’ve been able to just fuel up on our driveway. It’s one of the biggest pros of having an electric vehicle.”

The National Franchised Dealers Association also said multiple dealers have reported a spike in EV enquiries since the start of the crisis.

The Society of Motor Manufacturers and Traders reported “bumper growth” in the sale of plug-in cars in July, reflecting broader global market growth in recent years, with battery electric vehicles comprising 9% of sales. Plug-in hybrids accounted for 8% of sales and hybrid electric vehicles nearly 12%. Also in July, more electric vehicles were registered than diesel for the second consecutive month.

The UK has pledged to ban the sale of new petrol and diesel cars by 2030 and of new hybrids by 2035, a timeline that aligns with expectations that within a decade most driving could be electric.

Warren Philips, the volunteer communities director at EVA England, said the tipping point for EVs had already been reached but the fuel crisis “underlines how electric cars could work for the majority of people”.

He added: “The interest is already there, this just adds to it. And going forward with things like Cop26, with the climate crisis, with the cost of fuel probably going to rise … people will start looking at electric cars where you just skip that entire step.”


Related News

View more

Sign Up for Electricity Forum’s Newsletter

Stay informed with our FREE Newsletter — get the latest news, breakthrough technologies, and expert insights, delivered straight to your inbox.

Electricity Today T&D Magazine Subscribe for FREE

Stay informed with the latest T&D policies and technologies.
  • Timely insights from industry experts
  • Practical solutions T&D engineers
  • Free access to every issue

Live Online & In-person Group Training

Advantages To Instructor-Led Training – Instructor-Led Course, Customized Training, Multiple Locations, Economical, CEU Credits, Course Discounts.

Request For Quotation

Whether you would prefer Live Online or In-Person instruction, our electrical training courses can be tailored to meet your company's specific requirements and delivered to your employees in one location or at various locations.