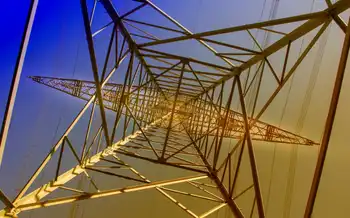
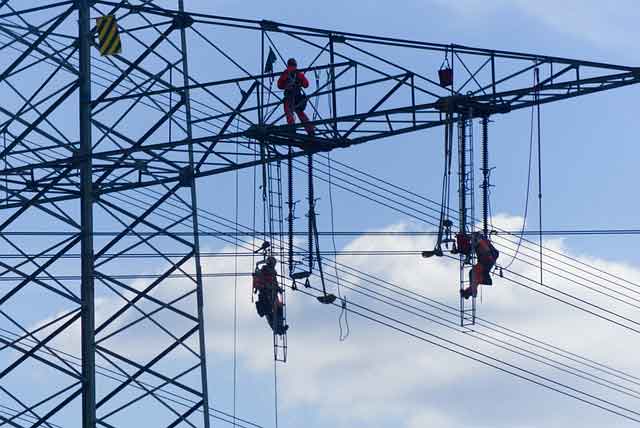
High Voltage Maintenance Training Online
Our customized live online or in‑person group training can be delivered to your staff at your location.

- Live Online
- 12 hours Instructor-led
- Group Training Available
Regular Price:
$599
Coupon Price:
$499
BERLIN
—
EU Solar Impact on Electricity Prices highlights how rising solar PV penetration drives negative pricing, shifts peak hours, pressures wholesale markets, and challenges grid balancing, interconnection, and flexibility amid changing demand and renewables growth.
What's Behind the News
Explains how rising solar PV cuts wholesale prices, shifts negative-price hours, and strains grid flexibility.
Negative price events doubled to ~1,600 across EU in 2020.
Netherlands saw ~100 events amid rapid PV build-out.
Germany's negative prices shifted to afternoons as solar grew.
Grid flexibility and cross-border links urged to manage intermittency.
The latest EU electricity market report has confirmed the affect deeper penetration of solar is having on wholesale electricity prices more broadly.
The Quarterly Report on European Electricity Markets for the final three months of last year noted the number of periods of negative electricity pricing doubled from 2019, to almost 1,600 such events, as global renewables set new records in deployment across markets.
Having experienced just three negative price events in 2019, the Netherlands recorded almost 100 last year “amid a dramatic increase in solar PV capacity,” in the nation, according to the report.
Whilst stressing the exceptional nature of the Covid-19 pandemic on power consumption patterns, the quarterly update also noted a shift in the hours during which negative electric pricing occurred in renewables poster child Germany. Previously such events were most common at night, during periods of high wind speed and low demand, but 2020 saw a switch to afternoon negative pricing. “Thus,” stated the report, “solar PV became the main driver behind prices falling into negative territory in the German market in 2020, as Germany's solar boost accelerated, and also put afternoon prices under pressure generally.”
The report also highlighted two instances of scarce electricity–in mid September and on December 9–as evidence of the problems associated with accommodating a rising proportion of intermittent clean energy capacity into the grid, and called for more joined-up cross-border power networks, amid pushback from Russian oil and gas across the continent.
Rising solar generation–along with higher gas output, year on year–also helped the Netherlands generate a net surplus of electricity last year, after being a net importer “for many years.” The EU report also noted a beneficial effect of rising solar generation capacity on Hungary‘s national electricity account, and cited a solar “boom” in that country and Poland, mirroring rapid solar PV growth in China in recent years.
With Covid-19 falls in demand helping renewables generate more of Europe's electricity (39%) than fossil fuels (36%) for the first time, as renewables surpassed fossil fuels across Europe, the market report observed the 5% of the bloc's power produced from solar closed in on the 6% accounted for by hard coal. In the final three months of the year, European solar output rose 12%, year on year, to 18 TWh and “the increase was almost single-handedly driven by Spain,” the study added.
With coal and lignite-fired power plunging 22% last year across the bloc, it is estimated the European power sector reduced its carbon footprint 14% as part of Europe's green surge although the quarterly report warned cold weather, lower wind speeds and rising gas prices in the opening months of this year are likely to see carbon emissions rebound.
There was good news on the transport front, though, with the report stating the scale of the European “electrically-charged vehicle” fleet doubled in 2020, to 2 million, with almost half a million of the new registrations arriving in the final months of the year. That meant cars with plug sockets accounted for a remarkable 17% of new purchases in Q4, twice the proportion seen in China and a slice of the pie six times bigger than such products claimed in the U.S.
Related News
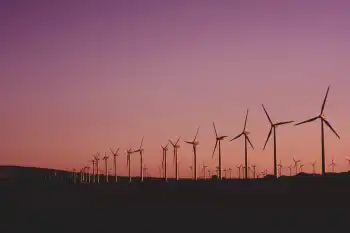
Wind Leading Power
UK Wind Power Surpasses Gas as offshore wind and solar drive record electricity generation, National…
View more
Electricity Payouts on Biggest U.S. Grid Fall 64 Per Cent in Auction
PJM Capacity Auction Price Drop signals PJM Interconnection capacity market shifts, with $50/MW-day clearing, higher…
View more

COVID-19 Response: Electric Power Industry Closely Coordinating With Federal Partners
ESCC COVID-19 Response coordinates utilities, public power, and cooperatives to protect the energy grid and…
View more

Coronavirus impacts dismantling of Germany's Philippsburg nuclear plant
Philippsburg Demolition Delay: EnBW postpones controlled cooling-tower blasts amid the coronavirus pandemic, affecting decommissioning timelines…
View more

Working From Home Will Drive Up Electricity Bills for Consumers
Remote Work Energy Costs are rising as home offices and telecommuting boost electricity bills; utilities,…
View more
B.C. Diverting Critical Minerals, Energy from U.S
Canadian Softwood Lumber Tariffs challenge British Columbia's forestry sector, strain U.S.-Canada trade, and risk redirecting…
View more
Sign Up for Electricity Forum’s Newsletter
Stay informed with our FREE Newsletter — get the latest news, breakthrough technologies, and expert insights, delivered straight to your inbox.
Electricity Today T&D Magazine Subscribe for FREE

Stay informed with the latest T&D policies and technologies.
- Timely insights from industry experts
- Practical solutions T&D engineers
- Free access to every issue
