Farmer turns to the sun to run Indiana operation

By The Tribune-Star


NFPA 70b Training - Electrical Maintenance

Our customized live online or in‑person group training can be delivered to your staff at your location.

  • Live Online
  • 12 hours Instructor-led
  • Group Training Available
Regular Price:
$599
Coupon Price:
$499
Reserve Your Seat Today
While Dr. Harold and Terri Loveall's Vigo County barn looks like any other in Indiana, it's what's on top of the south-facing sloping roof that makes it unique.

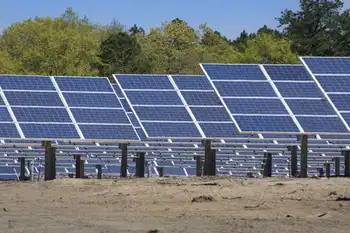
The 66- by 28-foot roof supports 60 photovoltaic solar panels, each producing 224 watts of electricity. The panels are aligned in four rows, or two sub-arrays, with each sub-array producing 6.7 kilowatts, making the entire system produce 13.4 kilowatts of electricity, said Phillip Roberts, owner of One Planet Solar & Wind, a Terre Haute solar and wind distributing and contracting company that recently installed the system.

"It's the fourth-largest residential solar photovoltaic system in Indiana," Roberts said, adding that the largest is in northwest Indiana, generating about 20 kilowatts.

It is the first step in making the Loveall farm energy-independent. The farm in southern Vigo County has at least 200 acres of electric fencing to contain a herd of "beefalo," a cross between buffalos and domestic cattle, plus a 7,000-square-foot home.

The fencing itself uses 600 volts of power, Roberts said.

"The system will cover at least 50 percent of electrical usage costs. When working at full power and demand is low, the Lovealls' electric meter will actually turn backward" and the couple will receive credit on their account, Roberts said.

Harold Loveall has been interested in solar technology since the 1970s, and the family has used solar panels for their hot water since the 1980s. Since then, the panels have become less expensive and more efficient, he said.

The solar panels produce direct current (DC) power, which is then transmitted to two inverter panels, which invert that to alternating current (AC) power, for use in the house, Roberts said.

The panels have no moving parts, and the only maintenance is washing the panels about twice a year, Roberts said, to remove any pollen or bird waste.

The system locks in energy prices and will generate savings of $230,000 over the next 25 years at current energy prices, which is about 11.6 cents per kilowatt hour, Roberts said.

Those electricity prices are expected to double, Roberts said, if a federal cap-and-trade energy plan is adopted by Congress. Duke Energy Corp. estimates placing a price on carbon emissions would increase electricity rates in Indiana by 40 percent.

The cap-and-trade system is aimed at reducing U.S. emissions of carbon dioxide and other greenhouse gases by roughly 80 percent from 2005 levels by 2050.

The Lovealls' system will avoid the release of 48,240 pounds of carbon dioxide into the atmosphere, according to One Planet Solar & Wind.

Installation is based on a cost of $7.68 per watt. The Loveall system cost nearly $104,000.

"This is a solar system on steroids," Roberts said.

The average home solar project costs $30,000 to $40,000, based on a 1,500- to 2,000-kilowatt consumption for a 2,000-square-foot home for a family of four. Those systems will cover 50 percent to 80 percent of a homeowner's electrical usage costs, Roberts said.

Those costs are before federal subsidies — a 30-percent federal tax credit for residential homes and a check for 30 percent of the project cost paid directly to companies, Roberts said. In addition, the solar system is property tax-exempt, he said.

The solar panels are part of a "phase one" project, Roberts said. A second phase for the Loveall farm will add more solar panels, plus move an existing 66-foot wind turbine next to the barn to produce wind power to allow the farm to be 100 percent energy independent. The farm would remain connected to Win Energy's power grid as a backup.

"I think this is the future," Loveall said. "My own belief is that fossil fuels are finite, solar energy is infinite."

The farmhouse itself has four solar attic fans and a geothermal system to heat water, plus uses passive solar energy from south-facing windows, Roberts said.

As to long- and short-term benefits, "first, we are lowering our carbon footprint, a sacrifice that will hopefully benefit our grandchildren and their children. Second, we expect the cost of energy to only increase over the next several years. We look at this as means to control some of that cost," Loveall said.

Related News

N.B. Power hits pause on large new electricity customers during crypto review

N.B. Power Crypto Mining Moratorium underscores electricity demand risks from bitcoin mining, straining the energy grid and industrial load capacity in New Brunswick, as a cabinet order prioritizes grid reliability, utility planning, and allocation.


Key Points

Official pause on new large-scale crypto mining to protect N.B. Power grid capacity, stability, and reliable supply.

✅ Cabinet order halts new large-scale crypto load requests

✅ Review targets grid reliability, planning, and capacity

✅ Non-crypto industrial customers exempt from prolonged pause


N.B. Power says a freeze on servicing new, large-scale industrial customers in the province remains in place over concerns that the cryptocurrency sector's heavy electricity use could be more than the utility can handle.

The Higgs government quietly endorsed the moratorium in a cabinet order in March 2022 and ordered a review of how the sector might affect the reliable electricity supply and broader electricity future planning in the province.

The cabinet order, filed with the Energy and Utilities Board, said N.B. Power had "policy, technical and operational concerns about [its] capacity to service the anticipated additional load demand" from energy-intensive customers such as crypto mines.

It said the utility had received "several new large-scale, short-notice service requests" to supply electricity to crypto mining companies that could put "significant pressure" on the existing electricity supply.

The order, signed by Premier Blaine Higgs, said non-crypto companies shouldn't be subject to the pause for any longer than required for the review, amid shifts in regional plans like the Atlantic Loop that are altering timelines. Ws.

The freeze was ordered months after Taal Distributed Information Technologies Inc. announced plans to establish a 50-megawatt bitcoin mining operation and transaction processing facility in Grand Falls.

A town official said this week that the deal never went ahead.

24 hours a day
The Taal facility would have joined a 70-megawatt bitcoin mine in Grand Falls operated by Hive Blockchain Technologies.

Hive's Bitcoin mine comprises four large warehouses containing thousands of computers running 24 hours a day to earn cryptocurrency units.

The combined annual electricity consumption of the two mines would exceed what could be produced by the small modular nuclear reactor being designed by ARC Clean Energy Canada of Saint John, even as Nova Scotia advances efforts to harness the Bay of Fundy's powerful tides for clean power.

Put another way, the two mines would gobble up more than three months' electricity from N.B. Power's coal-fired Belledune generating station under current operations.


Related News

View more

Covid-19: Secrets of lockdown lifestyle laid bare in electricity data

Lockdown Electricity Demand Trends reveal later mornings, weaker afternoons, and delayed peaks as WFH, streaming, and video conferencing reshape energy demand curves, grid forecasting, and residential electricity usage across Europe, New York, Tokyo, and Singapore.


Key Points

Shifts in power use during lockdowns: later ramps, weaker afternoons, and higher, delayed evening peaks.

✅ Morning ramp starts later; midday demand dips

✅ Evening peak shifts 1-2 hours; higher late-night usage

✅ WFH and streaming raise residential load; industrial demand falls


Life in lockdown means getting up late, staying up till midnight and slacking off in the afternoons.

That’s what power market data in Europe show in the places where restrictions on activity have led to a widespread shift in daily routines of hundreds of millions of people.

It’s a similar story wherever lockdowns bite. In New York City electricity use has fallen as much as 18% from normal times at 8am. Tokyo and three nearby prefectures had a 5% drop in power use during weekdays after Japan declared a state of emergency on April 7, according to Tesla Asia Pacific, an energy forecaster.

Italy’s experience shows the trend most clearly since the curbs started there on March 5, before any other European country. Data from the grid operator Terna SpA gives a taste of what other places are also now starting to report, with global daily demand dips observed in many markets as well.


1. People are sleeping later

With no commute to the office people can sleep longer. Normally, electricity demand began to pick up between 6 a.m. and 8 a.m. Now in Germany, it’s clear coffee machines don’t go on until between 8 a.m. and 9 a.m., said Simon Rathjen, founder of the trading company MFT Energy A/S.

Germany, France and Italy -- which between them make up almost two thirds of the euro-zone economy -- all have furlough measures that allow workers to receive a salary while temporarily suspended from their jobs. The U.K. also has a support package. Many of these workers will be getting up later.

"Now I have quite a relaxed start to the morning,” said David Freeman, an analyst in financial services from London. "I don’t get up until about half an hour before I need to start work.”

2. Less productive afternoons

There is a deeper dip in electricity use in the afternoons. Previously, power use rose between 2pm and 5pm. Now it dips as people head out for a walk or some air, according to UK demand data from National Grid Plc

It’s "as though we are living through a month of Sundays”, said Iain Staffell, senior lecturer in sustainable energy at Imperial College London.

3. Evenings in

From 6pm electricity use begins to rise steeply as people finish work and start chores. Restrictions like work and home schooling that prevent much daytime TV watching lifts in the early evening. This following chart for Germany shows the evening peak for power use coming during later hours.

The evening is when electricity use is highest, with most people confined to their homes. Netflix Inc reported a record 15.8 million paid subscribers – almost double the figure forecast by Wall Street analysts. Video-streaming services like Netflix and YouTube have found a captive audience. The new Disney+ service surpassed 50 million subscribers in just five months, a faster pace than predicted.

Internet traffic is skyrocketing, with a surge in bandwidth-intensive applications like streaming services and Zoom. This may mean that monthly broadband consumption of as much as 600 gigabytes, about 35% higher than before, according to Bloomberg Intelligence.

In Singapore, electricity use has dropped off significantly since the country’s "circuit-breaker” efforts to keep people at home began April 7. Electricity use has fallen and stayed low during the day. But late at night is a different story, as power demand fell sharply immediately after the lockdown began, it has steadily crept back in the past two weeks, perhaps a sign that Tiger King and The Last Dance have been finding late-night fans in the city state.

In Ottawa, COVID-19 closures made it seem as if the city had fallen off the electricity grid, according to local reports.

4. Staying up late

We’re going to bed later too. Demand doesn’t start to drop off until 10pm to 12am, at least an hour later than before.

"My children are definitely going to bed later,” said Liz Stevens, a teaching assistant from London. "Our whole routine is out the window.”

It’s challenging for those that need to predict behaviour – power grids and electricity traders. Forecasting is based on historical data, and there isn’t anything to go into the models gauging use now.

The closest we can get is looking at big events like football World Championships when people are all sitting down at the same time, according to Rathjen at MFT.

"Forecasting demand right now is very tricky,” said Chris Kimmett, director of power grids at Reactive Technologies Ltd. "A global pandemic is uncharted territory."

What normal looks like when the crisis passes is also an open question. Different countries are set to unravel their measures in their own ways, and global power demand has already surged above pre-pandemic levels in some analyses, with Germany and Austria loosening restrictions first and Italy remaining under tight control. Some changes may be permanent, with both workers and employers becoming more comfortable with working from home.

5. Different sectors consume more

In China, which is further along recovering from the pandemic than Europe or the US, the sharp contraction in overall power output masks a shift in daily routines.

Eating habits have changed. Restaurants are expanding delivery and even offering grocery services as the preference for dining at home persists. Household electricity consumption in China probably increased from activities such as cooking and heating, according to IHS Markit, which said that residential demand rose by 2.4% in the first two months as people stayed in.

The increase in technology use also drove China’s power demand from the telecom and web-service sectors to rise by 27%, the consultancy said.

Overall, China power demand in the first quarter of the year fell 6.5% from the same period in 2019 to 1.57 trillion kilowatt-hours, China’s National Energy Administration said last week. Industry uses about 70% of the country’s electricity, while the commercial sector and households account for 14% each. – Bloomberg


Related News

View more

Egypt Plans Power Link to Saudis in $1.6 Billion Project

Egypt-Saudi Electricity Interconnection enables cross-border power trading, 3,000 MW capacity, and peak-demand balancing across the Middle East, boosting grid stability, reliability, and energy security through an advanced electricity network, interconnector infrastructure, and GCC grid integration.


Key Points

A 3,000 MW grid link letting Egypt and Saudi Arabia trade power, balance peak demand, and boost regional reliability.

✅ $1.6B project; Egypt invests ~$600M; 2-year construction timeline

✅ 3,000 MW capacity; peak-load shifting; cross-border reliability

✅ Links GCC grid; complements Jordan and Libya interconnectors


Egypt will connect its electricity network to Saudi Arabia, joining a system in the Middle East that has allowed neighbors to share power, similar to the Scotland-England subsea project that will bring renewable power south.

The link will cost about $1.6 billion, with Egypt paying about $600 million, Egypt’s Electricity Minister Mohamed Shaker said Monday at a conference in Cairo, as the country pursues a smart grid transformation to modernize its network. Contracts to build the network will be signed in March or April, and construction is expected to take about two years, he said. In times of surplus, Egypt can export electricity and then import power during shortages.

"It will enable us to benefit from the difference in peak consumption,” Shaker said. “The reliability of the network will also increase.”

Transmissions of electricity across borders in the Gulf became possible in 2009, when a power grid connected Qatar, Kuwait, Saudi Arabia and Bahrain, a dynamic also seen when Ukraine joined Europe's grid under emergency conditions. The aim of the grid is to ensure that member countries of the Gulf Cooperation Council can import power in an emergency. Egypt, which is not in the GCC, may have been able to avert an electricity shortage it suffered in 2014 if the link with Saudi Arabia existed at the time, Shaker said.

The link with Saudi Arabia should have a capacity of 3,000 megawatts, he said. Egypt has a 450-megawatt link with Jordan and one with Libya at 200 megawatts, the minister said. Egypt will seek to use its strategic location to connect power grids in Asia, where the Philippines power grid efforts are raising standards, and elsewhere in Africa, he said.

In 2009, a power grid linked Qatar, Kuwait, Saudi Arabia and Bahrain, allowing the GCC states to transmit electricity across borders, much like proposals for a western Canadian grid that aim to improve regional reliability. 


Related News

View more

More people are climbing dangerous hydro dams and towers in search of 'social media glory,' utility says

BC Hydro Trespassing Surge highlights risky social media stunts at dams and power stations, with restricted areas breached for selfies, electrocution hazards ignored, and safety signage violated across Buntzen Lake, Jones Lake, and Jordan River.


Key Points

A spike in illegal entries at BC Hydro sites for social media, increasing electrocution and drowning risks.

✅ 200% rise in trespassing over five years

✅ Risks: electrocution, drowning, deadly falls

✅ Obey signage; avoid restricted dam and substation areas


More and more daredevils are climbing onto dangerous dams and power stations to gain likes and social media followers, according to a new report from BC Hydro.

The power provider says it's seen a 200 per cent uptick in trespassing into restricted areas over the past five years, with many of the incidents posted onto sites like YouTube, Facebook and Instagram.

"It's concerning for us because our infrastructure has risk with it," said David Conway, a community relations manager for BC Hydro.

"There's a risk of electrocution in regards to our transmission towers and our substations ... and people can be severely injured, as seen in serious injuries cases, or killed," he said.

The company released a report Tuesday, noting specific incidents of users trespassing onto sites at Buntzen Lake in Anmore, Jones Lake in the Fraser Valley and Jordan River near Victoria; it has also been issuing Site C updates during the pandemic. The incidents ranged from climbing transmission towers to swimming in restricted areas at dam sites.

In a separate matter, an external investigation at Manitoba Hydro has examined alleged assaults by workers.

Conway says annual incidents climbed from a handful to about one dozen, but BC Hydro expects the figures to be even higher. He says many more events likely go unreported.

The report ties the increase in incidents to the pursuit of "social media glory." Between 2011 and 2017, at least 259 people were killed worldwide in selfie-related incidents, according to the Journal of Family Medicine and Primary Care, and a knowledge gap in electrical safety remains a factor. Many of the incidents involved water, electrical equipment or dangerous heights.

In 2018, three social media personalities died after falling off a cliff at Shannon Falls near Squamish, B.C.

North Shore Rescue attributes about 30 per cent of its calls to outdoor users attempting to capture content for social media.

Survey results highlighted in the BC Hydro report show that 15 per cent of British Columbians admit to putting themselves in a dangerous position "to achieve the 'perfect' shot."

Awareness also influences careers, as many young Canadians say they would work in electricity if they knew more.

The survey was conducted online by 800 B.C. residents. For comparison purposes, a probability sample of the same size would yield a margin of error of plus or minus 3.5 per cent, 19 times out of 20.

During the pandemic, the U.S. grid overseer issued a coronavirus warning to highlight operational risks.

Risky activities include standing at the edge of a cliff, knowingly disobeying safety signage or trespassing, or taking a selfie from a dangerous height.

Two per cent of British Columbians admit to injuring themselves in the name of a selfie.

"We want people to stay safe. We want to remind the public to stay a safe distance away from our infrastructure, and follow safety guidance near downed lines, as electricity and generating facilities can be dangerous," said Conway.

BC Hydro is urging all visitors to obey signage, steer clear of power-generating equipment and to stay on designated trails.


Related News

View more

Latvia eyes electricity from Belarus nuclear plant

Latvia Astravets electricity imports weigh AST purchases from the Belarusian nuclear plant, impacting the Baltic grid, Lithuania market, energy security, and cross-border trading as Latvia seeks to mitigate supply risks and stabilize power flows.


Key Points

Proposed AST purchases of power from Belarus's Astravets plant to bolster Baltic grid supply via Lithuania.

✅ AST evaluates imports to mitigate supply risk

✅ Energy could enter Lithuania via existing trading route

✅ Debate centers on nuclear safety and Baltic grid impacts


Latvia’s electricity transmission system operator, AST, is looking at the possibility of purchasing electricity from the soon-to-be completed Belarusian nuclear power plant in Astravets, at a time when Ukraine's electricity exports have resumed in the region, long criticised by the Lithuanian government, Belsat TV has reported.

According to the Latvian media, the Latvian government is seeking to mitigate the risk of a possible drop in electricity supplies amid price spikes in Ireland highlighting dispatchable power concerns, given that energy trading between the Baltic states and third parties is currently carried out only through the Belarusian-Lithuanian border, including Latvian imports from Lithuania.

If AST starts importing electricity from the Belarusian plant to Latvia, in a pattern similar to Georgia's electricity imports during peak demand, the energy is expected to enter the Lithuanian market as well.

Such cross-border flows also mirror responses to Central Asia's electricity shortages seen recently.

The Lithuanian government has repeatedly criticised the nuclear power over national security and environmental safety concerns, as well as a number of emergencies that took place during construction, particularly as Europe is losing nuclear power and confronting energy security challenges.

Debates over infrastructure and safety have also intensified by projects like power lines to reactivate Zaporizhzhia in Ukraine.

The first Astravets reactor, which is being built close to the Lithuanian border in the Hrodno region, is expected to be operational by the end of 2019, a year that saw Belgium's nuclear exports rise across Europe.


Related News

View more

Renewables are not making electricity any more expensive

Renewables' Impact on US Wholesale Electricity Prices is clear: DOE analysis shows wind and solar, capacity gains, and natural gas lowering rates, shifting daily patterns, and triggering occasional negative pricing in PJM and ERCOT.


Key Points

DOE data show wind and solar lower wholesale prices, reshape price curves, and cause negative pricing in markets.

✅ Natural gas price declines remain the largest driver of cheaper power

✅ Wind and solar shift seasonal and time-of-day price patterns

✅ Negative wholesale prices appear near high wind and solar output


One of the arguments that's consistently been raised against doing anything about climate change is that it will be expensive. On the more extreme end of the spectrum, there have been dire warnings about plunging standards of living due to skyrocketing electricity prices. The plunging cost of renewables like solar cheaper than gas has largely silenced these warnings, but a new report from the Department of Energy suggests that, even earlier, renewables were actually lowering the price of electricity in the United States.


Plunging prices
The report focuses on wholesale electricity prices in the US. Note that these are distinct from the prices consumers actually pay, which includes taxes, fees, payments to support the grid that delivers the electricity, and so on. It's entirely possible for wholesale electricity prices to drop even as consumers end up paying more, and market reforms determine how those changes are passed through. That said, large changes in the wholesale price should ultimately be passed on to consumers to one degree or another.

The Department of Energy analysis focuses on the decade between 2008 and 2017, and it includes an overall analysis of the US market, as well as large individual grids like PJM and ERCOT and, finally, local prices. The decade saw a couple of important trends: low natural gas prices that fostered a rapid expansion of gas-fired generators and the rapid expansion of renewable generation that occurred concurrently with a tremendous drop in price of wind and solar power.

Much of the electricity generated by renewables in this time period would be more expensive than that generated by wind and solar installed today. Not only have prices for the hardware dropped, but the hardware has improved in ways that provide higher capacity factors, meaning that they generate a greater percentage of the maximum capacity. (These changes include things like larger blades on wind turbines and tracking systems for solar panels.) At the same time, operating wind and solar is essentially free once they're installed, so they can always offer a lower price than competing fossil fuel plants.

With those caveats laid out, what does the analysis show? Almost all of the factors influencing the wholesale electricity price considered in this analysis are essentially neutral. Only three factors have pushed the prices higher: the retirement of some plants, the rising price of coal, and prices put on carbon, which only affect some of the regional grids.

In contrast, the drop in the price of natural gas has had a very large effect on the wholesale power price. Depending on the regional grid, it's driven a drop of anywhere from $7 to $53 per megawatt-hour. It's far and away the largest influence on prices over the past decade.


Regional variation and negative prices
But renewables have had an influence as well. That influence has ranged from roughly neutral to a cost reduction of $2.2 per MWh in California, largely driven by solar. While the impact of renewables was relatively minor, it is the second-largest influence after natural gas prices, and the data shows that wind and solar are reducing prices rather than increasing them.

The reports note that renewables are influencing wholesale prices in other ways, however. The growth of wind and solar caused the pattern of seasonal price changes to shift in areas of high wind and solar, as seen with solar reshaping prices in Northern Europe as daylight hours and wind patterns shift with the seasons. Similarly, renewables have a time-of-day effect for similar reasons, helping explain why the grid isn't 100% renewable today, which also influences the daily timing price changes, something that's not an issue with fossil fuel power.

A map showing the areas where wholesale electricity prices have gone negative, with darker colors indicating increased frequency.
Enlarge / A map showing the areas where wholesale electricity prices have gone negative, with darker colors indicating increased frequency.

US DOE
One striking feature of areas where renewable power is prevalent is that there are occasional cases in which an oversupply of renewable energy produces negative electricity prices in the wholesale market. (In the least-surprising statement in the report, it concludes that "negative prices in high-wind and high-solar regions occurred most frequently in hours with high wind and solar output.") In most areas, these negative prices are rare enough that they don't have a significant influence on the wholesale price.

That's not true everywhere, however. Areas on the Great Plains see fairly frequent negative prices, and they're growing in prevalence in areas like California, the Southwest, and the northern areas of New York and New England, while negative prices in France have been observed in similar conditions. In these areas, negative wholesale prices near solar plants have dropped the overall price by 3%. Near wind plants, that figure is 6%.

None of this is meant to indicate that there are no scenarios where expanded renewable energy could eventually cause wholesale prices to rise. At sufficient levels, the need for storage, backup plants, and grid management could potentially offset their low costs, a dynamic sometimes referred to as clean energy's dirty secret by analysts. But it's clear we have not yet reached that point. And if the prices of renewables continue to drop, then that point could potentially recede fast enough not to matter.


Related News

View more

Sign Up for Electricity Forum’s Newsletter

Stay informed with our FREE Newsletter — get the latest news, breakthrough technologies, and expert insights, delivered straight to your inbox.

Electricity Today T&D Magazine Subscribe for FREE

Stay informed with the latest T&D policies and technologies.
  • Timely insights from industry experts
  • Practical solutions T&D engineers
  • Free access to every issue

Download the 2025 Electrical Training Catalog

Explore 50+ live, expert-led electrical training courses –

  • Interactive
  • Flexible
  • CEU-cerified