Ukraine Resumes Electricity Exports


Substation Relay Protection Training

Our customized live online or in‑person group training can be delivered to your staff at your location.

  • Live Online
  • 12 hours Instructor-led
  • Group Training Available
Regular Price:
$699
Coupon Price:
$599
Reserve Your Seat Today

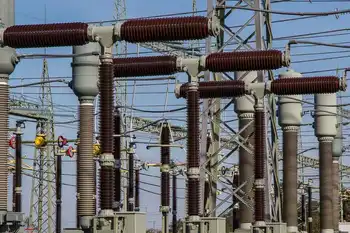
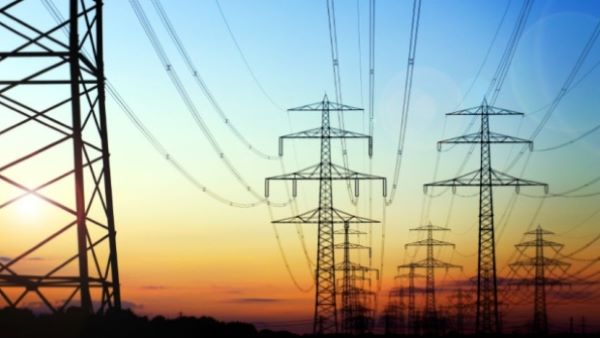
Ukraine Electricity Exports resume as the EU grid links stabilize; ENTSO-E caps, megawatt capacity, renewables, and infrastructure repairs enable power flows to Moldova, Poland, Slovakia, and Romania despite ongoing Russian strikes.


Key Points

Resumed cross-border power sales showing grid stability under ENTSO-E limits and surplus generation.

✅ Exports restart to Moldova; Poland, Slovakia, Romania next.

✅ ENTSO-E cap limits to 400 MW; more capacity under negotiation.

✅ Revenues fund grid repairs after Russian strikes.


Ukraine began resuming electricity exports to European countries on Tuesday, its energy minister said, a dramatic turnaround from six months ago when fierce Russian bombardment of power stations plunged much of the country into darkness in a bid to demoralize the population.

The announcement by Energy Minister Herman Halushchenko that Ukraine was not only meeting domestic consumption demands but also ready to restart exports to its neighbors was a clear message that Moscow’s attempt to weaken Ukraine by targeting its infrastructure did not work.

Ukraine’s domestic energy demand is “100%” supplied, he told The Associated Press in an interview, and it has reserves to export due to the “titanic work” of its engineers and international partners.

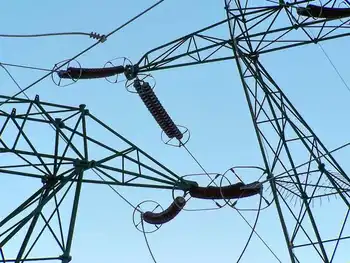
Russia ramped up infrastructure attacks in September, when waves of missiles and exploding drones destroyed about half of Ukraine's energy system, even as it built lines to reactivate the Zaporizhzhia plant in occupied territory. Power cuts were common across the country as temperatures dropped below freezing and tens of millions struggled to keep warm.

Moscow said the strikes were aimed at weakening Ukraine’s ability to defend itself, and both sides have floated a possible agreement on power plant attacks amid mounting civilian harm, while Western officials said the blackouts that caused civilians to suffer amounted to war crimes. Ukrainians said the timing was designed to destroy their morale as the war marked its first anniversary.


Ukraine had to stop exporting electricity in October to meet domestic needs.

Engineers worked around the clock, often risking their lives to come into work at power plants and keep the electricity flowing. Kyiv’s allies also provided help. In December, U.S. Secretary of State Antony Blinken announced $53 million in bilateral aid to help the country acquire electricity grid equipment, on top of $55 million for energy sector support.

Much more work remains to be done, Halushchenko said. Ukraine needs funding to repair damaged generation and transmission lines, and revenue from electricity exports would be one way to do that.

The first country to receive Ukraine’s energy exports will be Moldova, he said.

Besides the heroic work by engineers and Western aid, warmer temperatures are enabling the resumption of exports by making domestic demand lower, and across Europe initiatives like virtual power plants for homes are helping balance grids. Nationwide consumption was already down at least 30% due to the war, Halushchenko said, with many industries having to operate with less power.

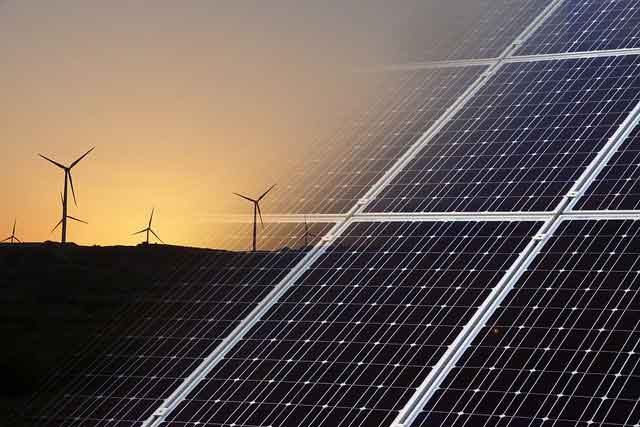
Renewables like solar and wind power also come into play as temperatures rise, taking some pressure off nuclear and coal-fired power plants.

But it’s unclear if Ukraine can keep up exports amid the constant threat of Russian bombardment.

“Unfortunately now a lot of things depend on the war,” Halushchenko said. “I would say we feel quite confident now until the next winter.”

Exports to Poland, Slovakia and Romania are also on schedule to resume, he said.

“Today we are starting with Moldova, and we are talking about Poland, we are talking about Slovakia and Romania,” Halushchenko added, noting that how much will depend on their needs.

“For Poland, we have only one line that allows us to export 200 megawatts, but I think this month we will finish another line which will increase this to an additional 400 MW, so these figures could change,” he said.

Export revenue will depend on fluctuating electricity prices in Europe, where stunted hydro and nuclear output may hobble recovery efforts. In 2022, while Ukraine was still able to export energy, Ukrainian companies averaged 40 million to 70 million euros a month depending on prices, Halushchenko said.

“Even if it’s 20 (million euros) it’s still good money. We need financial resources now to restore generation and transmission lines,” he said.

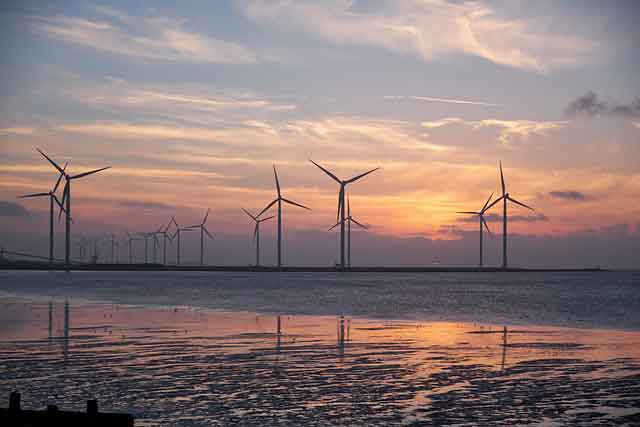
Ukraine has the ability to export more than the 400 megawatt capacity limit imposed by the European Network of Transmission System Operators for Electricity, or ENTSO-E, and rising EU wind and solar output is reshaping cross-border flows. “We are in negotiations to increase this cap because today we can export even more, we have the necessary reserves in the system,” the minister said.

The current capacity limit is in line with what Ukraine was exporting in September 2022 before Ukraine diverted resources to meet domestic needs amid the Russian onslaught.


Related News

Related News

UK families living close to nuclear power stations could get free electricity

UK Nuclear Free Electricity Incentive proposes community benefits near reactors, echoing France, supporting net zero goals, energy security, and streamlined planning, while addressing regulation and judicial review challenges for Sizewell C and future nuclear projects.


Key Points

A proposed policy to give free power to residents near reactors, supporting net zero and energy security.

✅ Free power for communities near nuclear plants

✅ Aligns with net zero and energy security goals

✅ Seeks streamlined planning and fewer approvals


UK Business Secretary Jacob Rees-Mogg has endorsed a French-style nuclear system that sees people living near nuclear power stations receive free electricity.

Speaking at an event organised by Policy Exchange think tank, Jacob Rees-Mogg said: “Nuclear power is just fundamental. There’s no way we can get to net zero emissions, or even have an intelligent electricity strategy and grid reform in the UK, without nuclear.”

Highlighting that this was his view and not a government policy announcement, he said: “We should copy the French. As I understand, if you live near a nuclear power station in France, you get free electricity and that’s great because then, I’ll have two in my garden if I get free electricity for my children as well.

“I think you want to recognise that things you do that are in the national interest, such as a state-owned generation company, must benefit those who make the sacrifice for the national interest.”

Earlier Mr Rees-Mogg stressed that he would like to see a simpler development consent process for new nuclear power plants to enable the next waves of reactors in the UK, amid concerns that Europe is losing nuclear power just when it really needs energy.

He said: “That’s a lot of regulation around that, as seen when nuclear plant plans collapsed in Wales and impacted the local economy. Did you know that Sizewell C will require 140 individual approvals from arms of the state, each one of which is potentially subject to judicial review.”


Related News

View more

New Orleans Levees Withstood Hurricane Ida as Electricity Failed

Hurricane Ida New Orleans Infrastructure faced a split outcome: levees and pumps protected against storm surge, while the power grid collapsed as transmission lines failed, prompting large-scale restoration efforts across Louisiana and Mississippi.


Key Points

It summarizes Ida's impact: levees and pumps held, but the power grid failed, causing outages and slow restoration.

✅ Levees and pumps mitigated flooding and storm surge impacts.

✅ All transmission lines failed, crippling the power grid.

✅ Crews and drones assess damage; restoration may take weeks.


Infrastructure in the city of New Orleans turned in a mixed performance against the fury of Hurricane Ida, with the levees and pumps warding off catastrophic flooding even as the electrical grid, part of the broader Louisiana power grid, failed spectacularly.

Ida’s high winds, measuring 150 miles (240 kilometers) an hour at landfall, took out all eight transmissions lines that deliver power into New Orleans, ripped power poles in half and crumpled at least one steel transmission tower into a twisted metal heap, knocking out electricity to all of the city. A total of more than 1.2 million homes and businesses in Louisiana and Mississippi lost power. While about 90,000 customers were reconnected by Monday afternoon, many could face days without electricity, and frustration can mount as seen during the Houston outage after major storms.

In contrast, the New Orleans area’s elaborate flood defenses seem to have held up, a vindication of the Army Corps of Engineers’ $14.5 billion project to rebuild levees, flood gates and pumps in the wake of the devastation wrought by Hurricane Katrina in 2005. While there were reports of scattered deaths tied to Ida, the city escaped the kind of flooding that destroyed entire neighborhoods in Katrina’s wake, left parts of the city uninhabitable for months and claimed 1,800 lives. 

“The situation in New Orleans, as bad as it is today with the power, could be so much worse,” Louisiana Governor John Bel Edwards said Monday on the Today Show, praising the levee system’s performance. “All you have to do is go back 16 years to get a glimpse of what that would have been like.”

While the levees’ resiliency is no doubt due to the rebuilding effort that followed Katrina, the starkly different outcomes also stems from the storms’ different characteristics. Katrina slammed the coast with a 30-foot storm surge of ocean water, while preliminary estimates from Ida put its surge far lower. 


Ida’s winds, however, were stronger than Katrina’s, and that’s what ultimately took out so many power lines, a dynamic that also saw Texas utilities struggle during Harvey. Deanna Rodriguez, the chief executive officer of power provider Entergy New Orleans, declined to comment on when service would be restored, saying the company was using helicopters and drones to help assess the damage.

Michael Webber, an energy and engineering professor at the University of Texas at Austin, estimated power restoration will take days and possibly weeks, a pattern seen in Florida restoration timelines after major hurricanes, based on the initial damage reports from the storm. More than 25,000 workers from at least 32 states and Washington are mobilized to assist with power restoration efforts, similar to FPL's massive response after Irma, according to the Edison Electric Institute.

“The question is, how long will it take to rebuild these lines,” Webber said. The utilities will first need to complete their damage assessments before they can get a sense of repair timelines, a step that Gulf Power crews have highlighted in past recoveries, he said. “You can imagine that will take days at least, possibly weeks.”

The loss of electricity will have other affects as well, and even though grid resilience during the pandemic was strong, local systems face immediate constraints. Sewer substations, for example, need electricity to keep wastewater moving, said Ghassan Korban, executive director of the New Orleans Sewerage & Water Board. The storm knocked out power to about 80 of the city’s 84 pumping stations, he said at a Monday press conference. “Without electricity, wastewater backs up and can cause overflows,” he said, adding that residents should conserve water to lessen stress on the system.


Related News

View more

Competition in Electricity Has Been Good for Consumers and Good for the Environment

Electricity Market Competition drives lower wholesale prices, stable retail rates, better grid reliability, and faster emissions cuts as deregulation and renewables adoption pressure utilities, improve efficiency, and enhance consumer choice in power markets.


Key Points

Electricity market competition opens supply to rivals, lowering prices, improving reliability, and reducing emissions.

✅ Wholesale prices fell faster in competitive markets

✅ Retail rates rose less than in monopoly states

✅ Fewer outages, shorter durations, improved reliability


By Bernard L. Weinstein

Electricity used to be boring.  Public utilities that provided power to homes and businesses were regulated monopolies and, by law, guaranteed a fixed rate-of-return on their generation, transmission, and distribution assets. Prices per kilowatt-hour were set by utility commissions after lengthy testimony from power companies, wanting higher rates, and consumer groups, wanting lower rates.

About 25 years ago, the electricity landscape started to change as economists and others argued that competition could lead to lower prices and stronger grid reliability. Opponents of competition argued that consumers weren’t knowledgeable enough about power markets to make intelligent choices in a competitive pricing environment. Nonetheless, today 20 states have total or partial competition for electricity, allowing independent power generators to compete in wholesale markets and retail electric providers (REPs) to compete for end-use customers, a dynamic echoed by the Alberta electricity market across North America. (Transmission, in all states, remains a regulated natural monopoly).

A recent study by the non-partisan Pacific Research Institute (PRI) provides compelling evidence that competition in power markets has been a boon for consumers. Using data from the U.S. Energy Information Administration (EIA), PRI’s researchers found that wholesale electricity prices in competitive markets have been generally declining or flat, prompting discussions of free electricity business models, over the last five years. For example, compared to 2015, wholesale power prices in New England have dropped more than 44 percent, those in most Mid-Atlantic States have fallen nearly 42 percent, and in New York City they’ve declined by nearly 45 percent. Wholesale power costs have also declined in monopoly states, but at a considerably slower rate.

As for end-users, states that have competitive retail electricity markets have seen smaller price increases, as consumers can shop for electricity in Texas more cheaply than in monopoly states. Again, using EIA data, PRI found that in 14 competitive jurisdictions, retail prices essentially remained flat between 2008 and 2020. By contrast, retail prices jumped an average of 21 percent in monopoly states.  The ten states with the largest retail price increases were all monopoly-based frameworks. A 2017 report from the Retail Energy Supply Association found customers in states that still have monopoly utilities saw their average energy prices increase nearly 19 percent from 2008 to 2017 while prices fell 7 percent in competitive markets over the same period.

The PRI study also observed that competition has improved grid reliability, the recent power disruptions in California and Texas, alongside disruptions in coal and nuclear sectors across the U.S., notwithstanding. Looking at two common measures of grid resiliency, PRI’s analysis found that power interruptions were 10.4 percent lower in competitive states while the duration of outages was 6.5 percent lower.

Citing data from the EIA between 2008 and 2018, PRI reports that greenhouse gas emissions in competitive states declined on average 12.1 percent compared to 7.3 percent in monopoly states. This result is not surprising, and debates over whether Israeli power supply competition can bring cheaper electricity mirror these dynamics.  In a competitive wholesale market, independent power producers have an incentive to seek out lower-cost options, including subsidized renewables like wind and solar. By contrast, generators in monopoly markets have no such incentive as they can pass on higher costs to end-users. Perhaps the most telling case is in the monopoly state of Georgia where the cost to build nuclear Plant Vogtle has doubled from its original estimate of $14 billion 12 years ago. Overruns are estimated to cost Georgia ratepayers an average of $854, and there is no definite date for this facility to come on line. This type of mismanagement doesn’t occur in competitive markets.

Unfortunately, some critics are attempting to halt the momentum for electricity competition and have pointed to last winter’s “deep freeze” in Texas that left several million customers without power for up to a week. But this example is misplaced. Power outages in February were the result of unprecedented and severe weather conditions affecting electricity generation and fuel supply, and numerous proposals to improve Texas grid reliability have focused on weatherization and fuel resilience; the state simply did not have enough access to natural gas and wind generation to meet demand. Competitive power markets were not a factor.

The benefits of wholesale and retail competition in power markets are incontrovertible. Evidence shows that households and businesses in competitive states are paying less for electricity while grid reliability has improved. The facts also suggest that wholesale and retail competition can lead to faster reductions in greenhouse gas emissions. In short, competition in power markets is good for consumers and good for the environment.

Bernard L. Weinstein is emeritus professor of applied economics at the University of North Texas, former associate director of the Maguire Energy Institute at Southern Methodist University, and a fellow of Goodenough College, London. He wrote this for InsideSources.com.


Related News

View more

Learn how fees and usage impacts your electricity bill in new online CER tool

CER Interactive Electricity Bill Tool compares provincial electricity prices, fees, taxes, and usage. Explore household appliance costs, hydroelectric generation, and consumption trends across Canada with interactive calculators and a province-by-province breakdown.


Key Points

An online CER report with calculators comparing electricity prices, fees, and usage to explain household energy costs.

✅ Province-by-province bill, price, and consumption comparison

✅ Calculator for appliance and electronics energy costs

✅ Explains fees, taxes, regulation, and generation sources


Canadians have a new way to assess their electricity bill in a new, interactive online report released by the Canada Energy Regulator (CER).

The report titled What is in a residential electricity bill? features a province-to-province comparison of electricity bills, generation and consumption. It also explains electricity prices across the country, including how Calgary electricity prices have changed, allowing people to understand why costs vary depending on location, fees, regulation and taxes.  

Learn how fees and usage impacts your electricity bill in new online CER tool
Interactive tools allow people to calculate the cost of household appliances and electronic use for each province and territory, and to understand how Ontario rate increases may affect monthly bills. For example, an individual can use the tools to find out that leaving a TV on for 24-hours in Quebec costs $5.25 per month, while that same TV on for a whole day would cost $12.29 per month in Saskatchewan, $20.49 per month in the Northwest Territories, and $15.30 per month in Nova Scotia.

How Canadians use energy varies as much as how provinces and territories produce it, especially in regions like Nunavut where unique conditions influence costs. Millions of Canadians rely on electricity to power their household appliances, charge their electronics, and heat their homes. Provinces with abundant hydro-electric resources like Quebec, B.C., Manitoba, and Newfoundland and Labrador use electricity for home heating and tend to consume the most electricity.

By gathering data from various sources, this report is the first Canadian publication that features interactive tools to allow for a province-by-province comparison of electricity bills while highlighting different elements within an electricity bill, a helpful context as Canada faces a critical supply crunch in the years ahead.

The CER monitors energy markets and assesses Canadian energy requirements and trends, including clean electricity regulations developments that shape pricing. This report is part of a portfolio of publications on energy supply, demand and infrastructure that the CER publishes regularly as part of its ongoing market monitoring.

"No matter where you go in the country, Canadians want to know how much they pay for power and why, especially amid price spikes in Alberta this year," says lead author Colette Craig. "This innovative, interactive report really explains electricity bills to help everyone understand electricity pricing and consumption across Canada."

Quick Facts

  • Quebec ranks first in electricity consumption per capita at 21.0 MW.h, followed by Saskatchewan at 20.0 MW.h, Newfoundland and Labrador at 19.3 MW.h.
  • About 95% of Quebec's electricity is produced from hydroelectricity.
  • Provinces that use electricity for home heating tend to consume the most electricity.
  • Canada's largest consuming sector for electricity was industrial at 238 TW.h. The residential and commercial sectors consumed 168 TW.h and 126 TW.h, respectively.
  • In 2018, Canada produced 647.7 terawatt hours (TW.h) of electricity. More than half of the electricity in Canada (61%) is generated from hydro sources. The remainder is produced from a variety of sources, such as fossil fuels (natural gas and petroleum), nuclear, wind, coal, biomass, solar.
  • Canada is a net exporter of electricity. In 2019, net exports to the U.S. electricity market totaled 47.0 TW.h.
  • The total value of Canada's electricity exports was $2.5 billion Canadian dollars and the value of imports was $0.6 billion Canadian dollars, resulting in 2019 net exports of $1.9 billion.
  • All regions in Canada are reflected in this report but it does not include data that reflects the COVID-19 lockdown and its effects on residential electricity bills.


Related News

View more

Global: Nuclear power: what the ‘green industrial revolution’ means for the next three waves of reactors

UK Nuclear Energy Ten Point Plan outlines support for large reactors, SMRs, and AMRs, funding Sizewell C, hydrogen production, and industrial heat to reach net zero, decarbonize transport and heating, and expand clean electricity capacity.


Key Points

A UK plan backing large, small, and advanced reactors to drive net zero via clean power, hydrogen, and industrial heat.

✅ Funds large plants (e.g., Sizewell C) under value-for-money models

✅ Invests in SMRs for factory-built, modular, lower-cost deployment

✅ Backs AMRs for high-temperature heat, hydrogen, and industry


The UK government has just announced its “Ten Point Plan for a Green Industrial Revolution”, in which it lays out a vision for the future of energy, transport and nature in the UK. As researchers into nuclear energy, my colleagues and I were pleased to see the plan is rather favourable to new nuclear power.

It follows the advice from the UK’s Nuclear Innovation and Research Advisory Board, pledging to pursue large power plants based on current technology, and following that up with financial support for two further waves of reactor technology (“small” and “advanced” modular reactors).

This support is an important part of the plan to reach net-zero emissions by 2050, as in the years to come nuclear power will be crucial to decarbonising not just the electricity supply but the whole of society.

This chart helps illustrate the extent of the challenge faced:

Electricity generation is only responsible for a small percentage of UK emissions. William Bodel. Data: UK Climate Change Committee

Efforts to reduce emissions have so far only partially decarbonised the electricity generation sector. Reaching net zero will require immense effort to also decarbonise heating, transport, as well as shipping and aviation. The plan proposes investment in hydrogen production and electric vehicles to address these three areas – which will require, as advocates of nuclear beyond electricity argue, a lot more energy generation.

Nuclear is well-placed to provide a proportion of this energy. Reaching net zero will be a huge challenge, and industry leaders warn it may be unachievable without nuclear energy. So here’s what the announcement means for the three “waves” of nuclear power.

Who will pay for it?
But first a word on financing. To understand the strategy, it is important to realise that the reason there has been so little new activity in the UK’s nuclear sector since the 1990s is due to difficulty in financing. Nuclear plants are cheap to fuel and operate and last for a long time. In theory, this offsets the enormous upfront capital cost, and results in competitively priced electricity overall.

But ever since the electricity sector was privatised, governments have been averse to spending public money on power plants. This, combined with resulting higher borrowing costs and cheaper alternatives (gas power), has meant that in practice nuclear has been sidelined for two decades. While climate change offers an opportunity for a revival, these financial concerns remain.

Large nuclear
Hinkley Point C is a large nuclear station currently under construction in Somerset, England. The project is well-advanced, with its first reactor installed and due to come online in the middle of this decade. While the plant will provide around 7% of current UK electricity demand, its agreed electricity price is relatively expensive.

Under construction: Hinkley Point C. Ben Birchall/PA

The government’s new plan states: “We are pursuing large-scale new nuclear projects, subject to value-for-money.” This is likely a reference to the proposed Sizewell C in Suffolk, on which a final decision is expected soon. Sizewell C would be a copy of the Hinkley plant – building follow-up identical reactors achieves capital cost reductions, and setbacks at Hinkley Point C have sharpened delivery focus as an alternative funding model will likely be implemented to reduce financing costs.

Other potential nuclear sites such as Wylfa and Moorside (shelved in 2018 and 2019 respectively for financial reasons) are also not mentioned, their futures presumably also covered by the “subject to value-for-money” clause.

Small nuclear
The next generation of nuclear technology, with various designs under development worldwide are smaller, cheaper, safer Small Modular Reactors (SMRs), such as the Rolls Royce “UK SMR”.

Reactors small enough to be manufactured in factories and delivered as modules can be assembled on site in much shorter times than larger designs, which in contrast are constructed mostly on site. In so doing, the capital costs per unit (and therefore borrowing costs) could be significantly lower than current new-builds.

The plan states “up to £215 million” will be made available for SMRs, Phase 2 of which will begin next year, with anticipated delivery of units around a decade from now.

Advanced nuclear
The third proposed wave of nuclear will be the Advanced Modular Reactors (AMRs). These are truly innovative technologies, with a wide range of benefits over present designs and, like the small reactors, they are modular to keep prices down.

Crucially, advanced reactors operate at much higher temperatures – some promise in excess of 750°C compared to around 300°C in current reactors. This is important as that heat can be used in industrial processes which require high temperatures, such as ceramics, which they currently get through electrical heating or by directly burning fossil fuels. If those ceramics factories could instead use heat from AMRs placed nearby, it would reduce CO₂ emissions from industry (see chart above).

High temperatures can also be used to generate hydrogen, which the government’s plan recognises has the potential to replace natural gas in heating and eventually also in pioneering zero-emission vehicles, ships and aircraft. Most hydrogen is produced from natural gas, with the downside of generating CO₂ in the process. A carbon-free alternative involves splitting water using electricity (electrolysis), though this is rather inefficient. More efficient methods which require high temperatures are yet to achieve commercialisation, however if realised, this would make high temperature nuclear particularly useful.

The government is committing “up to £170 million” for AMR research, and specifies a target for a demonstrator plant by the early 2030s. The most promising candidate is likely a High Temperature Gas-cooled Reactor which is possible, if ambitious, over this timescale. The Chinese currently lead the way with this technology, and their version of this reactor concept is expected soon.

In summary, the plan is welcome news for the nuclear sector, even as Europe loses nuclear capacity across the continent. While it lacks some specifics, these may be detailed in the government’s upcoming Energy White Paper. The advice to government has been acknowledged, and the sums of money mentioned throughout are significant enough to really get started on the necessary research and development.

Achieving net zero is a vast undertaking, and recognising that nuclear can make a substantial contribution if properly supported is an important step towards hitting that target.


Related News

View more

EIA: Pennsylvania exports the most electricity, California imports the most from other states

U.S. Electricity Trade by State, 2013-2017 highlights EIA grid patterns, interstate imports and exports, cross-border flows with Canada and Mexico, net exporters and importers, and market regions like ISOs and RTOs shaping consumption and generation.


Key Points

Brief EIA overview of interstate and cross-border power flows, ranking top net importers and exporters.

✅ Pennsylvania was the largest net exporter, averaging 59 million MWh.

✅ California was the largest net importer, averaging 77 million MWh.

✅ Top cross-border: NY, CA, VT, MN, MI imports; WA, TX, CA, NY, MT exports.


According to the U.S. Energy Information Administration (EIA) State Electricity Profiles, from 2013 to 2017, Pennsylvania was the largest net exporter of electricity, while California was the largest net importer.

Pennsylvania exported an annual average of 59 million megawatt-hours (MWh), while California imported an average of 77 million MWh annually.

Based on the share of total consumption in each state, the District of Columbia, Maryland, Massachusetts, Idaho and Delaware were the five largest power-importing states between 2013 and 2017, highlighting how some clean states import 'dirty' electricity as consumption outpaces local generation. Wyoming, West Virginia, North Dakota, Montana and New Hampshire were the five largest power-exporting states. Wyoming and West Virginia were net power exporting states between 2013 and 2017.

New York, California, Vermont, Minnesota and Michigan imported the most electricity from Canada or Mexico on average from 2013 to 2017, reflecting the U.S. look to Canada for green power during that period. Similarly, Washington, Texas, California, New York, and Montana exported the most electricity to Canada or Mexico, on average, during the same period.

Electricity routinely flows among the Lower 48 states and, to a lesser extent, between the United States and Canada and Mexico. From 2013 to 2017, Pennsylvania was the largest net exporter of electricity, sending an annual average of 59 million megawatthours (MWh) outside the state. California was the largest net importer, receiving an average of 77 million MWh annually.

Based on the share of total consumption within each state, the District of Columbia, Maryland, Massachusetts, Idaho, and Delaware were the five largest power-importing states between 2013 and 2017. Wyoming, West Virginia, North Dakota, Montana, and New Hampshire were the five largest power-exporting states. States with major population centers and relatively less generating capacity within their state boundaries tend to have higher ratios of net electricity imports to total electricity consumption, as utilities devote more to electricity delivery than to power production in many markets.

Wyoming and West Virginia were net power exporting states (they exported more power to other states than they consumed) between 2013 and 2017. Customers residing in these two states are not necessarily at an economic disadvantage or advantage compared with customers in neighboring states when considering their electricity bills and fees and market dynamics. However, large amounts of power trading may affect a state’s revenue derived from power generation.

Some states also import and export electricity outside the United States to Canada or Mexico, even as Canada's electricity exports face trade tensions today. New York, California, Vermont, Minnesota, and Michigan are the five states that imported the most electricity from Canada or Mexico on average from 2013 through 2017. Similarly, Washington, Texas (where electricity production and consumption lead the nation), California, New York, and Montana are the five states that exported the most electricity to Canada or Mexico, on average, for the same period.

Many states within the continental United States fall within integrated market regions, referred to as independent system operators or regional transmission organizations. These integrated market regions allow electricity to flow freely between states or parts of states within their boundaries.

EIA’s State Electricity Profiles provide details about the supply and disposition of electricity for each state, including net trade with other states and international imports and exports, and help you understand where your electricity comes from more clearly.


Related News

View more

Sign Up for Electricity Forum’s Newsletter

Stay informed with our FREE Newsletter — get the latest news, breakthrough technologies, and expert insights, delivered straight to your inbox.

Electricity Today T&D Magazine Subscribe for FREE

Stay informed with the latest T&D policies and technologies.
  • Timely insights from industry experts
  • Practical solutions T&D engineers
  • Free access to every issue

Download the 2025 Electrical Training Catalog

Explore 50+ live, expert-led electrical training courses –

  • Interactive
  • Flexible
  • CEU-cerified