Solar Is Now 33% Cheaper Than Gas Power in US, Guggenheim Says


Protective Relay Training - Basic

Our customized live online or in‑person group training can be delivered to your staff at your location.

  • Live Online
  • 12 hours Instructor-led
  • Group Training Available
Regular Price:
$699
Coupon Price:
$599
Reserve Your Seat Today

US Renewable Energy Cost Advantage signals cheaper utility-scale solar and onshore wind versus natural gas, with LCOE declines, tax credits, and climate policy cutting electricity costs for utilities and grids across the United States.


Key Points

Cheaper solar and wind than natural gas, driven by LCOE drops, tax credits, and policy, lowering US electricity costs.

✅ Utility-scale solar is about one-third cheaper than gas

✅ Onshore wind costs roughly 44 percent less than natural gas

✅ Policy and tax credits accelerate renewables and cut power prices


Natural gas’s dominance as power-plant fuel in the US is fading fast as the cost of electricity generated by US wind and solar projects tumbles and as wind and solar surpass coal in the generation mix, according to Guggenheim Securities.

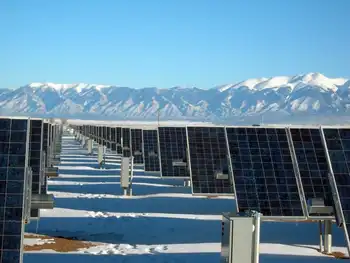
Utility-scale solar is now about a third cheaper than gas-fired power, while onshore wind is about 44% less expensive, Guggenheim analysts led by Shahriar Pourreza said Monday in a note to clients, a dynamic consistent with falling wholesale power prices in several markets today. 

“Solar and wind now present a deflationary opportunity for electric supply costs,” the analysts said, which “supports the case for economic deployment of renewables across the US,” as the country moves toward 30% wind and solar and one-fourth of total generation in the near term.

Gas prices have surged amid a global supply crunch after Russia’s invasion of Ukraine, while tax-credit extensions and sweeping US climate legislation have brought down the cost of wind and solar, even as renewables surpassed coal in 2022 nationwide. Renewables-heavy utilities like NextEra Energy Inc. and Allete Inc. stand to benefit, and companies that can boost spending on wind and solar, as wind, solar and batteries dominate the 2023 pipeline, will also see faster growth, Guggenheim said.
 

Related News

Solar produced 4.7% of U.S. electricity in 2022, generation up 25%

US Solar Electricity Generation 2022 rose to a 4.7% share, with 202,256 GWh, per EIA Electric Power Monthly; driven by PV capacity additions despite import constraints, alongside renewables trends in wind, nuclear, and hydroelectric output.


Key Points

The share and output of US solar PV in 2022: 4.7% of electricity and 202,256 GWh, as reported by the EIA.

✅ Solar PV reached 4.7% of US power; 202,256 GWh generated in 2022.

✅ Monthly share varied from about 3% in Jan to just over 6% in Apr.

✅ Wind was 10.1%; wind+solar hit slightly over 20% in April.


In 2022, solar photovoltaics made up 4.7% of U.S. electricity generation, an increase of almost 21% over the 2021 total when solar produced 3.9% of US electricity and about 3% in 2020 according to long-term outlooks. Total solar generation was up 25%, breaking through 200,000 GWh for the year.

The record deployment volumes of 2020 when renewables became the second-most U.S. electricity source and 2021 are the main factors behind this increase. If it were not for ongoing solar panel import difficulties and general inflation, solar’s contribution to electricity generation might have reached 5% in 2022. The data was released by the Department of Energy’s Energy Information Administration (EIA) in their Electric Power Monthly. This release includes data from December 2022, as well as the rest of the data from 2022.

Solar as a percentage of monthly electricity generation ranged from a low of almost 3% in January, to just over 6% in April. April’s production marked a new monthly record for solar generation in the US and coincided with a renewables share record that month.

Total generation of solar electricity peaked in July, at 21,708 GWh. Over the course of the year, solar production reached  202,256 GWh, and total U.S. electricity generation reached 4,303,980 GWh, a year in which renewables surpassed coal in the power mix overall. Total US electricity generation increased by 3.5% over the 4,157,467 GWh produced in 2021.

In 2022, wind energy contributed 10.1% of the total electricity generated in the United States. Wind and solar together produced 14.8% of U.S. electricity in 2022, growing from the 13% recorded in 2021. In April, when solar power peaked at just over 6%, wind and solar power together reached a peak of slightly over 20%, as a wind-and-solar milestone versus nuclear was noted that month, a new monthly record for the two energy sources.

In total, emissions free energy sources such as wind, solar photovoltaic and thermal, nuclear, hydroelectric, and geothermal, accounted for 37.9% of the total electricity generated in the U.S., while renewables provided about 25.5% share of the mix during the year. This value is barely higher than 2020’s 37.7% – but represents a return to growth after 2021 saw a decrease in emission free electricity to 37%.

Nuclear power was the most significant contributor to emission free electricity, making up a bit more than 45% of the total emissions free electricity. Wind energy ranked second at 26%, followed by hydroelectricity at 15%, and solar photovoltaic at 12%, confirming solar as the #3 renewable in the U.S. mix.

Emissions free electricity is a different summation than the EIA’s ‘Renewable Energy’ category. The Renewable Energy category also includes:

  • Wood and Wood-Derived Fuels
  • Landfill Gas
  • Biogenic Municipal Solid Waste
  • Other Waste Biomass

Nuclear produced 17.9% of the total U.S. electricity, a value that has generally stayed flat over the years. However, since nuclear facilities are being retired faster than new facilities are coming online, nuclear production has fallen in the past two years. After multiple long delays, we will probably see reactor three of the Vogtle nuclear facility come online in 2023. Reactor four is officially scheduled to come online later this year.

Hydroelectric production also declined in 2022, due to drought conditions in the southwestern United States. With rain and snow storms in California and the southwest, hydroelectricity generation may rebound in 2023.


Related News

View more

Total Cost of EV Ownership: New Data Reveals Long-Term Savings

Electric vehicles may cost more upfront but often save money long-term. A new MIT study shows the total cost of EV ownership is lower than gas cars when factoring in fuel, maintenance, and emissions.


Total cost of EV ownership is the focus of new MIT research showing electric vehicles offer both financial and environmental benefits over time.

✅ Electric vehicles cost more upfront but save money over their lifetime through lower fuel and maintenance costs

✅ MIT study confirms EVs have lower emissions and total ownership costs than most gas-powered cars

✅ New interactive tool helps consumers compare climate and cost impacts of EVs, hybrids, and traditional vehicles

Electric vehicles are better for the climate than gas‑powered cars, but many Americans are still reluctant to buy them. One reason: The larger upfront cost.

New data published Thursday shows that despite the higher sticker price, electric cars may actually save drivers money in the long-run.

To reach this conclusion, a team at the Massachusetts Institute of Technology calculated both the carbon dioxide emissions and full lifetime cost — including purchase price, maintenance and fuel — for nearly every new car model on the market.

They found electric cars were easily more climate friendly than gas-burning ones. Over a lifetime, they were often cheaper, too.

Jessika Trancik, an associate professor of energy studies at M.I.T. who led the research, said she hoped the data would “help people learn about how those upfront costs are spread over the lifetime of the car.”

For electric cars, lower maintenance costs and the lower costs of charging compared with gasoline prices tend to offset the higher upfront price over time. (Battery-electric engines have fewer moving parts that can break compared with gas-powered engines and they don’t require oil changes. Electric vehicles also use regenerative braking, which reduces wear and tear.)

As EV adoption continues to boom, more consumers are realizing the long-term savings and climate benefits. Ontario’s investment in EV charging stations reflects how infrastructure is beginning to catch up with demand. Despite regional energy pricing differences, EV charging costs remain lower than gasoline in nearly every U.S. city.

The cars are greener over time, too, despite the more emissions-intensive battery manufacturing process. Dr. Trancik estimates that an electric vehicle’s production emissions would be offset in anywhere from six to 18 months, depending on how clean the energy grid is where the car is charging.

In some areas, EVs are even being used to power homes, enhancing their value as a sustainable investment. Recent EPA rules aim to boost EV sales, further signaling government support. California leads the nation in EV charging infrastructure, setting a model for nationwide adoption.

The new data showed hybrid cars, which run on a combination of fuel and battery power, and can sometimes be plugged in, had more mixed results for both emissions and costs. Some hybrids were cheaper and spewed less planet-warming carbon dioxide than regular cars, but others were in the same emissions and cost range as gas-only vehicles.

Traditional gas-burning cars were usually the least climate friendly option, though long-term costs and emissions spanned a wide range. Compact cars were usually cheaper and more efficient, while gas-powered SUVs and luxury sedans landed on the opposite end of the spectrum.

Dr. Trancik’s team released the data in an interactive online tool to help people quantify the true costs of their car-buying decisions — both for the planet and their budget. The new estimates update a study published in 2016 and add to a growing body of research underscoring the potential lifetime savings of electric cars.

Take the Tesla Model 3, the most popular electric car in the United States. The M.I.T. team estimated the lifetime cost of the most basic model as comparable to a Nissan Altima that sells for $11,000 less upfront. (That’s even though Tesla’s federal tax incentive for electric vehicles has ended.)

Toyota’s Hybrid RAV4 S.U.V. also ends up cheaper in the long run than a similar traditional RAV4, a national bestseller, despite a higher retail price.

Hawaii, Alaska and parts of New England have some of the highest average electricity costs, while parts of the Midwest, West and South tend to have lower rates. Gas prices are lower along the Gulf Coast and higher in California. But an analysis from the Union of Concerned Scientists still found that charging a vehicle was more cost effective than filling up at the pump across 50 major American cities. “We saw potential savings everywhere,” said David Reichmuth, a senior engineer for the group’s Clean Transportation Program.

Still, the upfront cost of an electric vehicle continues to be a barrier for many would-be owners.

The federal government offers a tax credit for some new electric vehicle purchases, but that does nothing to reduce the initial purchase price and does not apply to used cars. That means it disproportionately benefits wealthier Americans. Some states, like California, offer additional incentives. President-elect Joseph R. Biden Jr. has pledged to offer rebates that help consumers swap inefficient, old cars for cleaner new ones, and to create 500,000 more electric vehicle charging stations, too.

EV sales projections for 2024 suggest continued acceleration, especially as costs fall and policy support expands. Chris Gearhart, director of the Center for Integrated Mobility Sciences at the National Renewable Energy Laboratory, said electric cars will become more price competitive in coming years as battery prices drop. At the same time, new technologies to reduce exhaust emissions are making traditional cars more expensive. “With that trajectory, you can imagine that even immediately at the purchase price level, certain smaller sedans could reach purchase price parity in the next couple of years,” Dr. Gearhart said.


Related Pages:

EV Boom Unexpectedly Benefits All Electricity Customers

Ontario Invests in New EV Charging Stations

EV Charging Cost Still Beats Gasoline, Study Finds

EPA Rules Expected to Boost U.S. Electric Vehicle Sales

California Takes the Lead in Electric Vehicle and Charging Station Adoption

EVs to Power Homes: New Technology Turns Cars Into Backup Batteries

U.S. Electric Vehicle Sales Soar Into 2024


View more

Wind Turbine Operations and Maintenance Industry Detailed Analysis and Forecast by 2025

Wind Turbine Operations and Maintenance Market is expanding as offshore and onshore renewables scale, driven by aging turbines, investment, UAV inspections, and predictive O&M services, despite skills shortages and rising logistics costs.


Key Points

Sector delivering inspection, repair, and predictive services to keep wind assets reliable onshore and offshore.

✅ Aging turbines and investor funding drive service demand

✅ UAV inspections and predictive analytics cut downtime

✅ Offshore growth offsets skills and logistics constraints


Wind turbines are capable of producing vast amounts of electricity at competitive prices, provided they are efficiently maintained and operated. Being a cleaner, greener source of energy, wind energy is also more reliable than other sources of power generation, with growth despite COVID-19 recorded across markets. Therefore, the demand for wind energy is slated to soar over the next few years, fuelling the growth of the global market for wind turbine operations and maintenance. By application, offshore and onshore wind turbine operations and maintenance are the two major segments of the market.


Global Wind Turbine Operations and Maintenance Market: Key Trends

The rising number of aging wind turbines emerges as a considerable potential for the growth of the market. The increasing downpour of funds from financial institutions and public and private investors has also been playing a significant role in the expansion of the market, with interest also flowing toward wave and tidal energy technologies that inform O&M practices. On the other hand, insufficient number of skilled personnel, coupled with increasing costs of logistics, remains a key concern restricting the growth of the market. However, the growing demand for offshore wind turbines across the globe is likely to materialize into fresh opportunities.


Global Wind Turbine Operations and Maintenance Market: Market Potential

A number of market players have been offering diverse services with a view to make a mark in the global market for wind turbine operations and maintenance. For instance, Scotland-based SgurrEnergy announced the provision of unmanned aerial vehicles (UAVs), commonly known as drones, as a part of its inspection services. Detailed and accurate assessments of wind turbines can be obtained through these drones, which are fitted with cameras, with four times quicker inspections than traditional methods, claims the company. This new approach has not only reduced downtime, but also has prevented the risks faced by inspection personnel.

The increasing number of approvals and new projects is preparing the ground for a rising demand for wind turbine operations and maintenance. In March 2017, for example, the Scottish government approved the installation of eight 6-megawatt wind turbines off the coast of Aberdeen, towards the northeast. The state of Maryland in the U.S. will witness the installation of a new offshore wind plant, encouraging greater adoption of wind energy in the country. The U.K., a leader in UK offshore wind deployment, has also been keeping pace with the developments, with the installation of a 400-MW offshore wind farm, off the Sussex coast throughout 2017. The Rampion project will be developed by E.on, who has partnered with Canada-based Enbridge Inc. and the UK Green Investment Bank plc.


Global Wind Turbine Operations and Maintenance Market: Regional Outlook

Based on geography, the global market for wind turbine operations and maintenance has been segmented into Asia Pacific, Europe, North America, and Rest of the World (RoW). Countries such as India, China, Spain, France, Germany, Scotland, and Brazil are some of the prominent users of wind energy and are therefore likely to account for a considerable share in the market. In the U.S., favorable government policies are backing the growth of the market, though analyses note that a prolonged solar ITC extension could pressure wind competitiveness. For instance, in 2013, a legislation that permits energy companies to transfer the costs of offshore wind credits to ratepayers was approved. Asia Pacific is a market with vast potential, with India and China being major contributors aiding the expansion of the market.


Global Wind Turbine Operations and Maintenance Market: Competitive Analysis

Some of the major companies operating in the global market for wind turbine operations and maintenance are Gamesa Corporacion Tecnologica, Xinjiang Goldwind Science & Technologies, Vestas Wind Systems A/S, Upwind Solutions, Inc, GE Wind Turbine, Guodian United Power Technology Company Ltd., Nordex SE, Enercon GmbH, Siemens Wind Power GmbH, and Suzlon Group. A number of firms have been focusing on mergers and acquisitions to extend their presence across new regions.


Related News

View more

Electric truck fleets will need a lot of power, but utilities aren't planning for it

Electric Fleet Grid Planning aligns utilities, charging infrastructure, distribution upgrades, and substation capacity to meet megawatt loads from medium- and heavy-duty EV trucks and buses, enabling managed charging, storage, and corridor fast charging.


Key Points

A utility plan to upgrade feeders and substations for EV fleets, coordinating charging, storage, and load management.

✅ Plans distribution, substation, and transformer upgrades

✅ Supports managed charging and on-site storage

✅ Aligns utility investment with fleet adoption timelines


As more electric buses and trucks enter the market, future fleets will require a lot of electricity for charging and will challenge state power grids over time. While some utilities in California and elsewhere are planning for an increase in power demand, many have yet to do so and need to get started.

This issue is critical, because freight trucks emit more than one-quarter of all vehicle emissions. Recent product developments offer growing opportunities to electrify trucks and buses and slash their emissions (see our recent white paper). And just last week, a group of 15 states plus D.C. announced plans to fully electrify truck sales by 2050. Utilities will need to be ready to power electric fleets.

Electric truck fleets need substantial power
Power for trucks and buses is generally more of an issue than for cars because trucks typically have larger batteries and because trucks and buses are often parts of fleets with many vehicles that charge at the same location. For example, a Tesla Model 3 battery stores 54-75 kWh; a Proterra transit bus battery stores 220-660 kWh. In Amsterdam, a 100-bus transit fleet is powered by a set of slow and fast chargers that together have a peak load of 13 MW (megawatts). This is equivalent to the power used by a typical large factory. And they are thinking of expanding the fleet to 250 buses.

California utilities are finding that grid capacity is often adequate in the short term, but that upgrade needs likely will grow in the medium term.
Many other fleets also will need a lot of "juice." For example, a rough estimate of the power needed to serve a fleet of 200 delivery vans at an Amazon fulfillment center is about 4 MW. And for electric 18-wheelers, chargers may need up to 2 MW of power each; a recent proposal calls for charging stations every 100 miles along the U.S. West Coast’s I-5 corridor, highlighting concerns about EVs and the grid as each site targets a peak load of 23.5 MW.

Utilities need distribution planning
These examples show the need for more power at a given site than most utilities can provide without planning and investment. Meeting these needs often will require changes to primary and secondary power distribution systems (feeders that deliver power to distribution transformers and to end customers) and substation upgrades. For large loads, a new substation may be needed. A paper recently released by the California Electric Transportation Coalition estimates that for loads over 5 MW, distribution system and substation upgrades will be needed most of the time. According to the paper, typical utility costs are $1 million to $9 million for substation upgrades, $150,000 to $6 million for primary distribution upgrades, and $5,000 to $100,000 for secondary distribution upgrades. Similarly, Black and Veatch, in a paper on Electric Fleets, also provides some general guidance, shown in the table below, while recognizing that each site is unique.

California policy pushes utilities toward planning
In California, state agencies and a statewide effort called CALSTART have been funding demonstration projects and vehicle and charger purchases for several years to support grid stability as electrification ramps up. The California Air Resources Board voted in June to phase in zero-emission requirements for truck sales, mandating that, beginning in 2024, manufacturers must increase their zero-emission truck sales to 30-50 percent by 2030 and 40-75 percent by 2035. By 2035, more than 300,000 trucks will be zero-emission vehicles.

California utilities operate programs that work with fleet owners to install the necessary infrastructure for electric vehicle fleets. For example, Southern California Edison operates the Charge Ready Transport program for medium- and heavy-duty fleets. Normally, when customers request new or upgraded service from the utility, there are fees associated with the new upgrade. With Charge Ready, the utility generally pays these costs, and it will sometimes pay half the cost of chargers; the customer is responsible for the other half and for charger installation costs. Sites with at least two electric vehicles are eligible, but program managers report that at least five vehicles are often needed for the economics to make sense for the utility.

One way to do this is to develop and implement a phased plan, with some components sized for future planned growth and other components added as needed. Southern California Edison, for example, has 24 commitments so far, and has a five-year goal of 870 sites, with an average of 10 chargers per site. The utility notes that one charger usually can serve several vehicles and that cycling of charging, some storage, and other load management techniques through better grid coordination can reduce capacity needs (a nominal 10 MW load often can be reduced below 5 MW).

Through this program, utility representatives are regularly talking with fleet operators, and they can use these discussions to help identify needed upgrades to the utility grid. For example, California transit agencies are doing the planning to meet a California Air Resources Board mandate for 100 percent electric or fuel cell buses by 2040; utilities are talking with the agencies and their consultants as part of this process. California utilities are finding that grid capacity is often adequate in the short term, but that upgrade needs likely will grow in the medium term (seven to 10 years out). They can manage grid needs with good planning (school buses generally can be charged overnight and don’t need fast chargers), load management techniques and some energy storage to address peak needs.

Customer conversations drive planning elsewhere
We also spoke with a northeastern utility (wishing to be unnamed) that has been talking with customers about many issues, including fleets. It has used these discussions to identify a few areas where grid upgrades might be needed if fleets electrify. It is factoring these findings into a broader grid-planning effort underway that is driven by multiple needs, including fleets. Even within an integrated planning effort, this utility is struggling with the question of when to take action to prepare the electric system for fleet electrification: Should it act on state or federal policy? Should it act when the specific customer request is submitted, or is there something in between? Recognizing that any option has scheduling and cost allocation implications, it notes that there are no easy answers.

Many utilities need to start paying attention
As part of our research, we also talked with several other utilities and found that they have not yet looked at how fleets might relate to grid planning. However, several of these companies are developing plans to look into these issues in the next year. We also talked with a major truck manufacturer, also wishing to remain unnamed, that views grid limitations as a key obstacle to truck electrification. 

Based on these cases, it appears that fleet electrification can have a substantial impact on electric grids and that, while these impacts are small at present, they likely will grow over time. Fleet owners, electric utilities, and utility regulators need to start planning for these impacts now, so that grid improvements can be made steadily as electric fleets grow. Fleet and grid planning should happen in parallel, so that grid upgrades do not happen sooner or later than needed but are in place when needed, including the move toward a much bigger grid as EV adoption accelerates. These grid impacts can be managed and planned for, but the time to begin this planning is now.


Related News

View more

DOE Issues Two LNG Export Authorizations

DOE LNG Export Approvals expand flexibility for Cheniere's Sabine Pass and Corpus Christi to ship to non-FTA countries, boosting U.S. supply to Europe while advancing methane emissions reductions and strengthening global energy security.


Key Points

DOE LNG export approvals authorize Sabine Pass and Corpus Christi to sell full-capacity LNG to non-FTA markets.

✅ Exports allowed to any non-FTA country, including Europe

✅ Capacity covers Sabine Pass and Corpus Christi terminals

✅ DOE targets methane reductions across oil and gas


The U.S. Department of Energy (DOE) today issued two long-term orders authorizing liquefied natural gas (LNG) exports from two current operating LNG export projects, Cheniere Energy Inc.’s Sabine Pass in Louisiana and Corpus Christi in Texas, following a recent deep freeze that slammed the American energy sector.

The two orders allow Sabine Pass and Corpus Christi additional flexibility to export the equivalent of 0.72 billion cubic feet per day of natural gas as LNG to any country with which the U.S. does not have a free trade agreement, including all of Europe, such as the UK natural gas market as well.

While U.S. exporters are already exporting at or near their maximum capacity, with today's issuances, every operating U.S. LNG export project has approval from DOE to export its full capacity to any country where not prohibited by U.S. law or policy constraints in place.

The U.S. is now the top global exporter of LNG and exports are set to grow an additional 20% beyond current levels by the end of this year as additional capacity comes online, even as a domestic energy crisis influences electricity and gas markets.  In January 2022, U.S. LNG supplied more than half of the LNG imports into Europe for the month.

With the expected rise in LNG exports, DOE is particularly focused on driving down methane emissions in the oil and gas sector both domestically and abroad, leveraging the deep technical expertise of the Department, and supporting nuclear innovation as well.

U.S. LNG remains an important component to global energy security worldwide and DOE remains committed to finding ways to help our allies and trading partners, including support to Ukraine and others with the energy supplies they need while continuing to work to mitigate the impact of climate change.


Related News

View more

Renewable Electricity Is Coming on Strong

Cascadia electrification accelerates renewable energy with wind and solar, EVs, heat pumps, and grid upgrades across British Columbia, Washington, and Oregon to decarbonize power, buildings, and transport at lower cost while creating jobs.


Key Points

Cascadia electrification is the shift to renewable grids, EVs, and heat pumps replacing fossil fuels.

✅ Wind and solar scale fast; gas and coal phase down

✅ EVs and heat pumps cut fuel costs and emissions

✅ Requires grid upgrades, policy, and social acceptance


Fifty years ago, a gasoline company’s TV ads showed an aging wooden windmill. As the wind died, it slowed to stillness. The ad asked: “But what do you do when the wind stops?” For the next several decades, fossil fuel providers and big utilities continued to denigrate renewable energy. Even the U.S. Energy Department deemed renewables “too rare, too diffuse, too distant, too uncertain and too ill-timed” to meaningfully contribute, as a top agency analyst put it in 2005.

Today we know that’s not true, especially in British Columbia, Washington and Oregon.

New research shows we could be collectively poised to pioneer a climate-friendly energy future for the globe — that renewable electricity can not only move Cascadia off of fossil fuels, but do so at an affordable price while creating some jobs along the way.

After decades of disinformation, this may sound like a wishful vision. But building a cleaner and more equitable economy — and doing so in just a few decades to head off the worst effects of climate change — is backed by a growing body of regional and international research.

Getting off fossil fuels is “feasible, necessary… and not very expensive” when compared to the earnings of the overall economy, said Jeffrey Sachs, an economist and global development expert at Columbia University.

Much of the confidence about the price tag comes down to this: Innovation and mass production have made wind and solar power installations cheaper than most fossil-fuelled power plants and today’s fastest-growing source of energy worldwide. The key to moving Cascadia’s economies away from fossil fuels, according to the latest research, is building more, prompting power companies to invest in carbon-free electricity as our go-to “fuel.”

However, doing that in time to help head off a cascading climatic crisis by mid-century means the region must take major steps in the next decade to speed the transition, researchers say. And that will require social buy-in.

The new research highlights three mutually supporting strategies that squeeze out fossil fuels:

Chefs and foodies are well-known fans of natural gas. Why, “Cooking with gas” is an expression for a reason. But one trendy Seattle restaurant-bar is getting by just fine with a climate-friendly alternative: electric induction cooktops.

Induction “burners” are just as controllable as gas burners and even faster to heat and cool, but produce less excess heat and zero air pollution. That made a huge difference to chef Stuart Lane’s predecessors when they launched Seattle cocktail bar Artusi 10 years ago.

Using induction meant they could squeeze more tables into the tight space available next door to Cascina Spinasse — their popular Italian restaurant in Seattle’s vibrant Capitol Hill neighborhood — and lowered the cost of expanding.

Rather than igniting a fossil fuel to roast the surface of pots and pans, induction burners generate a magnetic field that heats metal cookware from inside. For people at home, forgoing gas eliminates combustion by-products, which means fewer asthma attacks and other health impacts.

For Artusi, it eliminated the need for a pricey hood and fans to continuously pump fumes and heat out and pull fresh air in. That made induction the cheaper way to go, even though induction cooktops cost more than conventional gas ranges.

Over the years, they’ve expanded the menu because even guests who come for the signature Amari cocktails often stay for the handmade pasta, meatballs and seasonal sauces. So the initial pair of induction burners has multiplied to nine. Yet Artusi retains a cleaner, quieter and more intimate atmosphere. Yet thanks largely to the smaller fans, “it’s not as chaotic,” said Lane.

And Lane adds, it feels good to be cooking on electricity — which in Seattle proper is about 90 per cent renewable — rather than on a fossil fuel that produces climate-warming greenhouse gases. “You feel like you’re doing something right,” he said.

Lane says he wouldn’t be surprised if induction is the new normal for chefs entering the trade 10 years from now. “They probably would cook with gas and say, ‘Damn it’s hot in here!’” — Peter Fairley

This story is supported in part by a grant from the Fund for Investigative Journalism.

increasing energy efficiency to trim the amount of power we need,

boosting renewable energy to make it possible to turn off climate-wrecking fossil-fuel plants, and

plugging as much stuff as possible into the electrical grid.
Recent studies in B.C. and Washington state, and underway for Oregon, point to efficiency and electrification as the most cost-effective route to slashing emissions while maintaining lifestyles and maximizing jobs. A recent National Academies of Science study reached the same conclusion, calling electrification the core strategy for an equitable and economically advantageous energy transition, while abroad New Zealand's electrification push is asking whether electricity can replace fossil fuels in time.

However, technologies don’t emerge in a vacuum. The social and economic adjustments required by the wholesale shift from fossil fuels that belch climate-warming carbon emissions to renewable power can still make or break decarbonization, according to Jim Williams, a University of San Francisco energy expert whose simulation software tools have guided many national and regional energy plans, including two new U.S.-wide studies, a December 2020 analysis for Washington state and another in process for Oregon.

Williams points to vital actions that are liable to rile up those who lose money in the deal. Steps like letting trees grow many decades older before they are cut down, so they can suck up more carbon dioxide — which means forgoing quicker profits from selling timber. Or convincing rural communities and conservationists that they should accept power-transmission lines crossing farms and forests.

“It’s those kinds of policy questions and social acceptance questions that are the big challenges,” said Williams.

Washington, Oregon and B.C. already mandate growing supplies of renewable power and help cover the added cost of some electric equipment, and across the border efforts at cleaning up Canada's electricity are critical to meeting climate pledges. These include battery-powered cars, SUVs and pickups on the road. Heat pumps — air conditioners that run in reverse to push heat into a building — can replace furnaces. And, at industrial sites, electric machines can take the place of older mechanical systems, cutting costs and boosting reliability.

As these options drop in price they are weakening reliance on fossil fuels — even among professional chefs who’ve long sworn by cooking with gas (see sidebar: Cooking quick, clean and carbon-free).

“For each of the things that we enjoy and we need, there’s a pathway to do that without producing any greenhouse gas emissions,” said Jotham Peters, managing partner for Vancouver-based energy analysis firm Navius Research, whose clients include the B.C. government.


What the modelling tells us

Key to decarbonization planning for Cascadia are computer simulations of future conditions known as models. These projections take electrification and other options and run with them. Researchers run dozens of simulated potential future energy scenarios for a given region, tinkering with different variables: How much will energy demand grow? What happens if we can get 80 per cent of people into electric cars? What if it’s only 50 per cent? And so on.

Accelerating the transition requires large investments, this modelling shows. Plugging in millions of vehicles and heat pumps demands both brawnier and more flexible power systems, including more power lines and other infrastructure such as bridging the Alberta-B.C. electricity gap that communities often oppose. That demands both stronger policies and public acceptance. It means training and apprenticeships for the trades that must retrofit homes, and ensuring that all communities benefit — especially those disproportionately suffering from energy-related pollution in the fossil fuel era.

Consensus is imperative, but the new studies are bound to spark controversy. Because, while affordable, decarbonization is not free.

The Meikle Wind Project in BC’s Peace River region, the province’s largest, with 61 turbines producing 184.6 MW of electricity, went online in 2017. Photo: Pattern Development.
Projections for British Columbia and Washington suggest that decarbonizing Cascadia will spur extra job-stimulating growth. But the benefits and relatively low net cost mask a large swing in spending that will create winners and losers, and without policies to protect disadvantaged communities from potential energy cost increases, could leave some behind.

By 2030, the path to decarbonization shows Washingtonians buying about $5 billion less worth of natural gas, coal and petroleum products, while putting even more dollars toward cleaner vehicles and homes. No surprise then that oil and gas interests are attacking the new research.

And the research shows a likely economic speed bump around 2030. Economic growth would slow due to increased energy costs as economies race to make a sharp turn toward pollution reductions after nearly a decade of rising greenhouse gas emissions.

“Meeting that 2030 target is tough and I think it took everybody a little bit by surprise,” said Nancy Hirsh, executive director of the Seattle-based NW Energy Coalition, and co-chair of a state panel that shaped Washington’s recent energy supply planning.

But that’s not cause to ease up. Wait longer, says Hirsh, and the price will only rise.


Charging up

What most drives Cascadia’s energy models toward electrification is the dropping cost of renewable electricity.

Take solar energy. In 2010, no large power system in the world got more than three per cent of its electricity from solar. But over the past decade, solar energy’s cost fell more than 80 per cent, and by last year it was delivering over nine per cent of Germany’s electricity and over 19 per cent of California’s.

Government mandates and incentives helped get the trend started, and Canada's electricity progress underscores how costs continue to fall. Once prohibitively expensive, solar’s price now beats nuclear, coal and gas-fired power, and it’s expected to keep getting cheaper. The same goes for wind power, whose jumbo jet-sized composite blades bear no resemblance to the rickety machines once mocked by Big Oil.

In contrast, cleaning up gas- or coal-fired power plants by equipping them to capture their carbon pollution remains expensive even after decades of research and development and government incentives. Cost overruns and mechanical failures recently shuttered the world’s largest “low-carbon” coal-fired power plant in Texas after less than four years of operation.

Retrofits enabled this coal-fired plant in Texas to capture some of its carbon dioxide pollution, which was then injected into aging oil wells to revive production. But problems made the plant’s coal-fired power — which is being priced out by renewable energy — even less competitive and it was shut down after three years in 2020. Photo by NRG Energy.
Innovation and incentives are also making equipment that plugs into the grid cheaper. Electric options are good and getting better with a push from governments and a self-reinforcing cycle of performance improvement, mass production and increased demand.

Battery advances and cost cuts over the past decade have made owning an electric car cheaper, fuel included, than conventional cars. Electric heat pumps may be the next electric wave. They’re three to four times more efficient than electric baseboard heaters, save money over natural gas in most new homes, and work in Cascadia’s coldest zones.

Merran Smith, executive director of the Vancouver-based non-profit Clean Energy Canada, says that — as with electric cars five years ago — people don’t realize how much heat pumps have improved. “Heat pumps used to be big huge noisy things,” said Smith. “Now they’re a fraction of the size, they’re quiet and efficient.”

Electrifying certain industrial processes can also cut greenhouse gases at low cost. Surprisingly, even oil and gas drilling rigs and pipeline compressors can be converted to electric. Provincial utility BC Hydro is building new transmission lines to meet anticipated power demand from electrification of the fracking fields in northeastern British Columbia that supply much of Cascadia’s natural gas.


Simulating low-carbon living

The computer simulation tools guiding energy and climate strategies, unlike previous models that looked at individual sectors, take an economy-wide view. Planners can repeatedly run scenarios through sophisticated software, tinkering with their assumptions each time to answer cross-cutting questions such as: Should the limited supply of waste wood from forestry that can be sustainably removed from forests be burned in power plants? Or is it more valuable converted to biofuel for airplanes that can’t plug into the grid?

Evolved Energy Research, a San Francisco-based firm, analyzed the situation in Washington. Its algorithms are tuned using data about energy production and use today — down to the number and types of furnaces, stovetops or vehicles. It has expert assessments of future costs for equipment and fuels. And it knows the state’s mandated emissions targets.

Researchers run the model myriad times, simulating decisions about equipment and fuel purchases — such as whether restaurants stick with gas or switch to electric induction “burners” as their gas stoves wear out. The model finds the most cost-effective choices by homes and businesses that meet the state’s climate goals.

For Seattle wine bar Artusi, going with electric induction cooktops meant they could squeeze more tables into a tight, comfortable space. Standard burners cost less but would have required noisy, pricey fume hoods and fans to suck out the pollutants. For more, see sidebar. Photo: InvestigateWest.
Rather than accepting that optimal scenario and calling it a day, modellers account for uncertainty in their estimates of future costs by throwing in various additional constraints and rerunning the model.

That probing shows that longer reliance on climate-warming natural gas and petroleum fuels increases costs. In fact, all of the climate-protecting scenarios achieve Washington’s goals at relatively low cost, compared to the state’s historic spending on energy.

The end result of these scenarios are net-zero carbon emissions in 2050, echoing Canada's race to net-zero and the growing role of renewable energy, in which a small amount of emissions remaining are offset by rebounding forests or equipment that scrubs CO2 from the air.

But the seeds of that transformation must be sown by 2030. The scenarios identify common strategies that the state can pursue with low risk of future regrets.

One no brainer is to rapidly add wind and solar power to wring out CO2 emissions from Washington’s power sector. The projections end coal-fired power by 2025, as required by law, but also show that, with grid upgrades, gas-fired power plants that produce greenhouse gas emissions can stay turned off most of the time. That delivers about 16.2 million of the 44.8 million metric tons of CO2 emissions cut required by 2030 under state law.

All of the Washington scenarios also jack up electricity consumption to power cars and heating. By 2050, Washington homes and businesses would draw more than twice as much power from the grid as they did last year, meaning climate-friendly electricity is displacing climate-unfriendly gasoline, diesel fuel and natural gas. In the optimal case, electricity meets 98 per cent of transport energy in 2050, and over 80 per cent of building energy use.

By 2050, the high-electrification scenarios would create over 60,000 extra jobs across the state, as replacing old and inefficient equipment and construction of renewable power plants stimulates economic growth, according to projections from Washington, D.C.-based FTI Consulting. Scenarios with less electrification require more low-carbon fuels that cut emissions at higher cost, and thus create 15,000 to 35,000 fewer jobs.

Much of the new employment comes in middle-class positions — including about half of the total in construction — leading to big boosts in employment income. Washingtonians earn over $7 billion more in 2050 under the high-electrification scenarios, compared to a little over $5 billion if buildings stick with gas heating through 2050 and less than $2 billion with extra transportation fuels.


Rocketing to 2030

Evolved Energy’s electrification-heavy decarbonization pathways for Washington dovetail with a growing body of international research, such as that National Academy of Sciences report and a major U.S. decarbonization study led by Princeton University, and in Canada debates like Elizabeth May's 2030 renewable grid goal are testing feasibility. (See Grist’s 100 per cent Clean Energy video for a popularized view of similar pathways to slash U.S. carbon emissions, informed by Princeton modeller Jesse Jenkins.)


Related News

View more

Sign Up for Electricity Forum’s Newsletter

Stay informed with our FREE Newsletter — get the latest news, breakthrough technologies, and expert insights, delivered straight to your inbox.

Electricity Today T&D Magazine Subscribe for FREE

Stay informed with the latest T&D policies and technologies.
  • Timely insights from industry experts
  • Practical solutions T&D engineers
  • Free access to every issue

Live Online & In-person Group Training

Advantages To Instructor-Led Training – Instructor-Led Course, Customized Training, Multiple Locations, Economical, CEU Credits, Course Discounts.

Request For Quotation

Whether you would prefer Live Online or In-Person instruction, our electrical training courses can be tailored to meet your company's specific requirements and delivered to your employees in one location or at various locations.