NFPA 70E Training
Our customized live online or in‑person group training can be delivered to your staff at your location.

- Live Online
- 6 hours Instructor-led
- Group Training Available
Regular Price:
$199
Coupon Price:
$149
The Shenhua Group, China's biggest coal producer, is planning to launch the country's first carbon capture and storage (CCS) project.
China's first commercial CCS facility will be built at the company's 24.5 billion yuan (US$3.58bn) coal-to-liquids plant at Ordos in Inner Mongolia, which is expected to go into full operation later this year, the state-owned assets Supervision and Administration Commission said on its website.
With China still dependent on coal to meet the bulk of its energy needs, carbon capture and storage has been identified as a crucial element in the country's efforts to reduce greenhouse gas emissions, currently believed to be the highest in the world.
However, there are still doubts about the commercial and environmental viability of CCS technology, which has not yet been ratified by the United Nations Framework Convention on Climate Change amid concerns about the long-term safety of underground storage sites.
The Chinese Government curtailed its coal liquefaction program last year amid concerns about pollution and excessive water consumption. Shenhua's Ordos plant is one of only two major facilities that has been allowed to go ahead.
David Trimm, an expert with Australia's Commonwealth Scientific and Industrial Research Organization, said that carbon sequestration will play an important role in the development of coal-to-liquids technology.
"But the problem is where to sequester it. Usually they put it in a saline aquifer, but I am not sure if there is anywhere suitable in China," he said.
Scientists behind a pilot CCS project launched by China's Ministry of Science and Technology and the British Geological Survey in 2007 have also been looking into the possibility of storing carbon in depleted oil and gas fields and unmined coal seams.
The statement said that Shenhua's carbon capture facility would be put into full operation within two years.
Related News
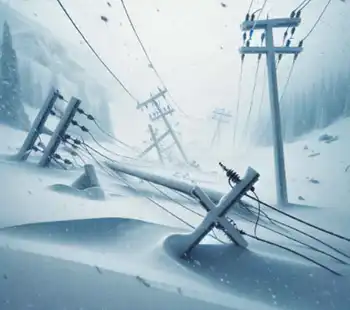
Canadian Electricity Grids Increasingly Exposed to Harsh Weather
North American Grid Reliability faces extreme weather, climate change, demand spikes, and renewable variability; utilities,…
View more
Georgia Power customers to see $21 reduction on June bills
Georgia Power June bill credit delivers PSC-approved savings, lower fuel rates, and COVID-19 relief for…
View more
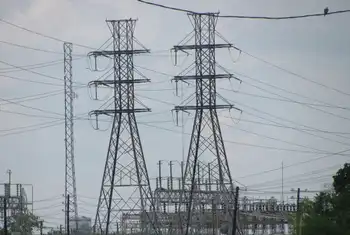
Electricity complaints filed by Texans reach three-year high, report says
Texas Electricity Complaints surged to a three-year high, highlighting Public Utility Commission data on billing…
View more

Power outage update: 252,596 remain without electricity Wednesday
North Carolina Power Outages continue after Hurricane Florence, with Wilmington and Eastern Carolina facing flooding,…
View more

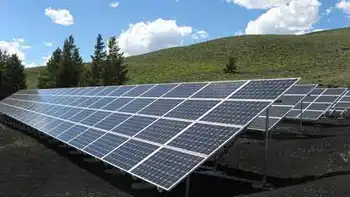
Zero-emission electricity in Canada by 2035 is practical and profitable
Canada 100% Renewable Power by 2035 envisions a decentralized grid built on wind, solar, energy…
View more
N.S. abandons Atlantic Loop, will increase wind and solar energy projects
Nova Scotia Clean Power Plan 2030 pivots from the Atlantic Loop, scaling wind and solar,…
View more
Sign Up for Electricity Forum’s Newsletter
Stay informed with our FREE Newsletter — get the latest news, breakthrough technologies, and expert insights, delivered straight to your inbox.
Electricity Today T&D Magazine Subscribe for FREE

Stay informed with the latest T&D policies and technologies.
- Timely insights from industry experts
- Practical solutions T&D engineers
- Free access to every issue

