Substation Relay Protection Training
Our customized live online or in‑person group training can be delivered to your staff at your location.

- Live Online
- 12 hours Instructor-led
- Group Training Available
Regular Price:
$699
Coupon Price:
$599
WASHINGTON
—
Maxeon IBC Solar Factory USA will scale clean energy with high-efficiency interdigitated back contact panels, DOE-backed manufacturing in Albuquerque, utility-scale supply, domestic production, 3 GW capacity, reduced imports, carbon-free electricity leadership.
What's Going On
DOE-backed Albuquerque plant making high-efficiency IBC panels, 3 GW yearly, for utility-scale, domestic solar supply.
8M panels/yr; 3 GW IBC module output from new NM facility
Backed by US DOE Loan Programs Office financing support
Aims to cut reliance on imports; shift focus to utility-scale projects
24.7% IBC efficiency; pairing with batteries boosts grid reliability
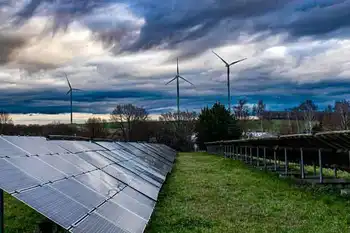
Solar energy stands as a formidable source of carbon-free electricity, with the No. 3 renewable source in the U.S. offering a clean alternative to traditional power generation methods reliant on polluting fuels. Advancements in solar technology continue to emerge, with a U.S.-based company poised to spearhead progress from a cutting-edge factory in New Mexico.
Maxeon, initially hailing from Silicon Valley in the 1980s, recently ventured into independence after separating from its parent company, SunPower, in 2020. Over the past few years, Maxeon has been manufacturing solar panels in Mexico, Malaysia, and the Philippines, as record U.S. panel shipments underscored rising demand.
Now, with backing from the U.S. Department of Energy's Loans Programs Office, Maxeon is preparing to commence construction on a new facility in Albuquerque in 2024, amid unprecedented growth in solar and storage nationwide. This state-of-the-art factory aims to produce up to 8 million panels annually, featuring the company's interdigitated back contact (IBC) technology, which has the capacity to generate three gigawatts of power each year. Notably, the entire U.S. solar industry completed five gigawatts of panels in 2022, making Maxeon's endeavor particularly ambitious and aligned with Biden's proposed tenfold increase in solar power goals.
Maxeon's presence in the United States holds the potential to reduce the country's reliance on imported panels, particularly from China. The primary focus will be on providing this advanced technology for utility departments, where pairing with increasingly affordable batteries can enhance grid reliability while shifting away from residential and commercial rooftops.
Maxeon has achieved a remarkable milestone in solar efficiency, with its latest IBC technology boasting an efficiency rating of 24.7%, as reported by PV Magazine.
This strategic move to the United States could be a game-changer, not only for Maxeon's success but also for clean power generation in a nation that has traditionally depended on external sources for its supply of solar panels, as energy-hungry Europe turns to U.S. solar equipment makers for solutions. Matt Dawson, Maxeon's Chief Technology Officer, emphasized the importance of achieving the lowest levelized cost of electricity with the lowest overall capital, a feat that China has accomplished in recent years due to the strength of its supply chain. As energy independence becomes a global concern, solar manufacturing is poised to expand beyond China, with Southeast Asia already showing signs of growth, and now the United States and possibly Europe, including Germany's solar boost during the energy crisis, following suit.
Related News
Related News

OEB Launches New 2026 Public EV Charging Rate
Ontario’s energy regulator will introduce a discounted charging-station electricity rate in 2026, cutting delivery costs…
View more
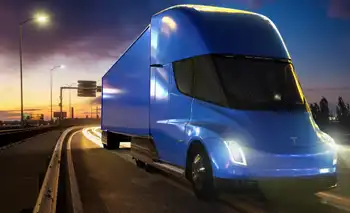
Electric truck fleets will need a lot of power, but utilities aren't planning for it
Electric Fleet Grid Planning aligns utilities, charging infrastructure, distribution upgrades, and substation capacity to meet…
View more
Shanghai Electric Signs Agreement to Launch PEM Hydrogen Production Technology R&D Center, Empowering Green Hydrogen Development in China
Shanghai Electric PEM Hydrogen R&D Center advances green hydrogen via PEM electrolysis, modular megawatt electrolyzers,…
View more
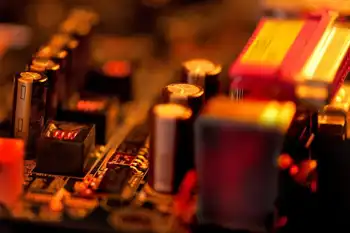
This Thin-Film Turns Heat Waste From Electronics Into Electricity
Pyroelectric Energy Harvesting captures low-grade heat via thin-film materials, converting temperature fluctuations into power for…
View more

Cost is the main reason stopping Canadians from buying an electric car: Survey
Canada EV Incentives drive adoption toward the 2035 zero-emission target, with rebates, federal and provincial…
View more
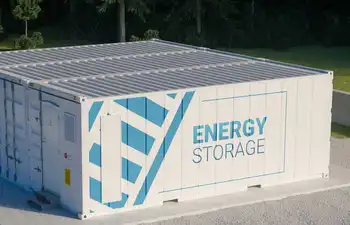
Canada's largest electricity battery storage project coming to southwestern Ontario
Oneida Energy Storage Project, a 250 MW lithium-ion battery in Haldimand County, enhances Ontario's clean…
View more
Sign Up for Electricity Forum’s Newsletter
Stay informed with our FREE Newsletter — get the latest news, breakthrough technologies, and expert insights, delivered straight to your inbox.
Electricity Today T&D Magazine Subscribe for FREE

Stay informed with the latest T&D policies and technologies.
- Timely insights from industry experts
- Practical solutions T&D engineers
- Free access to every issue
