High Voltage Maintenance Training Online
Our customized live online or in‑person group training can be delivered to your staff at your location.

- Live Online
- 12 hours Instructor-led
- Group Training Available
Regular Price:
$599
Coupon Price:
$499
Morocco Renewable Energy Strategy drives wind power, solar energy, and energy efficiency to cut import dependence, add megawatts of capacity, expand grid access, and run auctions and feasibility studies via a new national agency.
What You Need to Know
Policy to expand wind, solar, and efficiency, cut imports, grow capacity, and scale projects via a new national agency.
- Morocco imports 97% of energy; ~$7B, about 10% of GDP
- Installed capacity totals 5,292 MW nationwide
- Per-capita use: 685 kWh; grid access at 95%
- Wind: 254 MW online; >1,400 MW in pipeline
- New agency to run bids, studies, finance, local content
Morocco is a country with no domestic fossil fuels production. The country has high energy use, and the demand for energy is growing between 5 and 8 annually.
Morocco imports 97 of its energy, the equivalent of about 10 of the countrys GDP, or $7 billion.
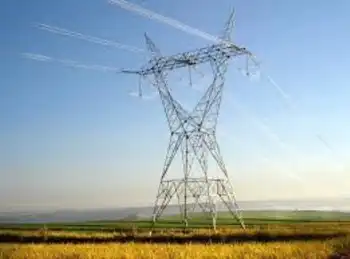
Morocco has 5,292 megawatts MW of installed capacity. Energy consumption per inhabitant is 685 kilowatt-hours per year, with 95 percent of the population having grid access as solar projects reinforce the Moroccan grid nationwide.
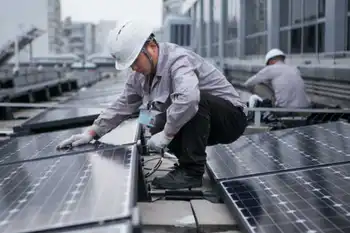
Morocco is focusing on renewable energy sources to secure energy demand and achieve sustainable development. Wind is the most competitive renewable energy in Morocco. With Morocco's 3,000 hours of sunshine per year, solar energy is the next strongest renewable source as the country advances a 2,000-MW solar project pipeline to boost supply.
Wind currently provides 254 MW of power to Morocco's national grid, and more than 1,400 MW of projects are in the feasibility study or bidding stages, with the Alstom wind farm project underscoring investor interest across the sector.
In February, Morocco created the National Agency for Developing Renewable Energy and Energy Efficiency, which has since launched a solar power initiative to coordinate programs. The agency help increase renewable energy capacity, carry our feasibility studies for renewable projects and provide financial assistance to renewable energy service companies.
Ahmed Barudy, the nominated general manager for the company, said the company will be responsible for accepting bids for renewable energy projects as Morocco seeks investors for wind farms to scale capacity, participating in renewable ventures and supporting local manufacturing of renewable energy assets.
Related News
Related News
Duke Energy Florida to build its largest battery storage projects yet
Duke Energy Florida battery storage will add 22 MW across Trenton, Cape San Blas and…
View more

China's Data Centers Alone Will Soon Use More Electricity Than All Of Australia
Cloud Data Centers Environmental Impact highlights massive electricity use, carbon emissions, and cooling demands, with…
View more

Climate change: Greenhouse gas concentrations again break records
Rising Greenhouse Gas Concentrations drive climate change, with CO2, methane, and nitrous oxide surging; WMO…
View more
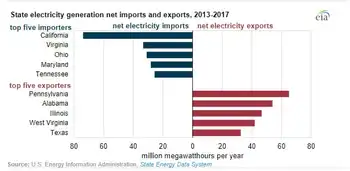
EIA: Pennsylvania exports the most electricity, California imports the most from other states
U.S. Electricity Trade by State, 2013-2017 highlights EIA grid patterns, interstate imports and exports, cross-border…
View more
Rio Tinto Completes Largest Off-Grid Solar Plant in Canada's Northwest Territories
Rio Tinto Off-Grid Solar Power Plant showcases renewable energy at the Diavik Diamond Mine in…
View more
Solar Now ‘cheaper Than Grid Electricity’ In Every Chinese City, Study Finds
China Solar Grid Parity signals unsubsidized industrial and commercial PV, rooftop solar, and feed-in tariff…
View more
Sign Up for Electricity Forum’s Newsletter
Stay informed with our FREE Newsletter — get the latest news, breakthrough technologies, and expert insights, delivered straight to your inbox.
Electricity Today T&D Magazine Subscribe for FREE

Stay informed with the latest T&D policies and technologies.
- Timely insights from industry experts
- Practical solutions T&D engineers
- Free access to every issue

