Renewables became the second-most prevalent U.S. electricity source in 2020


2020 us renewables graph

High Voltage Maintenance Training Online

Our customized live online or in‑person group training can be delivered to your staff at your location.

  • Live Online
  • 12 hours Instructor-led
  • Group Training Available
Regular Price:
$599
Coupon Price:
$499
Reserve Your Seat Today

2020 U.S. Renewable Electricity Generation set a record as wind, solar, hydro, biomass, and geothermal produced 834 billion kWh, surpassing coal and nuclear, second only to natural gas in nationwide power output.


Key Points

The record year when renewables made 834 billion kWh, topping coal and nuclear in U.S. electricity.

✅ Renewables supplied 21% of U.S. electricity in 2020

✅ Coal output fell 20% y/y; nuclear slipped 2% on retirements

✅ EIA forecasts renewables rise in 2021-2022; coal rebounds


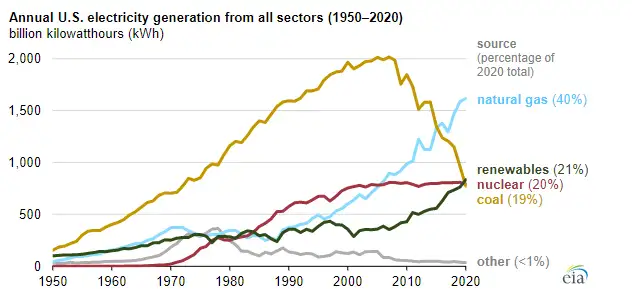
In 2020, renewable energy sources (including wind, hydroelectric, solar, biomass, and geothermal energy) generated a record 834 billion kilowatthours (kWh) of electricity, or about 21% of all the electricity generated in the United States. Only natural gas (1,617 billion kWh) produced more electricity than renewables in the United States in 2020. Renewables surpassed both nuclear (790 billion kWh) and coal (774 billion kWh) for the first time on record. This outcome in 2020 was due mostly to significantly less coal use in U.S. electricity generation and steadily increased use of wind and solar generation over time, amid declining consumption trends nationwide.

In 2020, U.S. electricity generation from coal in all sectors declined 20% from 2019, while renewables, including small-scale solar, increased 9%. Wind, currently the most prevalent source of renewable electricity in the United States, grew 14% in 2020 from 2019, and the EIA expects solar and wind to be larger sources in summer 2022, reflecting continued growth. Utility-scale solar generation (from projects greater than 1 megawatt) increased 26%, and small-scale solar, such as grid-connected rooftop solar panels, increased 19%, while early 2021 January power generation jumped year over year.

Coal-fired electricity generation in the United States peaked at 2,016 billion kWh in 2007 and much of that capacity has been replaced by or converted to natural gas-fired generation since then. Coal was the largest source of electricity in the United States until 2016, and 2020 was the first year that more electricity was generated by renewables and by nuclear power than by coal (according to our data series that dates back to 1949). Nuclear electric power declined 2% from 2019 to 2020 because several nuclear power plants retired and other nuclear plants experienced slightly more maintenance-related outages.

We expect coal-fired generation to increase in the United States during 2021 as natural gas prices continue to rise and as coal becomes more economically competitive. Based on forecasts in our Short-Term Energy Outlook (STEO), we expect coal-fired electricity generation in all sectors in 2021 to increase 18% from 2020 levels before falling 2% in 2022. We expect U.S. renewable generation across all sectors to increase 7% in 2021 and 10% in 2022, and in 2021, non-fossil fuel sources accounted for about 40% of U.S. electricity. As a result, we forecast coal will be the second-most prevalent electricity source in 2021, and renewables will be the second-most prevalent source in 2022. We expect nuclear electric power to decline 2% in 2021 and 3% in 2022 as operators retire several generators.


Related News

Related News

Harbour Air's electric aircraft a high-flying example of research investment

Harbour Air Electric Aircraft Project advances zero-emission aviation with CleanBC Go Electric ARC funding, converting seaplanes to battery-electric power, cutting emissions, enabling commercial passenger service, and creating skilled clean-tech jobs through R&D and electrification.


Key Points

Harbour Air's project electrifies seaplanes with CleanBC ARC support to enable zero-emission flights and cut emissions.

✅ $1.6M CleanBC ARC funds seaplane electrification retrofit

✅ Target: passenger-ready, zero-emission commercial service

✅ Creates 21 full-time clean-tech jobs in British Columbia


B.C.’s Harbour Air Seaplanes is building on its work in clean technology to decarbonize aviation, part of an aviation revolution underway, and create new jobs with support from the CleanBC Go Electric Advanced Research and Commercialization (ARC) program.

”Harbour Air is decarbonizing aviation and elevating the company to new altitudes as a clean-technology leader in B.C.'s transportation sector,” said Bruce Ralston, Minister of Energy, Mines and Low Carbon Innovation. “With support from our CleanBC Go Electric ARC program, Harbour Air's project not only supports our emission-reduction goals, but also creates good-paying clean-tech jobs, exemplifying the opportunities in the low-carbon economy.”

Harbour Air is receiving almost $1.6 million from the CleanBC Go Electric ARC program for its aircraft electrification project. The funding supports Harbour Air’s conversion of an existing aircraft to be fully electric-powered and builds on its successful December 2019 flight of the world’s first all-electric commercial aircraft, and subsequent first point-to-point electric flight milestones.

That flight marked the start of the third era in aviation: the electric age. Harbour Air is working on a new design of the electric motor installation and battery systems to gain efficiencies that will allow carrying commercial passengers, as it eyes first electric passenger flights in 2023. Approximately 21 full-time jobs will be created and sustained by the project.

“CleanBC is helping accelerate world-leading clean technology and innovation at Harbour Air that supports good jobs for people in our communities,” said George Heyman, Minister of Environment and Climate Change Strategy. “Once proven, the technology supports a switch from fossil fuels to advanced electric technology, and will provide a clean transportation option, such as electric ferries, that reduces pollution and shows the way forward for others in the sector.”

Harbour Air is a leader in clean-technology adoption. The company has also purchased a fully electric, zero-emission passenger shuttle bus to pick up and drop off passengers between Harbour Air’s downtown Vancouver and Richmond locations, and the Vancouver International Airport, where new EV chargers support travellers.

“It is great to see the Province stepping up to support innovation,” said Greg McDougall, Harbour Air CEO and ePlane test pilot. “This type of funding confirms the importance of encouraging companies in all sectors to focus on what they can be doing to look at more sustainable practices. We will use these resources to continue to develop and lead the transportation industry around the world in all-electric aviation.”

In total, $8.18 million is being distributed to 18 projects from the second round of CleanBC Go Electric ARC program funding. Recipients include Damon Motors and IRDI System, both based on the Lower Mainland. The 15 other successful projects will be announced this year.

The CleanBC Go Electric ARC program supports the electric vehicle (EV) sector in B.C., which leads the country in going electric, by providing reliable and targeted support for research and development, commercialization and demonstration of B.C.-based EV technologies, services and products.

“This project is a great example of the type of leading-edge innovation and tech advancements happening in our province,” said Brenda Bailey, Parliamentary Secretary for Technology and Innovation. “By further supporting the development of the first all-electric commercial aircraft, we are solidifying our position as world leaders in innovation and using technology to change what is possible.”

The CleanBC Roadmap to 2030 is B.C.’s plan to expand and accelerate climate action, including a major hydrogen project, building on the province’s natural advantages – abundant, clean electricity, high-value natural resources and a highly skilled workforce. It sets a path for increased collaboration to build a British Columbia that works for everyone.


Related News

View more

France Hits Record: 20% Of Market Buys Electric Cars

France Plug-In Electric Car Sales September 2023 show rapid EV adoption: 45,872 plug-ins, 30% market share, BEV 19.6%, PHEV 10.2%, with Tesla Model Y leading registrations amid sustained year-over-year growth.


Key Points

France registered 45,872 plug-ins in September 2023, a 30% share, with BEVs at 19.6% and PHEVs at 10.2%.

✅ Tesla Model Y led BEVs with 5,035 registrations in September

✅ YTD plug-in share 25%; BEV 15.9%, PHEV 9.1% across passenger cars

✅ Total market up 9% YoY to 153,916; plug-ins up 35% YoY


New passenger car registrations in France increased in September by nine percent year-over-year to 153,916, mirroring global EV market growth trends, taking the year-to-date total to 1,286,247 (up 16 percent year-over-year).

The market has been expanding every month this year (recovering slightly from the 2020-2022 collapse and the period when EU EV share grew during lockdowns across the bloc) and also is becoming more and more electrifying thanks to increasing plug-in electric car sales.

According to L’Avere-France, last month 45,872 new passenger plug-in electric cars were registered in France (35 percent more than a year ago), which represented almost 30 percent of the market, aligning with the view that the age of electric cars is arriving ahead of schedule. That's a new record share for rechargeable cars and a noticeable jump compared to just over 24 percent a year ago.

What's even more impressive is that passenger all-electric car registrations increased to over 30,000 (up 34 percent year-over-year), taking a record share of 19.6 percent of the market. That's basically one in five new cars sold, and in the U.S., plug-ins logged 19 billion electric miles in 2021 as a benchmark.

Plug-in hybrids are also growing (up 35% year-over-year), and with 15,699 units sold, accounted for 10.2 percent of the market (a near record value).


Plug-in car sales in France – September 2023

So far this year, more than 341,000 new plug-in electric vehicles have been registered in France, including over 321,000 passenger plug-in cars (25 percent of the market), while in the U.S., EV sales are soaring into 2024 as well.

Plug-in car registrations year-to-date (YOY change):

  • Passenger BEVs: 204,616 (up 45%) and 15.9% market share
  • Passenger PHEVs: 116,446 (up 31%) and 9.1% market share
  • Total passenger plug-ins: 321,062 (up 40%) and 25% market share
  • Light commercial BEVs: 20,292 (up 111%)
  • Light commercial PHEVs: 281 (down 38%)
  • Total plug-ins: 341,635 (up 43%)

For reference, in 2022, more than 346,000 new plug-in electric vehicles were registered in France (including almost 330,000 passenger cars, which was 21.5 percent of the market).

We can already tell that the year 2023 will be very positive for electrification in France, with a potential to reach 450,000 units or so, though new EV incentive rules could reshape the competitive landscape.


Models
In terms of individual models, the Tesla Model Y again was the most registered BEV with 5,035 new registrations in September. This spectacular result enabled the Model Y to become the fifth best-selling model in the country last month (Tesla, as a brand, was seventh).

The other best-selling models are usually small city cars - Peugeot e-208 (3,924), Dacia Spring (2,514), Fiat 500 electric (2,296), and MG4 (1,945), amid measures discouraging Chinese EVs in France. Meanwhile, the best-selling electric Renault - the Megane-e - was outside the top five BEVs, which reveals to us how much has changed since the Renault Zoe times.

After the first nine months of the year, the top three BEVs are the Tesla Model Y (27,458), Dacia Spring (21,103), and Peugeot e-208 (19,074), slightly ahead of the Fiat 500 electric (17,441).


Related News

View more

Elon Musk says cheaper, more powerful electric vehicle batteries are 3 years off

Tesla Battery Day Innovations detail larger cylindrical EV cells with higher energy density, greater power, longer range, cobalt-free chemistry, automated manufacturing, battery recycling, and lower cost per kWh to enable an affordable electric car.


Key Points

Tesla Battery Day innovations are new EV cells and methods to cut costs, extend range, and scale production.

✅ Larger cylindrical cells: 5x energy, 6x power, 16% more range

✅ Automation and recycling to cut battery cost per kWh

✅ Near-zero cobalt chemistry, in-house cell factories worldwide


Elon Musk described a new generation of electric vehicle batteries that will be more powerful, longer lasting, and half as expensive as the company’s current cells at Tesla’s “Battery Day”.

Tesla’s new larger cylindrical cells will provide five times more energy, six times more power and 16% greater driving range, Musk said, adding that full production is about three years away.

“We do not have an affordable car. That’s something we will have in the future. But we’ve got to get the cost of batteries down,” Musk said.

To help reduce cost, Musk said Tesla planned to recycle battery cells at its Nevada “gigafactory,” while reducing cobalt – one of the most expensive battery materials – to virtually zero. It also plans to manufacture its own battery cells at several highly automated factories around the world.

The automaker plans to produce the new cells via a highly automated, continuous-motion assembly process, according to Drew Baglino, Tesla senior vice-president of powertrain and energy engineering, a contrast with GM and Ford battery strategies in the broader market today.

Speaking at the event, during which Musk outlined plans to cut costs and reiterated a huge future for Tesla's energy business during the presentation, the CEO acknowledged that Tesla does not have its new battery design and manufacturing process fully complete.

The automaker’s shares slipped as Musk forecast the change could take three years. Tesla has frequently missed production targets.

Tesla expects to eventually be able to build as many as 20m electric vehicles a year, aligning with within-a-decade EV adoption outlooks cited by analysts. This year, the entire auto industry expects to deliver 80m cars globally.

At the opening of the event, which drew over 270,000 online viewers, Musk walked on stage as about 240 shareholders – each sitting in a Tesla Model 3 in the company parking lot – honked their car horns in approval.

As automakers shift from horsepower to kilowatts to comply with stricter environmental regulations amid an age of electric cars that appears ahead of schedule, investors are looking for evidence that Tesla can increase its lead in electrification technology over legacy automakers who generate most of their sales and profits from combustion-engine vehicles.

While average electric vehicle prices have decreased in recent years thanks to changes in battery composition and evidence that they are better for the planet and household budgets, they are still more expensive than conventional cars, with the battery estimated to make up a quarter to a third of an electric vehicle’s cost.

Some researchers estimate that price parity, or the point at which electric vehicles are equal in value to internal combustion cars, is reached when battery packs cost $100 per kilowatt hour (kWh), a potential inflection point for mass adoption.

Tesla’s battery packs cost $156 per kWh in 2019, according to electric vehicle consulting firm Cairn Energy Research Advisors, with some studies noting that EVs save money over time for consumers, which would put the cost of a 90-kWh pack at around $14,000.

Tesla is also building its own cell manufacturing facility at its new factory in Germany in addition to the new plant in Fremont.


Related News

View more

"Remarkable" New Contract Award Adds 10 GW of Renewables to UK Grid

UK Renewable Energy Auction secures 10 GW for the grid at record-low costs, led by offshore wind, floating wind, solar, and onshore wind, with inflation-indexed CfDs delivering £37/MWh strike prices and enhanced energy security.


Key Points

Government CfDs add 10 GW of low-cost renewables to the UK grid via offshore wind, floating wind, and solar.

✅ 10 GW capacity: 7 GW offshore wind, 2.2 GW solar, 0.9 GW onshore wind

✅ Record-low £37/MWh offshore; floating wind at £87/MWh CfD strikes

✅ 15-year indexed contracts cut exposure to volatile gas prices


The United Kingdom will add 10 gigawatts (GW) of renewable energy capacity to its power grid at one-quarter the cost of fossil gas after concluding its biggest-ever renewable energy auction for new renewable supplies.

The “remarkable new UK renewable auction” will meet one-eighth of the country’s current electricity demand at record low prices of just £37 per megawatt-hour for offshore wind and £87 for floating offshore systems (a dynamic echoed as wind power gains in Canada across other markets), tweeted Carbon Brief Deputy Editor Simon Evans.

“The government is increasing its reliance on a local supply of renewables amid soaring UK power prices driven by a surge in the cost of natural gas following Russia’s invasion of Ukraine,” Bloomberg Green reports. Offshore wind energy “will add about seven gigawatts of clean power capacity to the nation’s fleet from 2026, bringing Britain closer to its target of installing 50 gigawatts by the end of the decade.”

The awards also include 2.2 gigawatts (that’s 2.2 billion watts) of solar and 900 megawatts of onshore wind, even as the UK faces a renewables backlog on some projects, Bloomberg says.

“Eye-watering gas prices are hitting consumers across Europe,” said UK Business and Energy Secretary Kwasi Kwarteng. “The more cheap, clean power we generate within our own borders, the better protected we will be from volatile gas prices that are pushing up bills.”

Citing government figures, Bloomberg says wind generation costs came in 5.8% lower than the previous auction in 2019, reflecting momentum in a sector set to become a trillion-dollar business this decade. Some of the winning bidders included Ørsted, Iberdrola’s Scottish Power unit, Vattenfall, and a consortium of AB Ignitis Grupe, EDP Renovaveis, and Engie.

Offshore wind power costs have fallen dramatically in recent years as the UK supported the industry to scale up and industrialize production of larger, more efficient turbines,” the news story states. Now, “the decline in price developers are willing to accept comes even after the cost of wind turbines rose in recent months as prices increased for key metals like steel and supply chain disruptions created expensive delays.”

The 15-year, fixed-price contracts will be adjusted for inflation when the turbines are ready to start delivering electricity, offering lessons for the U.S. wind sector on contract design.


Related News

View more

California Takes the Lead in Electric Vehicle and Charging Station Adoption

California EV Adoption leads the U.S., with 37% of registered electric vehicles and 27% of charging locations, spanning Level 1, Level 2, and DC Fast stations, aligned with OCPI and boosted by CALeVIP funding.


Key Points

California EV adoption reflects the state's leading EV registrations and growth in private charging infrastructure.

✅ 37% of U.S. EVs, 27% of charging locations in 2022

✅ CALeVIP funding boosts public charging deployment

✅ OCPI-aligned data; EVs per charger rose to 75 in CA


California has consistently been at the forefront of electric vehicle (EV) adoption, with EV sales topping 20% in California underscoring this trend, and the proliferation of EV charging stations in the United States, maintaining this position since 2016. According to recent estimates from our State Energy Data System (SEDS), California accounts for 37% of registered light-duty EVs in the U.S. and 27% of EV charging locations as of the end of 2022.

The vehicle stock data encompass all registered on-road, light-duty vehicles and exclude any previous vehicle sales no longer in operation. The data on EV charging locations include both private and public access stations for Legacy, Level 1, Level 2, and DC Fast charging ports, excluding EV chargers in single-family residences. There is a data series break between 2020 and 2021, when the U.S. Department of Energy updated its data to align with the Open Charge Point Interface (OCPI) international standard, reflecting changes in the U.S. charging infrastructure landscape.

In 2022, the number of registered EVs in the United States, with U.S. EV sales soaring into 2024 nationwide, surged to six times its 2016 figure, growing from 511,600 to 3.1 million, while the number of U.S. charging locations nearly tripled, rising from 19,178 to 55,015. Over the same period, California saw its registered EVs more than quadruple, jumping from 247,400 to 1.1 million, and its charging locations tripled, increasing from 5,486 to 14,822.

California's share of U.S. EV registrations has slightly decreased in recent years as EV adoption has spread across the country, with Arizona EV ownership relatively high as well. In 2016, California accounted for approximately 48% of light-duty EVs in the United States, which was approximately 12 times more than the state with the second-highest number of EVs, Georgia. By 2022, California's share had decreased to around 37%, which was still approximately six times more than the state with the second-most EVs, Florida.

On the other hand, California's share of U.S. EV charging locations has risen slightly in recent years, as charging networks compete amid federal electrification efforts and partly due to the California Electric Vehicle Infrastructure Project (CALeVIP), which provides funding for the installation of publicly available EV charging stations. In 2016, approximately 25% of U.S. EV charging locations were in California, over four times as many as the state with the second-highest number, Texas. In 2022, California maintained its position with over four times as many EV charging locations as the state with the second-most, New York.

The growth in the number of registered EVs has outpaced the growth of EV charging locations in the United States, and in 2021 plug-in vehicles traveled 19 billion electric miles nationwide, underscoring utilization. In 2016, there were approximately 27 EVs per charging location on average in the country. Alaska had the highest ratio, with 67 EVs per charging location, followed by California with 52 vehicles per location.

In 2022, the average ratio was 55 EVs per charging location in the United States, raising questions about whether the grid can power an ongoing American EV boom ahead. New Jersey had the highest ratio, with 100 EVs per charging location, followed by California with 75 EVs per location.


Related News

View more

Low-emissions sources are set to cover almost all the growth in global electricity demand in the next three years

IEA Electricity Market Outlook 2023-2025 projects faster demand growth as renewables and nuclear dominate supply, stabilizing power-sector carbon emissions, with Asia leading expansion despite energy crisis shocks and weather-driven volatility.


Key Points

IEA forecast for 2023-2025 electricity demand: renewables and nuclear meet growth as power-sector emissions hold steady.

✅ Asia drives >70% of demand growth

✅ Renewables and nuclear meet most new supply

✅ CO2 intensity declines; grid flexibility vital


The world’s electricity demand growth slowed only slightly in 2022, despite headwinds from the energy crisis, and is expected to accelerate in the years ahead

Renewables are set to dominate the growth of the world’s electricity supply over the next three years as, renewables eclipse coal in global generation, together with nuclear power they meet the vast majority of the increase in global demand through to 2025, making significant rises in the power sector’s carbon emissions unlikely, according to a new IEA report.

After slowing slightly last year to 2% amid the turmoil of the global energy crisis and exceptional weather conditions in some regions, the growth in world electricity demand is expected to accelerate to an average of 3% over the next three years, the IEA’s Electricity Market Report 2023 finds. Emerging and developing economies in Asia are the driving forces behind this faster pace, which is a step up from average growth of 2.4% during the years before the pandemic and above pre-pandemic levels globally.

More than 70% of the increase in global electricity demand over the next three years is expected to come from China, India and Southeast Asia, as Asia’s power use nears half of the world by mid-decade, although considerable uncertainties remain over trends in China as its economy emerges from strict Covid restrictions. China’s share of global electricity consumption is currently forecast to rise to a new record of one-third by 2025, up from one-quarter in 2015. At the same time, advanced economies are seeking to expand electricity use to displace fossil fuels in sectors such as transport, heating and industry.

“The world’s growing demand for electricity is set to accelerate, adding more than double Japan’s current electricity consumption over the next three years,” said IEA Executive Director Fatih Birol. “The good news is that renewables and nuclear power are growing quickly enough to meet almost all this additional appetite, suggesting we are close to a tipping point for power sector emissions. Governments now need to enable low-emissions sources to grow even faster and drive down emissions so that the world can ensure secure electricity supplies while reaching climate goals.”

While natural gas-fired power generation in the European Union is forecast to fall in the coming years, as wind and solar outpaced gas in 2022, based on current trends, significant growth in the Middle East is set to partly offset this decrease. Sharp spikes in natural gas prices amid the energy crisis have in turn fuelled soaring electricity prices in some markets, particularly in Europe, prompting debate in policy circles over reforms to power market design.

Meanwhile, expected declines in coal-fired generation in Europe and the Americas are likely to be matched by a rise in the Asia-Pacific region, despite increases in nuclear power deployment and restarts of plants in some countries such as Japan. This means that after reaching an all-time high in 2022, carbon dioxide (CO2) emissions from global power generation are set to remain around the same level through 2025.

The strong growth of renewables means their share of the global power generation mix is forecast to rise from 29% in 2022 to 35% in 2025, with the shares of coal- and gas-fired generation falling. As a result, the CO2 intensity of global power generation will continue to decrease in the coming years. Europe bucked this global trend last year, however. The CO2 intensity of Europe’s power generation increased as a result of higher use of coal and gas amid steep drops in output from both hydropower, due to drought, and nuclear power, due to plant closures and maintenance. This setback will be temporary, though, as Europe’s power generation emissions are expected to decrease on average by about 10% a year through 2025.

Electricity demand trends varied widely by region in 2022. India’s electricity consumption rose strongly, while China’s growth was more subdued due to its zero-Covid policy weighing heavily on economic activity. The United States recorded a robust increase in demand, driven by economic activity and higher residential use amid hotter summer weather and a colder-than-normal winter, even as electricity sales projections continue to decline according to some outlooks.

Demand in the European Union contracted due to unusually mild winter weather and a decline in electricity consumption in the industrial sector, which significantly scaled back production because of high energy prices and supply disruptions caused by Russia’s invasion of Ukraine. The 3.5% decrease in EU demand was its second largest percentage decline since the global financial crisis in 2009, with the largest being the exceptional contraction due to the COVID-19 shock in 2020.

The new IEA report notes that electricity demand and supply worldwide are becoming increasingly weather dependent, with extreme conditions a recurring theme in 2022. In addition to the drought in Europe, there were heatwaves in India, resulting in the country’s highest ever peak in power demand. Similarly, central and eastern regions of China were hit by heatwaves and drought, which caused demand for air conditioning to surge amid reduced hydropower generation in Sichuan province. The United States also saw severe winter storms in December, triggering massive power outages.

These highlight the need for faster decarbonisation and accelerated deployment of clean energy technologies, the report says. At the same time, as the clean energy transition gathers pace, the impact of weather events on electricity demand will intensify due to the increased electrification of heating, while the share of weather-dependent renewables will continue to grow in the generation mix. In such a world, increasing the flexibility of power systems, which are under growing strain across grids and markets, while ensuring security of supply and resilience of networks will be crucial.


Related News

View more

Sign Up for Electricity Forum’s Newsletter

Stay informed with our FREE Newsletter — get the latest news, breakthrough technologies, and expert insights, delivered straight to your inbox.

Electricity Today T&D Magazine Subscribe for FREE

Stay informed with the latest T&D policies and technologies.
  • Timely insights from industry experts
  • Practical solutions T&D engineers
  • Free access to every issue

Download the 2025 Electrical Training Catalog

Explore 50+ live, expert-led electrical training courses –

  • Interactive
  • Flexible
  • CEU-cerified