Wind power grows despite Covid-19


wind power

Electrical Testing & Commissioning of Power Systems

Our customized live online or in‑person group training can be delivered to your staff at your location.

  • Live Online
  • 12 hours Instructor-led
  • Group Training Available
Regular Price:
$599
Coupon Price:
$499
Reserve Your Seat Today

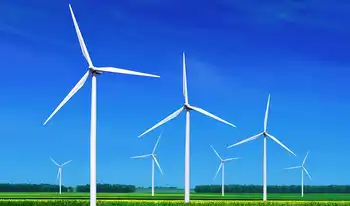
Global Wind Power Growth will hit record installations, buoying renewable energy, offshore wind, onshore capacity, and economic recovery, as GWEC forecasts resilient post-Covid markets led by China and the US with strong investment and jobs.


Key Points

Global Wind Power Growth is the forecast rise in capacity driving renewable energy, jobs, and lower emissions.

✅ 71.3 GW installed in 2020; only 6% below pre-Covid forecast

✅ 348 GW added by 2024; nearly 1,000 GW total capacity

✅ Offshore wind resilient; 6.5 GW in 2020, China-led


Wind power will continue to show record growth, as renewables set to shatter records over the next five years despite the impacts of the Covid-19 crisis, and will make a crucial contribution to economic recovery... According to the latest market outlook by GWEC Market Intelligence, 71.3GW of wind power capacity is expected to be installed in 2020, which is only a 6% reduction from pre-Covid forecasts. This is a significant increase from original predictions that expected wind power installations to be reduced by up to 20 per cent due to the pandemic, demonstrating the resilience of the wind power industry across the globe.

From 2020 to 2024, the cumulative global wind energy market will grow at a compound annual rate of 8.5% and installing 348GW of new capacity, bringing total global wind power capacity to nearly 1,000GW by the end of 2024, which is an increase of 54% for total wind power installations compared to 2019. While some project completion dates have been pushed into 2021 due to the pandemic, next year is expected to be a record year for the wind industry with 78GW of new wind capacity forecasted to be installed in 2021. Over 50% of the onshore wind capacity added between 2020 to 2024 will be installed in China and the US, where U.S. solar and wind growth is supported by favourable government plans, led by installation rushes to meet subsidy deadlines.

The offshore wind sector has been largely shielded from the impacts of the Covid-19 crisis, GWEC Market Intelligence has indeed increased its forecast for offshore wind by 5 per cent to 6.5 GW of new installations in 2020, another record year for the industry, as offshore wind's $1 trillion outlook comes into focus, led by the installation rush in China. Up until 2024, over 48GW of new offshore wind capacity is expected to be installed, with another 157GW forecasted to be installed from 2025 to 2030 across key markets such as offshore wind in the UK and Asia.

“While the Covid-19 crisis has impacted every industry across the world, wind power has continued to grow and thrive. This is no surprise given the cost competitiveness of wind energy and the need to rapidly reproduce carbon emissions. Fossil fuel industries face market fluctuations and require bailouts to stay afloat, while wind turbines across the world have continued to spin and provide affordable, clean energy to citizens everywhere," says Ben Backwell, CEO of GWEC.

“Thanks to the localised nature of wind power supply chains and project construction, the sector has continued to generate billions in local investment and thousands of jobs to support economic recovery. However, in order to tap into the full potential of wind power to drive a green recovery, governments must ensure that energy markets and policies allow a continued ramp up in investment in wind and other renewables, and avoid unintended effects such as the Solar ITC extension impact on the US wind market, while disincentivising investment in expensive and declining fossil fuel industries," he says.

Biggest markets

China and the US will continue to be the two main markets driving growth over the next few years, with U.S. wind power surges underscoring the momentum. "We have increased or maintained our forecasts for onshore wind in regions such as Latin America, North America, Africa, and the Middle East over the next five years, with only minor decreases in Asia Pacific and Europe. However, these reductions are not necessarily a direct impact of Covid-19, but also a symptom of pre-existing regulatory issues, such as protracted permitting procedures, which are slowing down installations. In particular, offshore wind has demonstrated its resilience by exceeding our pre-pandemic forecasts for 2020, and will be an important source of growth in the decade ahead," Feng Zhao, strategy director at GWEC.

“We have seen a series of carbon neutrality commitments by major economies such as China, Japan and South Korea over the past few weeks. Since wind power is a key technology for decarbonisation, building on the evolution in 2016, these targets will increase the forecast for wind power over the next few decades. However, the right enabling regulatory and policy frameworks must be in place to accelerate renewable energy growth to meet these targets. China, the world’s largest wind power market and largest carbon emitter, has pledged to go carbon-neutral by 2060. To have a chance at achieving this target, we need to be installing 50GW of wind power per year in China from now until 2025, and then 60GW from 2026 onwards. It is crucial that governments firm up carbon neutrality targets with tangible actions to drive wind and other renewable energy growth at the levels needed to achieve these aims”, he says.

Related News

25.5% Of US Electricity Coming From Renewable Energy

US Renewable Energy Growth drives the US electricity mix as wind, solar, and hydropower rise while coal, natural gas, and nuclear decline, boosting market share month over month and year over year across the grid.


Key Points

US Renewable Energy Growth tracks rising wind, solar, and hydro shares in the mix as coal, gas, and nuclear decline.

✅ Wind and solar surpass nuclear in April share

✅ Renewables reach 29.3% of US electricity in April

✅ Coal and natural gas shares trend lower since 2020


Electricity generated by renewable energy sources continues to grow month over month and year over year in the United States. In April 2022, the share of US electricity coming from renewable energy was up to 29.3%, surpassing a record April level reported previously in national data. That was up from 24.8% in April 2020 and 25.7% in April 2021.

Looking at the first four months of the year, renewables provided 25.5% of US electricity, and were the second-most U.S. source in 2020 as well, while the figure for January–April 2020 was 21.7% and the figure for January–April 2021 was 22.5%.

Coal power (20.2% of US electricity) was down year over year in this time period (from 22% in January–April 2021), even as renewables surpassed coal in 2022 nationwide, but is admittedly still a bit higher than it was in January–April 2020 (16.8%).

Electricity from natural gas is also down year over year, but only very slightly (34.7% for both years). Though, it has dropped significantly since January–April 2020 (39.6%).

Electricity from nuclear power continued to take a steady, step-by-step tumble.

Wind & Solar Power Growth Strong
As reported earlier, April was the first month that wind and solar power provided more electricity than nuclear across the United States. Wind and solar power provided 21% of US electricity, while nuclear power provided 17.8% of US electricity (coal, incidentally, also provided 17.8% of US electricity, but wind and solar had provided more electricity than coal in some previous months as well).

Wind and solar power’s combined market share for the first four months of the year was up from just 14.6% in 2020 and 18.4% in 2021.

Looking at their growth year over year, you can see strong and continuous expansion of solar-provided electricity and wind-provided electricity, amid favorable government plans that have supported deployment.

Solar grew from 2.9% in January–April 2020 to 3.6%in January–April 2021 to, eventually, 4.4% in January–April 2022, with solar's 2022 share rising to 4.7% for the full year. Wind rose from 9.2% to 10.3% to 12.2%.

Together, wind and solar were up from 12.1% in January–April 2020 to 13.9% in January–April 2021, reflecting a surge in wind power within the U.S. electricity mix over this period, to 16.7% January–April 2022.

Hydropower (6.5%) is holding approximately the same position as the same period in 2021 (6.5%), but it is down a significant chunk from April 2020 (8.2%).


Related News

View more

Texas battery rush: Oil state's power woes fuel energy storage boom

Texas Battery Storage Investment Boom draws BlackRock, SK, and UBS, leveraging ERCOT price volatility, renewable energy growth, and utility-scale energy storage arbitrage to enhance grid reliability, resilience, and double-digit returns across high-demand nodes.


Key Points

Texas sees a rush into battery storage, using ERCOT price spreads to bolster grid reliability and earn about 20% returns.

✅ Investors exploit price volatility, peak-demand spreads.

✅ Utility-scale storage enhances ERCOT reliability.

✅ Top players: BlackRock, SK E&S, UBS; 700 MW deals.


BlackRock, Korea's SK, Switzerland's UBS and other companies are chasing an investment boom in battery storage plants in Texas, lured by the prospect of earning double-digit returns from the power grid problems plaguing the state, according to project owners, developers and suppliers.

Projects coming online are generating returns of around 20%, compared with single digit returns for solar and wind projects, according to Rhett Bennett, CEO of Black Mountain Energy Storage, one of the top developers in the state.

"Resolving grid issues with utility-scale energy storage is probably the hottest thing out there,” he said.

The rapid expansion of battery storage could help, through efforts like a virtual power plant initiative in Texas, prevent a repeat of the February 2021 ice storm and grid collapse which killed 246 people and left millions of Texans without power for days.

The battery rush also puts the Republican-controlled state at the forefront of President Joe Biden's push to expand renewable energy use.

Power prices in Texas can swing from highs of about $90 per megawatt hour (MWh) on a normal summer day to nearly $3,000 per MWh when demand surges on a day with less wind power, a dynamic tied to wind curtailment on the Texas grid according to a simulation by the federal government's U.S. Energy Information Administration.

That volatility, a product of demand and higher reliance on intermittent wind and solar energy, has fueled a rush to install battery plants, aided by falling battery costs, that store electricity when it is cheap and abundant and sell when supplies tighten and prices soar.

Texas last year accounted for 31% of new U.S. grid-scale energy storage, with much of it pairing storage with solar, according to energy research firm Wood Mackenzie, second only to California which has had a state mandate for battery development for a decade.

And Texas is expected to account for nearly a quarter of the U.S. grid-scale storage market over the next five years, a trajectory consistent with record U.S. solar-plus-storage growth noted by analysts, according to Wood Mackenzie projections shared with Reuters.

Developers and energy traders said locations offering the highest returns -- in strapped areas of the grid -- will become increasingly scarce as more storage comes online and, as diversifying resources for better projects suggests, electricity prices stabilize.

Texas lawmakers this week voted to provide new subsidies for natural gas power plants in a bid to shore up reliability. But the legislation also contains provisions that industry groups said could encourage investment in battery storage by supporting 'unlayering' peak demand approaches.

Amid the battery rush, BlackRock acquired developer Jupiter Power from private equity firm EnCap Investments late last year. Korea's SK E&S acquired Key Capture Energy from Vision Ridge Partners in 2021 and UBS bought five Texas projects from Black Mountain last year for a combined 700 megawatts (MW) of energy storage. None of the sales' prices were disclosed.

SK E&S said its acquisition of Key Capture was part of a strategy to invest in U.S. grid resiliency.

"SK E&S views energy storage solutions in Texas and across the U.S. as a core technology that supports a new energy infrastructure system to ensure American homes and businesses have affordable power," the company said in a statement.


Related News

View more

Olympus to Use 100% Renewable Electricity

Olympus Renewable Energy Initiative reduces CO2 emissions by sourcing 100% clean electricity at major Japan R&D and manufacturing sites, accelerating ESG goals toward net zero, decarbonization, and TCFD-aligned sustainability across global operations.


Key Points

Olympus's program to source renewable power, cut CO2, and reach net-zero site operations by 2030.

✅ 100% renewable electricity at major Japan R&D and manufacturing sites

✅ Expected 70% renewable share of electricity in FY2023

✅ Net-zero site operations targeted company-wide by 2030


Olympus Corporation announces that from April 2022, the company has begun to exclusively source 100% of the electricity used at its major R&D and manufacturing sites in Japan from renewable sources. As a result, CO2 emissions from Olympus Group facilities in Japan will be reduced by approximately 40,000 tons per year. The percentage of the Olympus Group's total electricity use in fiscal 2023 (ending March 2023) from renewable energy sources, including green hydrogen applications, is expected to substantially increase from approximately 14% in the previous fiscal year to approximately 70%.

Olympus has set a goal of achieving net zero CO2 emissions from its site operations by 2030, as part of its commitment to achieving environmentally responsible business growth and creating a sustainable society, aligning with Europe's push for electrification to address climate goals. This is a key goal in line with Olympus Corporation's ESG materiality targets focused on the theme of a "carbon neutral society and circular economy."

The company has already introduced a wide range of initiatives to reduce CO2 emissions. This includes the use of 100% renewable energy at some manufacturing sites in Europe, despite electricity price volatility in the region, and the United States, the installation of solar power generation facilities at some manufacturing sites in Japan, and support of the recommendations made by the Task Force on Climate-related Financial Disclosures (TCFD), alongside developments such as Honda's Ontario battery investment that signal rapid electrification.

To achieve its carbon neutral goal, Olympus will continue to optimize manufacturing processes and promote energy-saving measures, and notes that policy momentum from Canada's EV sales regulations and EPA emissions limits is accelerating complementary electrification trends, is committed to further accelerate the shift to renewable energy sources across the company, thereby contributing to the decarbonization of society on a global level, as reflected in regional labor markets like Ontario's EV jobs boom that accompany the transition.


Related News

View more

Rhode Island issues its plan to achieve 100% renewable electricity by 2030

Rhode Island 100% Renewable Electricity by 2030 outlines pathways via offshore wind, retail solar, RECs, and policy reforms, balancing decarbonization, grid reliability, economics, and equity to close a 4,600 GWh supply gap affordably.


Key Points

A statewide plan to meet all electricity demand with renewables by 2030 via offshore wind, solar, and REC policies.

✅ Up to 600 MW offshore wind could add 2,700 GWh annually

✅ Retail solar programs may supply around 1,500 GWh per year

✅ Amend RES to retain RECs and align supply with real-time demand


A year ago, Executive Order 20-01 cemented in a place Rhode Island’s goal to meet 100% of the state’s electricity demand with renewable energy by 2030, aligning with the road to 100% renewables seen across states. The Rhode Island Office of Energy Resources (OER) worked through the year on an economic and energy market analysis, and developed policy and programmatic pathways to meet the goal.

In the most recent development, OER and The Brattle Group co-authored a report detailing how this goal will be achieved, The Road to 100% Renewable Electricity – The Pathways to 100%.

The report includes economic analysis of the key factors that will guide Rhode Island as it accelerates adoption of carbon-free renewable resources, complementing efforts that are tracking progress on 100% clean energy targets nationwide.

The pathway rests on three principles: decarbonization, economics and policy implementation, goals echoed in Maine’s 100% renewable electricity target planning.

The report says the state needs to address the gap between projected electricity demand in 2030 and projected renewable generation capacity. The report predicts a need for 4,600 GWh of additional renewable energy to close the gap. Deploying that much capacity represents a 150% increase in the amount of renewable energy the state has procured to date. The final figure could as much as 600-700 GWh higher or lower.

Addressing the gap
The state is making progress to close the gap.

Rhode Island recently announced plans to solicit proposals for up to 600 MW of additional offshore wind resources. A draft request for proposals (RFP) is expected to be filed for regulatory review in the coming months, aligning with forecasts that one-fourth of U.S. electricity will soon be supplied by renewables as markets mature. Assuming the procurement is authorized and the full 600 MW is acquired, new offshore wind would add about 2,700 GWh per year, or about 35% of 2030 electricity demand.

Beyond this offshore wind procurement, development of retail solar through existing programs could add another 1,500 GWh per year. That leaves a smaller–though still sizable–gap of around 400 GWh per year of renewable electricity.

All this capacity will come with a hefty price. The report finds that rate impacts would likely boost e a typical 2030 monthly residential bill by about $11 to $14 with utility-scale renewables, or by as much as $30 if the entire gap were to be filled with retail solar.

The upside is that if the renewable resources are developed in-state, the local economic activity would boost Rhode Island’s gross domestic product and local jobs, especially when compared to procuring out-of-state resources or buying Renewable Energy Credits (RECs), and comes as U.S. renewable electricity surpassed coal in 2022 across the national grid.

Policy recommendations
One policy item that has to be addressed is the state’s Renewable Energy Standard (RES), which currently calls for meeting 38.5% of electricity deliveries with renewables by 2035, even as the federal 2035 clean electricity goal sets a broader benchmark for decarbonization. For example, RES compliance at present does not require the physical procurement of power produced by renewable energy facilities. Instead, electricity providers meet their requirements by purchasing RECs.

The report recommends amending the state’s RES to seek methods by which Rhode Island can retain all of the RECs procured through existing policy and program channels, along with RECs resulting from ratepayer investment in net metered projects, while Nevada’s 50% by 2030 RPS provides a useful interim comparison.

The report also recognizes that the RES alone is unlikely to drive sufficient investment renewable generation and should be paired with programs and policies to ensure sufficient renewable generation to meet the 100% goal. The state also needs to address the RECs created by behind-the-meter systems that add mechanisms to better match the timing of renewable energy generation with real-time demand. The policy would have the 100% RES remain in effect beyond 2030 and also match shifts in energy demand, particularly as other parts of the economy electrify.

Fostering equity
The state also is putting a high priority on making sure the transition to renewables is an equitable one.

The report recommends partnering with and listening to frontline communities about their needs and goals in the clean energy transition. This will include providing traditionally underserved communities with expert consultation to help guide decision making. The report also recommends holding listening sessions to increase accessibility to and understanding of energy system basics.


Related News

View more

Netherlands' Renewables Drive Putting Pressure On Grid

The Netherlands grid crisis exposes how rapid renewable energy growth is straining transmission capacity. Solar, wind, and electric vehicle demand are overloading networks, forcing officials to urge reduced peak-time power use and accelerate national grid modernization plans.


Main Points

The Netherlands grid crisis refers to national electricity congestion caused by surging renewable energy generation and rising consumer demand.

✅ Grid congestion from rapid solar and wind expansion

✅ Strained transmission and distribution capacity

✅ National investment in smart grid upgrades


The Dutch government is urging households to reduce electricity consumption between 16:00 and 21:00 — a signal that the country’s once-stable power grid is under serious stress. The call comes amid an accelerating shift to wind and solar power that is overwhelming transmission infrastructure and creating “grid congestion” across regions, as seen in Nordic grid constraints this year.

In a government television campaign, a narrator warns: “When everyone uses electricity at the same time, our power grid can become overloaded. That could lead to failures — so please try to use less electricity between 4 pm and 9 pm.” The plea reflects a system where supply occasionally outpaces the grid’s ability to distribute it, with some regions abroad issuing summer blackout warnings already.

According to Dutch energy firm Eneco’s CEO, Kys-Jan Lamo, the root of the problem lies in the mismatch between modern renewable generation and a grid built for centralized fossil fuel plants. He notes that 70% of Eneco’s output already comes from solar and wind, and this “grid congestion is like traffic on the power lines.” Lamo explains:

“The grid congestion is caused by too much demand in some areas of the network, or by too much supply being pushed into the grid beyond what the network can carry.”

He adds that many of the transmission lines in residential areas are narrow — a legacy of when fewer and larger power plants fed electricity through major feeder lines, underscoring grid vulnerabilities seen elsewhere today. Under the new model, renewable generation occurs everywhere: “This means that electricity is now fed into the grid even in peripheral areas with relatively fine lines — and those lines cannot always cope.”

Experts warn that resolving these issues will demand years of planning and immense investment in smarter grid infrastructure over the coming years. Damien Ernst, an electrical engineering professor at Liège University and respected voice on European grids, states that the Netherlands is experiencing a “grid crisis” brought on by “insufficient investment in distribution and transmission networks.” He emphasizes that the speed of renewable deployment has outpaced the grid’s capacity to absorb it.

Eneco operates a “virtual power plant” control system — described by Lamo as “the brain we run” — that dynamically balances supply and demand. During periods of oversupply, the system can curtail wind turbines or shut down solar panels. Conversely, during peak demand, the system can throttle back electricity provision to participating customers in exchange for lower tariffs. However, these techniques only mitigate strain — they cannot replace the need for physical upgrades or bolster resilience to extreme weather outages alone.

The bottleneck has begun limiting new connections: “Consumers often want to install heat pumps or charge electric vehicles, but they increasingly find it difficult to get the necessary network capacity,” Lamo warns. Businesses too are struggling. “Companies often want to expand operations, but cannot get additional capacity from grid operators. Even new housing developments are affected, since there’s insufficient infrastructure to connect whole communities.”

Currently, thousands of businesses are queuing for network access. TenneT, the national grid operator, estimates that 8,000 firms await initial connection approval, and another 12,000 seek to increase their capacity allocations. Stakeholders warn that unresolved congestion risks choking economic growth.

According to Kys-Jan Lamo: “Looking back, almost all of this could have been prevented.” He acknowledges that post-2015 climate commitments placed heavy emphasis on adding generation and on grid modernization costs more broadly, but “we somewhat underestimated the impact on grid capacity.”

In response, the government has introduced a national “Grid Congestion Action Plan,” aiming to accelerate approvals for infrastructure expansions and to refine regulations to promote smarter grid use. At the same time, feed-in incentives for solar power are being scaled back in some regions, and certain areas may even impose charges to integrate new solar systems into the grid.

The scale of what’s needed is vast. TenneT has proposed adding roughly 100,000 km of new power lines by 2050 and investing in doubling or tripling existing capacity in many areas. However, permit processes can take eight years before construction begins, and many projects require an additional two years to complete. As Lamo points out, “the pace of energy transition far exceeds the grid’s existing capacity — and every new connection request simply extends waiting lists.”

Unless grid expansion keeps up, and as climate pressures intensify, the very clean energy future the Netherlands is striving for may remain constrained by the physics of distribution.


Related Articles


View more

Ottawa to release promised EV sales regulations

Canada ZEV Availability Standard sets EV sales targets and zero-emission mandates, using compliance credits, early credits, and charging infrastructure investments under CEPA to accelerate affordable ZEV supply and meet 2035 net-zero goals.


Key Points

A federal ZEV policy setting 2026-2035 sales targets, using tradable credits and infrastructure incentives under CEPA.

✅ Applies to automakers; compliance via tradable ZEV credits under CEPA.

✅ Targets: 20% by 2026, 60% by 2030, 100% by 2035.

✅ Early credits up to 10% for 2026; charging investments earn credits.


Canadian Automobile manufacturers are on the brink of significant changes as Ottawa prepares to introduce its long-awaited electric vehicle regulations. A reliable source within the government says final regulations are aimed at ensuring that all new passenger vehicles sold in Canada by 2035 are zero-emission vehicles, a goal some critics question through analyses of the 2035 EV mandate in Canada.

These regulations, known as the Electric Vehicle Availability Standard, are designed to encourage automakers to produce more affordable zero-emission vehicles to meet the increasing demand. One of the key concerns for Canada is the potential dominance of zero-emission vehicle supply by other countries, particularly the United States, where several states have already implemented sales targets for such vehicles, and new EPA emission limits are expected to boost EV sales nationwide as well.

It's important to note that these regulations will apply primarily to automakers, rather than dealerships. Under this legislation, manufacturers will be required to accumulate sufficient credits to demonstrate their compliance with the established targets.

Automakers will be able to earn credits based on their sales of low- and no-emissions vehicles. The number of credits earned will depend on how close these vehicles come to meeting a zero-emissions standard. Additionally, manufacturers could earn early credits, amounting to a maximum of 10 percent of their total compliance requirements for 2026, by introducing more electric vehicles to the market ahead of schedule, even amid recent EV shortages and wait times reported across Canada.

Automakers can also increase their credit balance by contributing to the development of electric vehicle charging infrastructure, recognizing that fossil fuels still powered part of Canada's grid in 2019 and that charging availability remains a key enabler. In cases where companies exceed or fall short of their compliance targets, they will have the option to buy or sell credits to other manufacturers or use previously accumulated credits.

Further details regarding these regulations, which will be enacted under the Canadian Environmental Protection Act, are set to be unveiled soon and will intersect with provincial approaches such as Quebec's, where experts have questioned the push for EV dominance as policies evolve.

These regulations will become effective starting with the model year 2026, and sales targets will progressively rise each year until 2035. The federal government's ambitious EV goals are to have 20 percent of all vehicles sold in Canada be zero-emission vehicles by 2026, with that figure increasing to 60 percent by 2030 and reaching 100 percent by 2035.

According to a government analysis conducted in 2022, the anticipated total cost to consumers for zero-emission vehicles and chargers over 25 years is estimated at $24.5 billion, though cost remains a primary barrier for many Canadians considering an EV. However, it is projected that Canadians will save approximately $33.9 billion in net energy costs over the same period. Please note that these estimates are part of a draft and may be subject to change upon the government's release of its final analysis.

In terms of environmental impact, these regulations are expected to prevent the release of an estimated 430 million tonnes of greenhouse gas emissions, according to regulatory analysis. Environmental Defence, a Canadian environmental think-tank, has estimated that the policy would also result in a substantial reduction in gasoline consumption, equivalent to filling approximately 73,000 Olympic-sized swimming pools with gasoline.

Nate Wallace, the program manager for clean transportation at Environmental Defence, emphasized the significance of these regulations, stating, "2035 really needs to be the last year that we are selling gasoline cars in Canada brand new if we're going to have any chance of actually, by 2050, reaching net-zero carbon emissions."


Related News

View more

Sign Up for Electricity Forum’s Newsletter

Stay informed with our FREE Newsletter — get the latest news, breakthrough technologies, and expert insights, delivered straight to your inbox.

Electricity Today T&D Magazine Subscribe for FREE

Stay informed with the latest T&D policies and technologies.
  • Timely insights from industry experts
  • Practical solutions T&D engineers
  • Free access to every issue

Download the 2025 Electrical Training Catalog

Explore 50+ live, expert-led electrical training courses –

  • Interactive
  • Flexible
  • CEU-cerified