Unprecedented Growth in Solar and Storage Anticipated with Record Installations and Investments


solar

Substation Relay Protection Training

Our customized live online or in‑person group training can be delivered to your staff at your location.

  • Live Online
  • 12 hours Instructor-led
  • Group Training Available
Regular Price:
$699
Coupon Price:
$599
Reserve Your Seat Today

U.S. Clean Energy Transition accelerates with IRA and BIL, boosting renewable energy, solar PV, battery storage, EV adoption, manufacturing, grid resilience, and jobs while targeting carbon-free electricity by 2035 and net-zero emissions by 2050.


Key Points

U.S. shift to renewables under IRA and BIL scales solar, storage, and EVs toward carbon-free power by 2035.

✅ Renewables reached ~22% of U.S. electricity generation in 2022.

✅ Nearly $13b in PV manufacturing; 94 plants; 25k jobs announced.

✅ Battery storage grew from 3% in 2017 to 36% by H1 2023.


In recent years, the United States has made remarkable strides in embracing renewable energy, with notable solar and wind growth helping to position itself for a more sustainable future. This transition has been driven by a combination of factors, including environmental concerns, economic opportunities, and technological advancements.

With the introduction of the Inflation Reduction Act (IRA) and the Bipartisan Infrastructure Law (BIL), the United States is rapidly advancing its journey towards clean energy solutions.

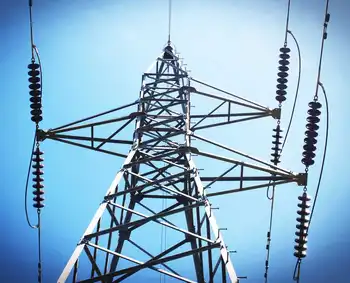
To underscore the extent of this progress, consider the following vital statistics: In 2022, renewable energy sources (including hydroelectric power) accounted for approximately 22% of the nation's electricity generation, and renewables surpassed coal in the mix that year, while the share of renewables in total electricity generation capacity had risen to around 30% and the nation is moving toward 30% electricity from wind and solar as well.

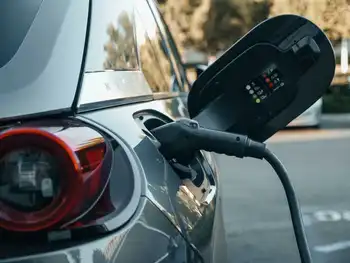
Notably, in the transportation sector, consumers are increasingly embracing zero-emission fuels, such as electric vehicles. In 2022, battery electric vehicles (BEVs) represented 5.6% of new vehicle registrations, surging to 7.1% by the first half of 2023, according to estimates from EUPD Research.

The United States has set ambitious targets, including achieving 100% carbon pollution-free electricity by 2035 and aiming for economy-wide net-zero greenhouse gas emissions by no later than 2050, and policy proposals such as Biden's solar plan reinforce these goals for the power sector. These targets are poised to provide a significant boost to the clean energy sector in the country, reaffirming its commitment to a sustainable and environmentally responsible future.


IRA and BIL: Catalysts for Growth

The IRA and BIL represent a transformative shift in the landscape of clean energy policy, heralding a new era for the solar and energy storage sectors in the United States. The IRA allocates substantial resources to address the climate crisis, fortify domestic clean energy production, and solidify the U.S. as a global leader in clean energy manufacturing.

According to the U.S. Department of Energy (DOE), an impressive investment exceeding $120 billion has been announced for the U.S. battery manufacturing and supply chain sector since the introduction of IRA and BIL. Additionally, plans have been unveiled for over 200 new or expanded facilities dedicated to minerals, materials processing, and manufacturing. This move is expected to create more than 75,000 potential job opportunities, strengthening the nation's workforce.

Following the introduction of IRA and BIL, solar photovoltaic (PV) manufacturing in the U.S. has also witnessed a substantial surge in planned investments, totaling nearly $13 billion, as reported by the DOE. Furthermore, a total of 94 new and expanded PV manufacturing plants have been announced, potentially generating over 25,000 jobs in the country.


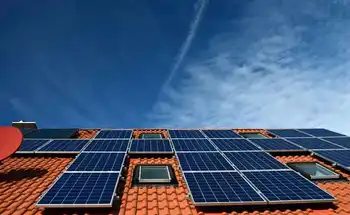
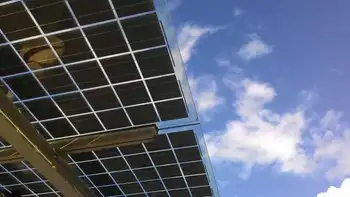
Booming Solar Sector

In recent years, the U.S. solar sector has outpaced other energy sources, including a surging wind sector and natural gas, in terms of capacity growth. EUPD Research estimates reveal a notable upward trend in the contribution of solar capacity to annual power capacity additions, as 82% of the 2023 pipeline consists of wind, solar, and batteries across utility-scale projects. This trajectory has risen from 37% in 2019 to 38% in 2020, further increasing to 44% in 2021 and an impressive 45% in 2022.

Although the country experienced a temporary setback in 2022 due to pandemic-related delays, trade law enforcement, supply chain disruptions, and rising costs, it is now on track to make a historic addition to its PV capacity in 2023. According to EUPD Research's 2023 forecast, the U.S. is poised to achieve its largest-ever expansion in PV capacity, estimated at 32 to 35 GWdc, assuming the installation of all planned utility-scale capacity, and solar generation rose 25% in 2022 as a supportive indicator. Additionally, from 2023 to 2028, the U.S. is projected to add approximately 233 GWdc of PV capacity.

In terms of cumulative installed PV capacity (including utility-scale, commercial and industrial, and residential) on a state-by-state basis, California holds the top position, followed by Texas, Florida, North Carolina, and Arizona. Remarkably, Texas is rapidly expanding its utility-scale PV capacity and may potentially surpass California in the next two years.


Rapid Growth in Battery Storage

Battery energy storage has emerged as the dominant and rapidly expanding source of energy storage in the U.S. in recent years. The proportion of battery storage in the country's energy storage capacity has surged dramatically, increasing from a mere 3% in 2017 to a substantial 36% in the first half of 2023.


Related News

Related News

Germany gets solar power boost amid energy crisis

Germany Solar Boom is accelerating amid energy security pressures, with photovoltaic capacity surging as renewables displace gas. Policy incentives, grid upgrades, and storage, plus agrivoltaics and rooftop systems, position solar as cornerstone of decarbonization.


Key Points

Germany Solar Boom is rapid PV growth enhancing energy security, cutting emissions, and expanding domestic, low-carbon electricity.

✅ Targets 250 GW PV by 2032 to meet rising electricity demand.

✅ Rooftop, agrivoltaics, and BIPV reduce land use and grid stress.

✅ Diversifies supply chains beyond China; boosts storage and flexibility.


Europe is in crisis mode. Climate change, increasing demand for energy, the war in Ukraine and Russia's subsequent throttling of oil and gas deliveries have pushed the continent into a new era.

Germany has been trapped in a corner. The country relies heavily on cheap imported natural gas to run its industries. Some power plants also use gas to produce electricity. Finding enough substitutes quickly is nearly impossible.

Ideas to prevent a looming power crisis in Germany have ranged from reducing demand to keeping nuclear power plants online past their official closing date at the end of the year. Large wind turbines are doing their part, but many people don't want them in their backyard.

Green activists have long believed renewable energies are the answer to keeping the lights on. But building up these capabilities takes time. Now many experts once again see solar power as a shining light at the end of the tunnel, as global renewables set fresh records worldwide. Some say a solar boom is in the making.

Before the war in Ukraine put energy security at the forefront, the new German government had already pledged that renewable sources — wind and solar — would make up 80% of electricity production by 2030 instead of 42% today. By 2035, electricity generation should be carbon neutral.

It is an ambitious plan, but the country seems to be on its way. July was the third month in a row when solar power output soared to a record level, trade publication pv magazine reported, and clean energy's share reached about 50% in Germany according to recent assessments. For the month, photovoltaic (PV) systems generated 8.23 ​​terawatt hours of power, around a fifth of net electricity production. They were only behind lignite-fired power plants, which brought in nearly 22% of net production. 

Solar cells hanging on a modular solar house during the Solar Decathlon Europe in Wuppertal, Germany
Solar panels can come in many different shapes and sizes, and be used in many different ways

Last year, Germany added more than 5 gigawatts of solar power capacity, 10% more than in 2020. That took the total solar power capacity to 59 gigawatts, overtaking installed onshore wind power capacity in Germany, pv magazine said in January. Last year's solar production was about 9% of gross electricity consumption, according to Harry Wirth, who is head of photovoltaic modules and power plant research at the Fraunhofer Institute for Solar Energy Systems in Freiburg.

"For 2032, the government target is around 250 gigawatts of solar energy. According to their estimates, electricity consumption will increase to 715 terawatt hours by 2030," Wirth told DW. A different study by consultancy McKinsey says this is the lower limit. "So if we assume 730 terawatt hours for 2032, we would be at around 30% photovoltaic electricity in gross electricity consumption," he added. 

The energy expert also envisions great potential to install more solar panels without taking up valuable land. Besides adding them on top of parking garages or buildings, photovoltaic parts can be integrated into the exterior of buildings or even on the outside of e-vehicles. This would "not only produce electricity on surfaces already in use, but it would also create synergies in its own application," said Wirth.

Foreign investment in German solar
It is not just researchers that are taking note. Big businesses are stepping in too. In July, Portuguese clean energy firm EDP Renovaveis (EDPR) announced it had agreed to take a 70% interest in Germany's Kronos Solar Projects, a solar developer, for €250 million ($254 million).

The Munich-based company has a portfolio of 9.4 gigawatts of solar projects in different stages of development in Germany, France, the Netherlands and the UK, according to the press release announcing the purchase. Germany represents close to 50% of the acquired solar portfolio.

EDPR, which claims to be the fourth-largest renewable energy producer worldwide, said it generated 17.8 terawatt hours of clean energy in the first half of 2022.

Miguel Stilwell d'Andrade, chief executive of EDPR and its parent EDP, said they have great expectations from Germany in particular as "it is a key market in Europe with reinforced renewable growth targets." 

Fabian Karthaus is one of the first farmers in Germany to grow raspberries and blueberries under photovoltaic panels. His solar field near the city of Paderborn in northwestern Germany is 0.4 hectares (about 1 acre), but he would like to expand it to 10. He could then generate enough electricity for around 4,000 households — and provide more berries for supermarkets.

Germany was once a leader in solar power. For many years the country enjoyed a large share of the world's total solar capacities. A lot of that early success had to do with innovative government support. That support, however, proved too successful for some as a fall in wholesale electricity prices in Northern Europe hurt the profits of power companies, leading to calls for a change in the rules.

Updated regulations, and changes to the Renewable Energy Sources Act that reduced feed-in tariffs slowed things down. Feed-in tariffs usually grant long-term grid access and above-market price guarantees in an effort to support fledgling industries.

With less direct financial incentives, the industry was neglected leaving it open for competitors. The pace of solar infrastructure growth has also been hampered by issues of red tape, supply chain backlogs, a lack of skilled technicians and, despite solar-plus-storage now undercutting conventional power in Germany, a shortage of storage for electricity produced when it is not needed.

Now the war in Ukraine and Europe's dependency on Russia is refocusing efforts and "will strengthen the determination for an ambitious PV expansion," said Wirth. But the biggest challenge to the region's solar industry remains China.

Public buildings can play a big role, not just because of their size, but because the government is in charge of them

An overreliance on China
China took an early interest in photovoltaic technology and soon galloped past countries like the US, Japan and Germany thanks to huge state subsidies that manufacturers enjoyed. Today, it has become the place to go for all things solar, even as Europe turns to US solar equipment suppliers to diversify procurement.

A new report from the International Energy Agency puts it into numbers. "China has invested over $50 billion in new PV supply capacity — 10 times more than Europe — and created more than 300,000 manufacturing jobs across the solar PV value chain since 2011."

Today China has over 80% of all solar panel manufacturing capacity and is home to the top-10 suppliers of photovoltaic manufacturing equipment. Such a high concentration has led to some incredible realities, like the fact that "one out of every seven panels produced worldwide is manufactured by a single facility," according to the report.

These economies of scale have brought down costs, and the country can make solar components 35% cheaper than in Europe. This gives China outsized power and makes the industry susceptible to supply chain bottlenecks. To diversify the industry and get back some of this market, Europe needs to invest in innovation and make solar growth a top priority.

Germany has several high-tech photovoltaic manufacturers and research institutes. But it only has one manufacturer of solar cells specializing in high-performance heterojunction technology, says Wirth. Yet even though the European photovoltaic industry is fragmented and not what it once was, he is still counting on big demand for solar technology in the foreseeable future, with markets like Poland accelerating adoption across the region. 


Related News

View more

Electric Cars 101: How EV Motors Work, Tech Differences, and More

Electric Car Motors convert electricity to torque via rotor-stator magnetic fields, using AC/DC inverters, permanent magnets or induction designs; they power EV powertrains efficiently and enable regenerative braking for energy recovery and control.


Key Points

Electric car motors turn electrical energy into wheel torque using rotor-stator fields, inverters, and AC or DC control.

✅ AC induction, PMSM, BLDC, and reluctance architectures explained

✅ Inverters manage AC/DC, voltage, and motor speed via frequency

✅ Regenerative braking recovers energy and reduces wear


When was the last time you stopped to think about how electric cars actually work, especially if you're wondering whether to buy an electric car today? We superfans of the car biz have mostly developed a reasonable understanding of how combustion powertrains work. Most of us can visualize fuel and air entering a combustion chamber, exploding, pushing a piston down, and rotating a crankshaft that ultimately turns the wheels. We generally understand the differences between inline, flat, vee-shaped, and maybe even Wankel rotary combustion engines.

Mechanical engineering concepts such as these are comparatively easy to comprehend. But it's probably a fair bet to wager that only a minority of folks reading this can explain on a bar napkin exactly how invisible electrons turn a car's wheels or how a permanent-magnet motor differs from an AC induction one. Electrical engineering can seem like black magic and witchcraft to car nuts, so it's time to demystify this bold new world of electromobility, with the age of electric cars arriving ahead of schedule.

How Electric Cars Work: Motors
It has to do with magnetism and the natural interplay between electric fields and magnetic fields. When an electrical circuit closes allowing electrons to move along a wire, those moving electrons generate an electromagnetic field complete with a north and a south pole. When this happens in the presence of another magnetic field—either from a different batch of speeding electrons or from Wile E. Coyote's giant ACME horseshoe magnet, those opposite poles attract, and like poles repel each other.


Electric motors work by mounting one set of magnets or electromagnets to a shaft and another set to a housing surrounding that shaft. By periodically reversing the polarity (swapping the north and south poles) of one set of electromagnets, the motor leverages these attracting and repelling forces to rotate the shaft, thereby converting electricity into torque and ultimately turning the wheels, in a sector where the electric motor market is growing rapidly worldwide. Conversely—as in the case of regenerative braking—these magnetic/electromagnetic forces can transform motion back into electricity.

How Electric Cars Work: AC Or DC?
The electricity supplied to your home arrives as alternating current (AC), and bidirectional charging means EVs can power homes for days as needed, so-called because the north/south or plus/minus polarity of the power changes (alternates) 60 times per second. (That is, in the United States and other countries operating at 110 volts; countries with a 220-volt standard typically use 50-Hz AC.) Direct current (DC) is what goes into and comes out of the + and - poles of every battery. As noted above, motors require alternating current to spin. Without it, the electromagnetic force would simply lock their north and south poles together. It's the cycle of continually switching north and south that keeps a motor spinning.


Today's electric cars are designed to manage both AC and DC energy on board. The battery stores and dispenses DC current, but again, the motor needs AC. When recharging the battery, and with increasing grid coordination enabling flexibility, the energy comes into the onboard charger as AC current during Level 1 and Level 2 charging and as DC high-voltage current on Level 3 "fast chargers." Sophisticated power electronics (which we will not attempt to explain here) handle the multiple onboard AC/DC conversions while stepping the voltage up and down from 100 to 800 volts of charging power to battery/motor system voltages of 350-800 volts to the many vehicle lighting, infotainment, and chassis functions that require 12-48-volt DC electricity.

How Electric Cars Work: What Types Of Motors?
DC Motor (Brushed): Yes, we just said AC makes the motor go around, and these old-style motors that powered early EVs of the 1900s are no different. DC current from the battery is delivered to the rotor windings via spring-loaded "brushes" of carbon or lead that energize spinning contacts connected to wire windings. Every few degrees of rotation, the brushes energize a new set of contacts; this continually reverses the polarity of the electromagnet on the rotor as the motor shaft turns. (This ring of contacts is known as the commutator).

The housing surrounding the rotor's electromagnetic windings typically features permanent magnets. (A "series DC" or so-called "universal motor" may use an electromagnetic stator.) Advantages are low initial cost, high reliability, and ease of motor control. Varying the voltage regulates the motor's speed, while changing the current controls its torque. Disadvantages include a lower lifespan and the cost of maintaining the brushes and contacts. This motor is seldom used in transportation today, save for some Indian railway locomotives.

Brushless DC Motor (BLDC): The brushes and their maintenance are eliminated by moving the permanent magnets to the rotor, placing the electromagnets on the stator (housing), and using an external motor controller to alternately switch the various field windings from plus to minus, thereby generating the rotating magnetic field.

Advantages are a long lifespan, low maintenance, and high efficiency. Disadvantages are higher initial cost and more complicated motor speed controllers that typically require three Hall-effect sensors to get the stator-winding current phased correctly. That switching of the stator windings can result in "torque ripple"—periodic increases and decreases in the delivered torque. This type of motor is popular for smaller vehicles like electric bikes and scooters, and it's used in some ancillary automotive applications like electric power steering assist.


Permanent-Magnet Synchronous Motor (PMSM): Physically, the BLDC and PMSM motors look nearly identical. Both feature permanent magnets on the rotor and field windings in the stator. The key difference is that instead of using DC current and switching various windings on and off periodically to spin the permanent magnets, the PMSM functions on continuous sinusoidal AC current. This means it suffers no torque ripple and needs only one Hall-effect sensor to determine rotor speed and position, so it's more efficient and quieter.

The word "synchronous" indicates the rotor spins at the same speed as the magnetic field in the windings. Its big advantages are its power density and strong starting torque. A main disadvantage of any motor with spinning permanent magnets is that it creates "back electromotive force" (EMF) when not powered at speed, which causes drag and heat that can demagnetize the motor. This motor type also sees some duty in power steering and brake systems, but it has become the motor design of choice in most of today's battery electric and hybrid vehicles.


Note that most permanent-magnet motors of all kinds orient their north-south axis perpendicular to the output shaft. This generates "radial (magnetic) flux." A new class of "axial flux" motors orients the magnets' N-S axes parallel to the shaft, usually on pairs of discs sandwiching stationary stator windings in between. The compact, high-torque axial flux orientation of these so-called "pancake motors" can be applied to either BLDC or PMSM type motors.


AC Induction: For this motor, we toss out the permanent magnets on the rotor (and their increasingly scarce rare earth materials) and keep the AC current flowing through stator windings as in the PMSM motor above.

Standing in for the magnets is a concept Nikola Tesla patented in 1888: As AC current flows through various windings in the stator, the windings generate a rotating field of magnetic flux. As these magnetic lines pass through perpendicular windings on a rotor, they induce an electric current. This then generates another magnetic force that induces the rotor to turn. Because this force is only induced when the magnetic field lines cross the rotor windings, the rotor will experience no torque or force if it rotates at the same (synchronous) speed as the rotating magnetic field.

This means AC induction motors are inherently asynchronous. Rotor speed is controlled by varying the alternating current's frequency. At light loads, the inverter controlling the motor can reduce voltage to reduce magnetic losses and improve efficiency. Depowering an induction motor during cruising when it isn't needed eliminates the drag created by a permanent-magnet motor, while dual-motor EVs using PMSM motors on both axles must always power all motors. Peak efficiency may be slightly greater for BLDC or PMSM designs, but AC induction motors often achieve higher average efficiency. Another small trade-off is slightly lower starting torque than PMSM. The GM EV1 of the mid-1990s and most Teslas have employed AC Induction motors, despite skepticism about an EV revolution in some quarters.


Reluctance Motor: Think of "reluctance" as magnetic resistance: the degree to which an object opposes magnetic flux. A reluctance motor's stator features multiple electromagnet poles—concentrated windings that form highly localized north or south poles. In a switched reluctance motor (SRM), the rotor is made of soft magnetic material such as laminated silicon steel, with multiple projections designed to interact with the stator's poles. The various electromagnet poles are turned on and off in much the same way the field windings in a BLDC motor are. Using an unequal number of stator and rotor poles ensures some poles are aligned (for minimum reluctance), while others are directly in between opposite poles (maximum reluctance). Switching the stator polarity then pulls the rotor around at an asynchronous speed.


A synchronous reluctance motor (SynRM) doesn't rely on this imbalance in the rotor and stator poles. Rather, SynRM motors feature a more distributed winding fed with a sinusoidal AC current as in a PMSM design, with speed regulated by a variable-frequency drive, and an elaborately shaped rotor with voids shaped like magnetic flux lines to optimize reluctance.

The latest trend is to place small permanent magnets (often simpler ferrite ones) in some of these voids to take advantage of both magnetic and reluctance torque while minimizing cost and the back EMF (or counter-electromotive force) high-speed inefficiencies that permanent-magnet motors suffer.

Advantages include lower cost, simplicity, and high efficiency. Disadvantages can include noise and torque ripple (especially for switched reluctance motors). Toyota introduced an internal permanent-magnet synchronous reluctance motor (IPM SynRM) on the Prius, and Tesla now pairs one such motor with an AC induction motor on its Dual Motor models. Tesla also uses IPM SynRM as the single motor for its rear-drive models.


Electric motors may never sing like a small-block or a flat-plane crank Ferrari. But maybe, a decade or so from now, we'll regard the Tesla Plaid powertrain as fondly as we do those engines, even as industry leaders note that mainstream adoption faces hurdles, and every car lover will be able to describe in intimate detail what kind of motors it uses.


Related News

View more

Biden's proposed tenfold increase in solar power would remake the U.S. electricity system

US Solar Power 2050 Target projects 45% electricity from solar, advancing decarbonization with clean energy, wind, nuclear, hydropower, hydrogen, and scalable energy storage, while modernizing the grid and transmission to cut emissions and create jobs.


Key Points

A goal for solar to supply ~45% of US electricity by 2050, backed by energy storage and other low-carbon generation.

✅ Requires 1,050-1,570 GW solar and matching storage capacity

✅ Utility-scale buildout uses ~10M acres; rooftop 10-20% of capacity

✅ Complemented by wind, nuclear, hydropower, hydrogen, and flexible turbines


President Joe Biden has called for major clean energy investments as a way to curb climate change and generate jobs. On Sept. 8, 2021, the White House released a report produced by the U.S. Department of Energy that found that solar power could generate up to 45% of the U.S. electricity supply by 2050, compared to less than 4% today, with about 3% in 2020 noted by industry observers. The Conversation asked Joshua D. Rhodes, an energy technology and policy researcher at the University of Texas at Austin, what it would take to meet this target.

Why such a heavy focus on solar power? Doesn’t a low-carbon future require many types of clean energy, even though wind and solar could meet about 80% of demand according to some research?
The Energy Department’s Solar Futures Study lays out three future pathways for the U.S. grid: business as usual; decarbonization, meaning a massive shift to low-carbon and carbon-free energy sources; and decarbonization with economy-wide electrification of activities that are powered now by fossil fuels.

It concludes that the latter two scenarios would require approximately 1,050-1,570 gigawatts of solar power, which would meet about 44%-45% of expected electricity demand in 2050, even as renewables approach one-fourth of U.S. generation in the near term. For perspective, one gigawatt of generating capacity is equivalent to about 3.1 million solar panels or 364 large-scale wind turbines.

The rest would come mostly from a mix of other low- or zero-carbon sources, including wind, nuclear, hydropower, biopower, geothermal and combustion turbines run on zero-carbon synthetic fuels such as hydrogen. Energy storage capacity – systems such as large installations of high-capacity batteries – would also expand at roughly the same rate as solar, with record growth in solar and storage anticipated by industry in coming years.

One advantage solar power has over many other low-carbon technologies is that most of the U.S. has lots of sunshine. Wind, hydropower and geothermal resources aren’t so evenly distributed: There are large zones where these resources are poor or nonexistent.

Relying more heavily on region-specific technologies would mean developing them extremely densely where they are most abundant. It also would require building more high-voltage transmission lines to move that energy over long distances, which could increase costs and draw opposition from landowners – a key reason the grid isn't yet 100% renewable according to experts – in many regions.

Is generating 45% of U.S. electricity from solar power by 2050 feasible?
I think it would be technically possible but not easy. It would require an accelerated and sustained deployment far larger than what the U.S. has achieved so far, even as the cost of solar panels has fallen dramatically, and wind, solar and batteries are 82% of the utility-scale pipeline across the country. Some regions have attained this rate of growth, albeit from low starting points and usually not for long periods.

The Solar Futures Study estimates that producing 45% of the nation’s electricity from solar power by 2050 would require deploying about 1,600 gigawatts of solar generation. That’s a 1,450% increase from the 103 gigawatts that are installed in the U.S. today, even as wind and solar trend toward 30% of U.S. electricity in some outlooks. For perspective, there are currently about 1,200 gigawatts of electricity generation capacity of all types on the U.S. power grid.

The report assumes that 10%-20% of this new solar capacity would be deployed on homes and businesses. The rest would be large utility-scale deployments, mostly solar panels, plus some large-scale solar thermal systems that use mirrors to reflect the sun to a central tower.

Assuming that utility-scale solar power requires roughly 8 acres per megawatt, this expansion would require approximately 10.2 million to 11.5 million acres. That’s an area roughly as big as Massachusetts and New Jersey combined, although it’s less than 0.5% of total U.S. land mass.

I think goals like these are worth setting, but are good to reevaluate over time to make sure they represent the most prudent path.


Related News

View more

Winds of Change: Vineyard Wind Ushers in a New Era for Clean Energy

Vineyard Wind Offshore Wind Farm delivers clean power to Massachusetts near Martha's Vineyard, with 62 turbines and 800 MW capacity, advancing renewable energy, cutting carbon, lowering costs, and driving net-zero emissions and green jobs.


Key Points

An 800 MW Massachusetts offshore project of 62 turbines supplying clean power to 400,000+ homes and cutting emissions.

✅ 800 MW powering 400,000+ MA homes and businesses

✅ 62 turbines, 13 MW each, 15 miles from Martha's Vineyard

✅ Cuts 1.6M tons CO2 annually; boosts jobs and port infrastructure


The crisp Atlantic air off the coast of Martha's Vineyard carried a new melody on February 2nd, 2024. Five colossal turbines, each taller than the Statue of Liberty, began their graceful rotations, marking the historic moment power began flowing from Vineyard Wind, the first large-scale offshore wind farm in the United States, enabled by Interior Department approval earlier in the project timeline. This momentous occasion signifies a seismic shift in Massachusetts' energy landscape, one that promises cleaner air, lower energy costs, and a more sustainable future for generations to come.

Nestled 15 miles southeast of Martha's Vineyard and Nantucket, Vineyard Wind is a colossal undertaking. The project, a joint venture between Avangrid Renewables and Copenhagen Infrastructure Partners, will ultimately encompass 62 turbines, each capable of generating a staggering 13 megawatts. Upon full completion later this year, Vineyard Wind will power over 400,000 homes and businesses across Massachusetts, contributing a remarkable 800 megawatts to the state's energy grid.

But the impact of Vineyard Wind extends far beyond mere numbers. This trailblazing project holds immense environmental significance. By harnessing the clean and inexhaustible power of the wind, Vineyard Wind is projected to annually reduce carbon emissions by a staggering 1.6 million metric tons – equivalent to taking 325,000 cars off the road. This translates to cleaner air, improved public health, and a crucial step towards mitigating the climate crisis.

Governor Maura Healey hailed the project as a "turning point" in Massachusetts' clean energy journey. "Across the Commonwealth, homes and businesses will now be powered by clean, affordable energy, contributing to cleaner air, lower energy costs, and pushing us closer to achieving net-zero emissions," she declared.

Vineyard Wind's impact isn't limited to the environment; it's also creating a wave of economic opportunity. Since its inception in 2017, the project has generated nearly 2,000 jobs, with close to 1,000 positions filled by union workers thanks to a dedicated Project Labor Agreement. Construction has also breathed new life into the New Bedford Marine Commerce Terminal, with South Coast construction activity accelerating around the port, transforming it into the nation's first port facility specifically designed for offshore wind, showcasing the project's commitment to local infrastructure development.

"Every milestone on Vineyard Wind 1 is special, but powering up these first turbines stands apart," emphasized Pedro Azagra, CEO of Avangrid Renewables. "This accomplishment reflects the years of dedication and collaboration that have defined this pioneering project. Each blade rotation and megawatt flowing to Massachusetts homes is a testament to the collective effort that brought offshore wind power to the United States."

Vineyard Wind isn't just a project; it's a catalyst for change. It perfectly aligns with Massachusetts' ambitious clean energy goals, which include achieving net-zero emissions by 2050 and procuring 3,200 megawatts of offshore wind by 2028, while BOEM lease requests in the Northeast continue to expand the development pipeline across the region. As Energy and Environmental Affairs Secretary Rebecca Tepper stated, "Standing up a new industry is no easy feat, but we're committed to forging ahead and growing this sector to lower energy costs, create good jobs, and build a cleaner, healthier Commonwealth."

The launch of Vineyard Wind transcends Massachusetts, serving as a beacon for the entire U.S. offshore wind industry, as New York's biggest offshore wind farm moves forward to amplify regional momentum. This demonstration of large-scale development paves the way for further investment and growth in this critical clean energy source. However, the journey isn't without its challenges, and questions persist about reaching 1 GW on the grid nationwide as stakeholders navigate timelines. Concerns regarding potential impacts on marine life and visual aesthetics remain, requiring careful consideration and ongoing community engagement.

Despite these challenges, Vineyard Wind stands as a powerful symbol of hope and progress. It represents a significant step towards a cleaner, more sustainable future, powered by renewable energy sources at a time when U.S. offshore wind is about to soar according to industry outlooks. It's a testament to the collaborative effort of policymakers, businesses, and communities working together to tackle the climate crisis. As the turbines continue their majestic rotations, they carry a message of hope, reminding us that a brighter, more sustainable future is within reach, powered by the wind of change.

Additional Considerations:

  • The project boasts a dedicated Fisheries Innovation Fund, fostering collaboration between the fishing and offshore wind industries to ensure sustainable coexistence.
  • Vineyard Wind has invested in education and training programs, preparing local residents for careers in the burgeoning wind energy sector.
  • The project's success opens doors for further offshore wind development in the U.S., such as Long Island proposals gaining attention, paving the way for a clean energy revolution.


Related News

View more

Solar Is Now 33% Cheaper Than Gas Power in US, Guggenheim Says

US Renewable Energy Cost Advantage signals cheaper utility-scale solar and onshore wind versus natural gas, with LCOE declines, tax credits, and climate policy cutting electricity costs for utilities and grids across the United States.


Key Points

Cheaper solar and wind than natural gas, driven by LCOE drops, tax credits, and policy, lowering US electricity costs.

✅ Utility-scale solar is about one-third cheaper than gas

✅ Onshore wind costs roughly 44 percent less than natural gas

✅ Policy and tax credits accelerate renewables and cut power prices


Natural gas’s dominance as power-plant fuel in the US is fading fast as the cost of electricity generated by US wind and solar projects tumbles and as wind and solar surpass coal in the generation mix, according to Guggenheim Securities.

Utility-scale solar is now about a third cheaper than gas-fired power, while onshore wind is about 44% less expensive, Guggenheim analysts led by Shahriar Pourreza said Monday in a note to clients, a dynamic consistent with falling wholesale power prices in several markets today. 

“Solar and wind now present a deflationary opportunity for electric supply costs,” the analysts said, which “supports the case for economic deployment of renewables across the US,” as the country moves toward 30% wind and solar and one-fourth of total generation in the near term.

Gas prices have surged amid a global supply crunch after Russia’s invasion of Ukraine, while tax-credit extensions and sweeping US climate legislation have brought down the cost of wind and solar, even as renewables surpassed coal in 2022 nationwide. Renewables-heavy utilities like NextEra Energy Inc. and Allete Inc. stand to benefit, and companies that can boost spending on wind and solar, as wind, solar and batteries dominate the 2023 pipeline, will also see faster growth, Guggenheim said.


Related News

View more

Canadian climate policy and its implications for electricity grids

Canada Electricity Decarbonization Costs indicate challenging greenhouse gas reductions across a fragmented grid, with wind, solar, nuclear, and natural gas tradeoffs, significant GDP impacts, and Net Zero targets constrained by intermittency and limited interties.


Key Points

Costs to cut power CO2 via wind, solar, gas, and nuclear, considering grid limits, intermittency, and GDP impacts.

✅ Alberta model: eliminate coal; add wind, solar, gas; 26-40% CO2 cuts

✅ Nuclear option enables >75% cuts at higher but feasible system costs

✅ National costs 1-2% GDP; reserves, transmission, land, and waste not included


Along with many western developed countries, Canada has pledged to reduce its greenhouse gas emissions by 40–45 percent by 2030 from 2005 emissions levels, and to achieve net-zero emissions by 2050.

This is a huge challenge that, when considered on a global scale, will do little to stop climate change because emissions by developing countries are rising faster than emissions are being reduced in developed countries. Even so, the potential for achieving emissions reduction targets is extremely challenging as there are questions as to how and whether targets can be met and at what cost. Because electricity can be produced from any source of energy, including wind, solar, geothermal, tidal, and any combustible material, climate change policies have focused especially on nations’ electricity grids, and in Canada cleaning up electricity is viewed as critical to meeting climate pledges.

Canada’s electricity grid consists of ten separate provincial grids that are weakly connected by transmission interties to adjacent grids and, in some cases, to electricity systems in the United States. At times, these interties are helpful in addressing small imbalances between electricity supply and demand so as to prevent brownouts or even blackouts, and are a source of export revenue for provinces that have abundant hydroelectricity, such as British Columbia, Manitoba, and Quebec.

Due to generally low intertie capacities between provinces, electricity trade is generally a very small proportion of total generation, though electricity has been a national climate success in recent years. Essentially, provincial grids are stand alone, generating electricity to meet domestic demand (known as load) from the lowest cost local resources.

Because climate change policies have focused on electricity (viz., wind and solar energy, electric vehicles), and Canada will need more electricity to hit net-zero according to the IEA, this study employs information from the Alberta electricity system to provide an estimate of the possible costs of reducing national CO2 emissions related to power generation. The Alberta system serves as an excellent case study for examining the potential for eliminating fossil-fuel generation because of its large coal fleet, favourable solar irradiance, exceptional wind regimes, and potential for utilizing BC’s reservoirs for storage.

Using a model of the Alberta electricity system, we find that it is infeasible to rely solely on renewable sources of energy for 100 percent of power generation—the costs are prohibitive. Under perfect conditions, however, CO2 emissions from the Alberta grid can be reduced by 26 to 40 percent by eliminating coal and replacing it with renewable energy such as wind and solar, and gas, but by more than 75 percent if nuclear power is permitted. The associated costs are estimated to be some $1.4 billion per year to reduce emissions by at most 40 percent, or $1.9 billion annually to reduce emissions by 75 percent or more using nuclear power (an option not considered feasible at this time).

Based on cost estimates from Alberta, and Ontario’s experience with subsidies to renewable energy, and warnings that the switch from fossil fuels to electricity could cost about $1.4 trillion, the costs of relying on changes to electricity generation (essentially eliminating coal and replacing it with renewable energy sources and gas) to reduce national CO2 emissions by about 7.4 percent range from some $16.8 to $33.7 billion annually. This constitutes some 1–2 percent of Canada’s GDP.

The national estimates provided here are conservative, however. They are based on removing coal-fired power from power grids throughout Canada. We could not account for scenarios where the scale of intermittency turned out worse than indicated in our dataset—available wind and solar energy might be lower than indicated by the available data. To take this into account, a reserve market is required, but the costs of operating such a capacity market were not included in the estimates provided in this study. Also ignored are the costs associated with the value of land in other alternative uses, the need for added transmission lines, environmental and human health costs, and the life-cycle costs of using intermittent renewable sources of energy, including costs related to the disposal of hazardous wastes from solar panels and wind turbines.


Related News

View more

Sign Up for Electricity Forum’s Newsletter

Stay informed with our FREE Newsletter — get the latest news, breakthrough technologies, and expert insights, delivered straight to your inbox.

Electricity Today T&D Magazine Subscribe for FREE

Stay informed with the latest T&D policies and technologies.
  • Timely insights from industry experts
  • Practical solutions T&D engineers
  • Free access to every issue

Live Online & In-person Group Training

Advantages To Instructor-Led Training – Instructor-Led Course, Customized Training, Multiple Locations, Economical, CEU Credits, Course Discounts.

Request For Quotation

Whether you would prefer Live Online or In-Person instruction, our electrical training courses can be tailored to meet your company's specific requirements and delivered to your employees in one location or at various locations.