AEP coal-plant construction faces new hurdles

By Reuters


Protective Relay Training - Basic

Our customized live online or in‑person group training can be delivered to your staff at your location.

  • Live Online
  • 12 hours Instructor-led
  • Group Training Available
Regular Price:
$699
Coupon Price:
$599
Reserve Your Seat Today
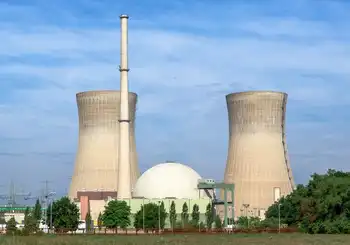
Texas regulators added two cost-related caveats to a final order approving American Electric Power Co's plan to build a coal-fired power plant in Arkansas while regulators in that state delayed action on the unit's air permit.

In its final order the Texas Public Utility Commission said Texas customers of AEP's Southwestern Electric Power Co (SWEPCO) unit will pay no more their share of the $1.52 billion price tag to build the 600-megawatt John W Turk Jr. coal-fired plant in Fulton, Arkansas.

"This cap on the capital cost of the Turk plant limits the financial risk to Texas ratepayers," the order said.

Texas regulators, who voted last month to approve the plant, also limited the amount of future carbon-mitigation costs than can be passed to Texas ratepayers at $28 per ton through 2030.

Estimated costs for carbon mitigation ranged from $13 to $70 per ton, with the average between $30-$45, the order said.

SWEPCO spokesman Scott McCloud said the utility is evaluating the final order and had no comment on whether the company would file an appeal.

Commissioner Julie Parsley, who voted against SWEPCO's plan, said both stipulations "are not legally enforceable" on future commissions.

Meanwhile, issuance of an air permit for Turk, tentatively approved by the air division of the Arkansas Department of Environmental Quality, will be delayed from the third quarter, McCloud said, after that agency scheduled a second public hearing to allow comment on SWEPCO's plan to control mercury emissions.

While not required, the agency decided to hold a hearing next month on the mercury issue after a federal court ruling halted implementation of the Clean Air Mercury Rule.

AEP revised its Turk application to comply with Arkansas mercury emission rules leading to a need for additional public input. No permit can be issued until response to public comments are completed, an agency spokesman said.

Rising construction costs and climate-change worry have led utilities to cancel dozens of proposed coal-fired units in the past two years. Even so, more coal plants are being built in the U.S. now than two decades, according to a government report.

About 29 coal plants with a capacity exceeding 15,000 MW are under construction. Another 20 projects have permits or are near construction. Operation of the Turk plant is expected in the second half of 2012.

Related News

India’s Kakrapur 3 achieves criticality

Kakrapar Unit 3 700MWe PHWR achieved first criticality, showcasing indigenously designed nuclear power, NPCIL operations, Make in India manufacturing, advanced safety systems, grid integration, and closed-fuel-cycle strategy for India's expansion of pressurised heavy water reactors.


Key Points

India's first indigenous 700MWe PHWR at Kakrapar reached criticality, advancing NPCIL's Make in India nuclear power.

✅ First indigenous 700MWe PHWR achieves criticality

✅ NPCIL-built, Make in India components and contractors

✅ Advanced safety: passive decay heat removal, containment spray


Unit 3 of India’s Kakrapar nuclear plant in Gujarat achieved criticality on 22 July, as milestones at nuclear projects worldwide continue to be reached. It is India’s first indigenously designed 700MWe pressurised heavy water reactor (PHWR) to achieve this milestone.

Prime Minister Narendra Modi congratulated nuclear scientists, saying the reactor is a shining example of the 'Make in India' campaign and of the government's steps to get nuclear back on track in recent years, and a trailblazer for many such future achievements. 

India developed its own nuclear power generation technology as it faced sanctions from the international community following its first nuclear weapons test in in 1974. It has not signed the Nuclear Non-Proliferation Treaty, while China's nuclear energy development is on a steady track according to experts. India has developed a three-stage nuclear programme based on a closed-fuel cycle, where the used fuel of one stage is reprocessed to produce fuel for the next stage.

Kakrapar 3 was developed and is operated by state-owned Nuclear Power Corporation of India Ltd (NPCIL), while in Europe KHNP considered for a Bulgarian project as countries weigh options. The first two units are 220MWe PHWRs commissioned in 1993 and 1995. NPCIL said in a statement that the components and equipment for Kakrapur 3 were “manufactured by lndian industries and the construction and erection was undertaken by various lndian contractors”.

The 700MWe PHWRs have advanced safety features such as steel lined inner containment, a passive decay heat removal system, a containment spray system, hydrogen management systems etc, the statement added.

Fuel loading was completed by mid-March, a crucial step in Abu Dhabi during its commissioning as well. “Thereafter, many tests and procedures were carried out during the lockdown period following all COVlD-19 guidelines.”

“As a next step, various experiments / tests will be conducted and power will be increased progressively, a path also followed by Barakah Unit 1 reaching 100% power before commercial operations.” Kakrapur 3 will be connected to the western grid and will be India’s 23rd nuclear power reactor.

Kakrapur 3 “is the front runner in a series of 16 indigenous 700MWe PHWRs which have been accorded administrative approval and financial sanction by the government and are at various stages of implementation”. Five similar units are under construction at Kakarapur 4, Rajasthan 7&8 and Gorakhpur1&2.

DAE said in January 2019 that India planned to put 21 new nuclear units with a combined generating capacity of 15,700MWe into operation by 2031, including ten indigenously designed PHWRs, while Bangladesh develops nuclear power with IAEA assistance. 


Related News

View more

Which of the cleaner states imports dirty electricity?

Hourly Electricity Emissions Tracking maps grid balancing areas, embodied emissions, and imports/exports, revealing carbon intensity shifts across PJM, ERCOT, and California ISO, and clarifying renewable energy versus coal impacts on health and climate.


Key Points

An hourly method tracing generation, flows, and embodied emissions to quantify carbon intensity across US balancing areas.

✅ Hourly traces of imports/exports and generation mix

✅ Consumption-based carbon intensity by balancing area

✅ Policy insights for renewables, coal, health costs


In the United States, electricity generation accounts for nearly 30% of our carbon emissions. Some states have responded to that by setting aggressive renewable energy standards; others are hoping to see coal propped up even as its economics get worse. Complicating matters further is the fact that many regional grids are integrated, and as America goes electric the stakes grow, meaning power generated in one location may be exported and used in a different state entirely.

Tracking these electricity exports is critical for understanding how to lower our national carbon emissions. In addition, power from a dirty source like coal has health and environment impacts where it's produced, and the costs of these aren't always paid by the parties using the electricity. Unfortunately, getting reliable figures on how electricity is produced and where it's used is challenging, even for consumers trying to find where their electricity comes from in the first place, leaving some of the best estimates with a time resolution of only a month.

Now, three Stanford researchers—Jacques A. de Chalendar, John Taggart, and Sally M. Benson—have greatly improved on that standard, and they have managed to track power generation and use on an hourly basis. The researchers found that, of the 66 grid balancing areas within the United States, only three have carbon emissions equivalent to our national average, and they have found that imports and exports of electricity have both seasonal and daily changes. de Chalendar et al. discovered that the net results can be substantial, with imported electricity increasing California's emissions/power by 20%.

Hour by hour
To figure out the US energy trading landscape, the researchers obtained 2016 data for grid features called balancing areas. The continental US has 66 of these, providing much better spatial resolution on the data than the larger grid subdivisions. This doesn't cover everything—several balancing areas in Canada and Mexico are tied in to the US grid—and some of these balancing areas are much larger than others. The PJM grid, serving Pennsylvania, New Jersey, and Maryland, for example, is more than twice as large as Texas' ERCOT, in a state that produces and consumes the most electricity in the US.

Despite these limitations, it's possible to get hourly figures on how much electricity was generated, what was used to produce it, and whether it was used locally or exported to another balancing area. Information on the generating sources allowed the researchers to attach an emissions figure to each unit of electricity produced. Coal, for example, produces double the emissions of natural gas, which in turn produces more than an order of magnitude more carbon dioxide than the manufacturing of solar, wind, or hydro facilities. These figures were turned into what the authors call "embodied emissions" that can be traced to where they're eventually used.

Similar figures were also generated for sulfur dioxide and nitrogen oxides. Released by the burning of fossil fuels, these can both influence the global climate and produce local health problems.

Huge variation
The results were striking. "The consumption-based carbon intensity of electricity varies by almost an order of magnitude across the different regions in the US electricity system," the authors conclude. The low is the Bonneville Power grid region, which is largely supplied by hydropower; it has typical emissions below 100kg of carbon dioxide per megawatt-hour. The highest emissions come in the Ohio Valley Electric region, where emissions clear 900kg/MW-hr. Only three regional grids match the overall grid emissions intensity, although that includes the very large PJM (where capacity auction payouts recently fell), ERCOT, and Southern Co balancing areas.

Most of the low-emissions power that's exported comes from the Pacific Northwest's abundant hydropower, while the Rocky Mountains area exports electricity with the highest associated emissions. That leads to some striking asymmetries. Local generation in the hydro-rich Idaho Power Company has embodied emissions of only 71kg/MW-hr, while its imports, coming primarily from Rocky Mountain states, have a carbon content of 625kg/MW-hr.

The reliance on hydropower also makes the asymmetry seasonal. Local generation is highest in the spring as snow melts, but imports become a larger source outside this time of year. As solar and wind can also have pronounced seasonal shifts, similar changes will likely be seen as these become larger contributors to many of these regional grids. Similar things occur daily, as both demand and solar production (and, to a lesser extent, wind) have distinct daily profiles.

The Golden State
California's CISO provides another instructive case. Imports represent less than 30% of its total electric use in 2016, yet California electricity imports provided 40% of its embodied emissions. Some of these, however, come internally from California, provided by the Los Angeles Department of Water and Power. The state itself, however, has only had limited tracking of imported emissions, lumping many of its sources as "other," and has been exporting its energy policies to Western states in ways that shape regional markets.

Overall, the 2016 inventory provides a narrow picture of the US grid, as plenty of trends are rapidly changing our country's emissions profile, including the rise of renewables and the widespread adoption of efficiency measures and other utility trends in 2017 that continue to evolve. The method developed here can, however, allow for annual updates, providing us with a much better picture of trends. That could be quite valuable to track things like how the rapid rise in solar power is altering the daily production of clean power.

More significantly, it provides a basis for more informed policymaking. States that wish to promote low-emissions power can use the information here to either alter the source of their imports or to encourage the sites where they're produced to adopt more renewable power. And those states that are exporting electricity produced primarily through fossil fuels could ensure that the locations where the power is used pay a price that includes the health costs of its production.


Related News

View more

COVID-19 pandemic zaps electricity usage in Ontario as people stay home

Ontario Electricity Demand 2020 shows a rare decline amid COVID-19, with higher residential peak load, lower commercial usage, hot-weather air conditioning, nuclear baseload constraints, and smart meter data shaping grid operations and forecasting.


Key Points

It refers to 2020 power use in Ontario: overall demand fell, while residential peaks rose and commercial loads dropped.

✅ Peak load shifted to homes; commercial usage declined.

✅ Hot summers raised peaks; overall annual demand still fell.

✅ Smart meters aid forecasting; grid must balance nuclear baseload.


Demand for electricity in Ontario last year fell to levels rarely seen in decades amid shifts in usage patterns caused by pandemic measures, with Ottawa’s electricity consumption dropping notably, new data show.

The decline came despite a hot summer that had people rushing to crank up the air conditioning at home, the province’s power management agency said, even as the government offered electricity relief to families and small businesses.

“We do have this very interesting shift in who’s using the energy,” said Chuck Farmer, senior director of power system planning with the Independent Electricity System Operator.

“Residential users are using more electricity at home than we thought they would and the commercial consumers are using less.”

The onset of the pandemic last March prompted stay-home orders, businesses to close, and a shuttering of live sports, entertainment and dining out. Social distancing and ongoing restrictions, even as the first wave ebbed and some measures eased, nevertheless persisted and kept many people home as summer took hold and morphed into winter, while the province prepared to extend disconnect moratoriums for residential customers.

System operator data show peak electricity demand rose during a hot summer spell to 24,446 megawatts _ the highest since 2013. Overall, however, Ontario electricity demand last year was the second lowest since 1988, the operator said.

In all, Ontario used 132.2 terawatt-hours of power in 2020, a decline of 2.9 per cent from 2019.

With more people at home during the lockdown, winter residential peak demand has climbed 13 per cent above pre-pandemic levels, even as Hydro One made no cut in peak rates for self-isolating customers, while summer peak usage was up 19 per cent.

“The peaks are getting higher than we would normally expect them to be and this was caused by residential customers _ they’re home when you wouldn’t expect them to be home,” Farmer said.

Matching supply and demand _ a key task of the system operator _ is critical to meeting peak usage and ensuring a stable grid, and the operator has contingency plans with some key staff locked down at work sites to maintain operations during COVID-19, because electricity cannot be stored easily. It is also difficult to quickly raise or lower the output from nuclear-powered generators, which account for the bulk of electricity in the province, as demand fluctuates.

READ MORE: Ontario government extends off-peak electricity rates to Feb. 22

Life patterns have long impacted overall usage. For example, demand used to typically climb around 10 p.m. each night as people tuned into national television newscasts. Livestreaming has flattened that bump, while more energy-efficient lighting led to a drop in provincial demand over the holiday season.

The pandemic has now prompted further intra-day shifts in usage. Fewer people are getting up in the morning and powering up at home before powering down and rushing off to work or school. The summer saw more use of air conditioners earlier than normal after-work patterns.

Weather has always been a key driver of demand for power, accounting for example for the record 27,005 megawatts of usage set on a brutally hot Aug. 1, 2006. Similarly, a mild winter and summer led to an overall power usage drop in 2017.

Still, the profound social changes prompted by the COVID-19 pandemic _ and whether some will be permanent _ have complicated demand forecasting.

“Work patterns used to be much more predictable,” the agency said. “The pandemic has now added another element of variability for electricity demand forecasting.”

Some employees sent home to work have returned to their offices and other workplaces, and many others are likely do so once the pandemic recedes. However, some larger companies have indicated that working from home will be long term.

“Companies like Facebook and Shopify have already stated their intention to make work from home a more permanent arrangement,” the operator said. “This is something our near-term forecasters would take into account when preparing for daily operation of the grid.”

Aggregated data from better smart meters, which show power usage throughout the day, is one method of improving forecasting accuracy, the operator said.


Related News

View more

Ireland goes 25 days without using coal to generate electricity

Ireland Coal-Free Electricity Record: EirGrid reports 25 days without coal on the all-island grid, as wind power, renewables, and natural gas dominated generation, cutting CO2 emissions, with Moneypoint sidelined by market competitiveness.


Key Points

It is a 25-day period when the grid used no coal, relying on gas and renewables to reduce CO2 emissions.

✅ 25 days coal-free between April 11 and May 7

✅ Gas 60%, renewables 30% of generation mix

✅ Eurostat: 6.8% drop in Ireland's CO2 emissions


The island of Ireland has gone a record length of time without using coal-fired electricity generation on its power system, Britain's week-long coal-free run providing a recent comparator, Eirgrid has confirmed.

The all-island grid operated without coal between April 11th and May 7th – a total of 25 days, it confirmed. This is the longest period of time the grid has operated without coal since the all-island electricity market was introduced in 2007, echoing Britain's record coal-free stretch seen recently.

Ireland’s largest generating station, Moneypoint in Co Clare, uses coal, with recent price spikes in Ireland fueling concerns about dispatchable capacity, as do some of the larger generation sites in Northern Ireland.

The analysis coincides with the European statistics agency, Eurostat publishing figures showing annual CO2 emissions in Ireland fell by 6.8 per cent last year; partly due to technical problems at Moneypoint.

Over the 25-day period, gas made up 60 per cent of the fuel mix, while renewable energy, mainly wind, accounted for 30 per cent, echoing UK wind surpassing coal in 2016 across the market. Coal-fired generation was available during this period but was not as competitive as other methods.

EirGrid group chief executive Mark Foley said this was “a really positive development” as coal was the most carbon intense of all electricity sources, with its share hitting record lows in the UK in recent years.

“We are acutely aware of the challenges facing the island in terms of meeting our greenhouse gas emission targets, mindful that low-carbon generation stalled in the UK in 2019, through the deployment of more renewable energy on the grid,” he added.

Last year 33 per cent of the island’s electricity came from renewable energy sources, German renewables surpassing coal and nuclear offering a parallel milestone, a new record. Coal accounted for 9 per cent of electricity generation, down from 12.9 per cent in 2017.


Related News

View more

Philippines Reaffirms Clean Energy Commitment at APEC Summit

Philippines Clean Energy Commitment underscores APEC-aligned renewables, energy transition, and climate resilience, backed by policy incentives, streamlined regulation, technology transfer, and public-private investments to boost energy security, jobs, and sustainable growth.


Key Points

It is the nation's pledge to scale renewables and build climate resilience through APEC-aligned energy policy.

✅ Policy incentives, PPPs, and streamlined permits

✅ Grid upgrades, storage, and smart infrastructure

✅ Regional cooperation on tech transfer and capacity building


At the recent Indo-Pacific Economic Cooperation (APEC) Summit, the Philippines reiterated its dedication to advancing clean energy initiatives as part of its sustainable development agenda. This reaffirmation underscores the country's commitment to mitigating climate change impacts, promoting energy security, and fostering economic resilience through renewable energy solutions, with insights from an IRENA study on the power crisis informing policy direction.

Strategic Goals and Initiatives

During the summit, Philippine representatives highlighted strategic goals aimed at enhancing clean energy adoption and sustainability practices. These include expanding renewable energy infrastructure, accelerating energy transition efforts toward 100% renewables targets, and integrating climate resilience into national development plans.

Policy Framework and Regulatory Support

The Philippines has implemented a robust policy framework to support clean energy investments and initiatives. This includes incentives for renewable energy projects, streamlined regulatory processes, and partnerships with international stakeholders, such as ADFD-IRENA funding initiatives, to leverage expertise and resources in advancing sustainable energy solutions.

Role in Regional Cooperation

As an active participant in regional economic cooperation, the Philippines collaborates with APEC member economies to promote knowledge sharing, technology transfer, and capacity building in renewable energy development, as over 30% of global electricity is now generated from renewables, reinforcing the momentum. These partnerships facilitate collective efforts to address energy challenges and achieve mutual sustainability goals.

Economic and Environmental Benefits

Investing in clean energy not only reduces greenhouse gas emissions but also stimulates economic growth and creates job opportunities in the renewable energy sector. The Philippines recognizes the dual benefits of transitioning to cleaner energy sources, with projects like the Aboitiz geothermal financing award illustrating private-sector momentum, contributing to long-term economic stability and environmental stewardship.

Challenges and Opportunities

Despite progress, the Philippines faces challenges such as energy access disparities, infrastructure limitations, and financing constraints in scaling up clean energy projects, amid regional signals like India's solar slowdown and coal resurgence that underscore transition risks. Addressing these challenges requires innovative financing mechanisms, public-private partnerships, and community engagement to ensure inclusive and sustainable development.

Future Outlook

Moving forward, the Philippines aims to accelerate clean energy deployment through strategic investments, technology innovation, and policy coherence, aligning with the U.S. clean energy market trajectory toward majority share to capture emerging opportunities. Embracing renewable energy as a cornerstone of its economic strategy positions the country to attract investments, enhance energy security, and achieve resilience against global energy market fluctuations.

Conclusion

The Philippines' reaffirmation of its commitment to clean energy at the APEC Summit underscores its leadership in promoting sustainable development and addressing climate change challenges. By prioritizing renewable energy investments and fostering regional cooperation, the Philippines aims to build a resilient energy infrastructure that supports economic growth and environmental sustainability. As the country continues to navigate its energy transition journey, collaboration and innovation will be key in realizing a clean energy future that benefits present and future generations.


Related News

View more

International Atomic Energy Agency agency commends China's nuclear security

IAEA Nuclear Security Mission in China reviews regulatory frameworks, physical protection, and compliance at nuclear power plants, endorsing CAEA efforts, IPPAS guidance, and capacity building to strengthen safeguards, risk management, and global cooperation.


Key Points

An IAEA advisory visit assessing China's nuclear security, physical protection, and regulatory frameworks.

✅ Reviews laws, regulations, and physical protection measures

✅ Endorses CAEA, COE, and IPPAS-aligned best practices

✅ Recommends accelerated rulemaking for expanding reactors


The International Atomic Energy Agency commended China's efforts and accomplishments in nuclear security after conducting its first nuclear security advisory mission to the nation, according to the China Atomic Energy Authority.

The two-week International Physical Protection Advisory Service mission, from Aug 28to Saturday, reviewed the legislative and regulatory framework for nuclear security as well as the physical protection of nuclear material and facilities, including worker safety protocols during health emergencies.

An eight-member expert team led by Joseph Sandoval of the United States' Sandia National Laboratories visited Fangjiashan Nuclear Power Plant, part of the Qinshan Nuclear Power Station in Zhejiang province, to examine security arrangements and observe physical protection measures, where recognized safety culture practices can reinforce performance.

The experts also met with officials from several Chinese government bodies involved in nuclear security such as the China Atomic Energy Authority, National Nuclear Safety Administration and Ministry of Public Security.

The international agency has carried out 78 of the protection missions in 48 member states since 1995. This was the first in China, it said.

The China Atomic Energy Authority said on Tuesday that a report by the experts highly approves of the Chinese government's continuous efforts to strengthen nuclear safety, to boost the sustainable development of the nuclear power industry and to help establish a global nuclear security system.

The report identifies the positive roles played by the State Nuclear Security Technology Center and its subsidiary, the Center of Excellence on Nuclear Security, in enhancing China's nuclear security capability and supporting regional and global cooperation in the field, such as bilateral cooperation agreements that advance research and standards, officials at the China Atomic Energy Authority said.

"A strong commitment to nuclear security is a must for any state that uses nuclear power for electricity generation and that is planning to significantly expand this capacity by constructing new power reactors," said Muhammad Khaliq, head of the international agency's nuclear security of materials and facilities section. "China'sexample in applying IAEA nuclear security guidance and using IAEA advisory services demonstrates its strong commitment to nuclear security and its enhancement worldwide."

The report notes that along with the rapid growth of China's nuclear power sector, challenges have emerged when it comes to the country's nuclear security mechanism and management, as highlighted by grid reliability warnings during pandemics in other markets.

It suggests that the Chinese government accelerate the making of laws and regulations to better govern this sector.

Deng Ge, director of the State Nuclear Security Technology Center, said the IAEAmission would help China strengthen its nuclear security since the nation could learn from other countries' successful experience, including on-site staffing measures to maintain critical operations, and find out its weaknesses for rectification.

Deng added that the mission's report can help the international community understand China's contributions to the global nuclear security system and also offer China's best practices to other nations.


Related News

View more

Sign Up for Electricity Forum’s Newsletter

Stay informed with our FREE Newsletter — get the latest news, breakthrough technologies, and expert insights, delivered straight to your inbox.

Electricity Today T&D Magazine Subscribe for FREE

Stay informed with the latest T&D policies and technologies.
  • Timely insights from industry experts
  • Practical solutions T&D engineers
  • Free access to every issue

Download the 2025 Electrical Training Catalog

Explore 50+ live, expert-led electrical training courses –

  • Interactive
  • Flexible
  • CEU-cerified