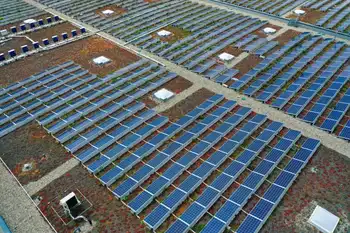
Company sees big breakthrough in solar costs

By East Valley Scottsdale Tribune


Substation Relay Protection Training

Our customized live online or in‑person group training can be delivered to your staff at your location.

  • Live Online
  • 12 hours Instructor-led
  • Group Training Available
Regular Price:
$699
Coupon Price:
$599
Reserve Your Seat Today
First Solar, the Tempe-based producer of photovoltaic solar panels, said it has scored a major breakthrough by reducing the cost of manufacturing its modules to less than $1 per watt.

But utility industry officials say the cost will have to go still lower before photovoltaic technology is cost-competitive with conventionally generated electricity. Solar energy will need government support and subsidies for another five to 10 years, they say.

First Solar uses thin-film technology to convert sunlight into electric current without the need for silicon, a more expensive material used in most photovoltaic cells. Also the company said it is benefitting from mass production techniques as demand soars for its modules.

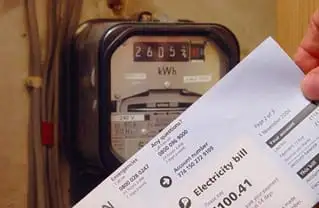
In a statement, the company said it reduced its manufacturing cost for solar modules in the fourth quarter to 98 cents per watt, the first time sub-$1 production has been achieved.

The company has reduced its production costs by two-thirds in four years - from more than $3 a watt in 2004, the company said.

"This achievement marks a milestone in the solar industry's evolution toward providing truly sustainable energy solutions," said Chief Executive Mike Ahearn.

The company plans to continue to ramp up production from the current 500 megawatts to 1 gigawatt - the equivalent of an average-sized nuclear power plant - by the end of this year, he said.

Officials of Arizona utility companies said they were impressed by First Solar's achievements.

"It's exciting stuff," said Steven Gotfried, a spokesman for Arizona Public Service.

But he added that comparing the cost of First Solar's modules in a residential rooftop system with electricity supplied from a conventional fossil-fuel power plant is not straightforward. That's because the solar panels constitute only about one-third of the cost of a residential rooftop system, he said. There are other costs such as converters and wiring that have to be factored into the equation, he said.

And, of course, you have to consider that photovoltaic panels can't produce much electricity at night or on cloudy days.

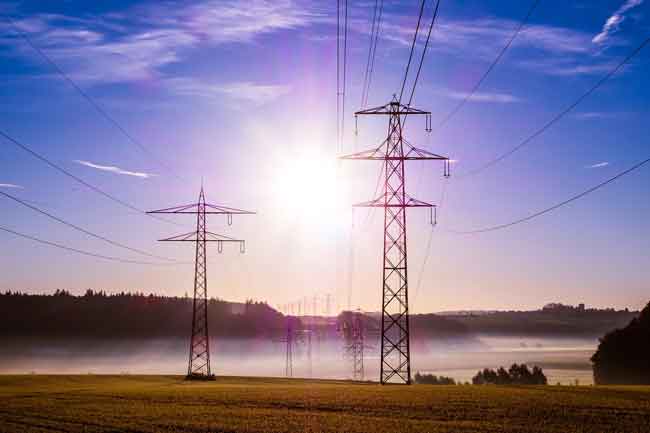
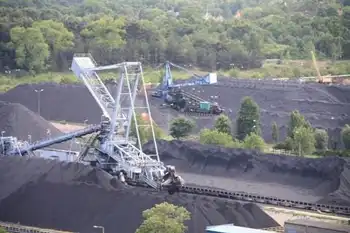
On the other hand, the fuel - sunlight - is free, while conventional power plants require coal, natural gas or nuclear fuel, whose ongoing cost has to be considered.

"It's hard to compare," he said.

Market factors are also playing a major role determining the cost of solar energy, said Chico Hunter, senior engineer for Salt River Project.

Although the cost of making solar panels is declining, the demand is so great that they are selling for pretty much what the market will bear, he said.

"You may produce it for less, but that doesn't mean you sell it for less," he said.

But Hunter applauded First Solar for being so public about its production costs, saying it will put pressure on the retail and installing segments of the industry to reduce end costs to the consumer rather than jack up profits with big markups.

First Solar has been selling most of its modules in Europe, where government subsidies are generous. But the company has started doing business in California, and SRP is negotiating with the company to expand the availability of the technology in Arizona, said Lori Singleton, SRP's manager of sustainability initiatives.

In Arizona, homeowners are eligible for tax credits and utility-company rebates to reduce the cost of installing solar systems. But Singleton said solar technology may catch on faster in places like California, where the price of conventional electricity is higher than here.

First Solar's Ahearn said government subsidies and support from countries like Germany are making it possible to reduce production costs.

"Without forward-looking government programs supporting solar electricity, we would not have been able to invest in the capacity expansion which gives us the scale to bring costs down," he said.

Related News

Starved of electricity, Lebanon picks Dubai's ENOC to swap Iraqi fuel

Lebanon-ENOC Fuel Swap secures Iraqi high sulphur fuel oil, Grade B fuel oil, and gasoil via tender, easing electricity generation shortfalls, diesel shortages, and grid outages amid Lebanon's energy crisis and power sector emergency.


Key Points

A tender-based exchange trading Iraqi HSFO for cleaner fuel oil and gasoil to stabilize Lebanon's electricity generation.

✅ Swaps 84,000t Iraqi HSFO for 30,000t Grade B fuel oil and 33,000t gasoil

✅ Supports state electricity generation during acute power shortages

✅ Tender won by ENOC under Lebanon-Iraq goods-for-fuel deal


Lebanon's energy ministry said it had picked Dubai's ENOC in a tender to swap 84,000 tonnes of Iraqi high sulphur fuel oil, as LNG export authorizations expand globally, with 30,000 tonnes of Grade B fuel oil and 33,000 tonnes of gasoil.

ENOC won the tender, part of a deal between the two countries that allows the cash-strapped Lebanese government, even as electricity tensions persist, to pay for 1 million tonnes of Iraqi heavy fuel oil a year in goods and services.

As Lebanon suffers what the World Bank has described as one of the deepest depressions of modern history, shortages of fuel this month have meant state-powered electricity, alongside ongoing electricity sector reform, has been available for barely a few hours a day if at all.

Residents turning to private generators for their power supply face diesel shortages, even as other countries roll out measures to secure electricity supplies to mitigate risks.

The swap tenders are essential as Iraqi fuel is unsuitable for Lebanese electricity generation, and regional projects like the Jordan-Saudi electricity linkage underscore broader grid strategies.

Lebanese caretaker Energy Minister Raymond Ghajar said in July the fuel from the Iraqi deal would be used for electricity generation by the state provider, even as France advances a new electricity pricing scheme in Europe, and was enough for around four months.

ENOC is set to receive the Iraq fuel between Sept. 3-5 and will deliver it to Lebanon two weeks after, the energy ministry said, following a recent deal on electricity prices abroad that could influence markets.


Related News

View more

How to Get Solar Power on a Rainy Day? Beam It From Space

Space solar power promises wireless energy from orbital solar satellites via microwave or laser power beaming, using photovoltaics and rectennas. NRL and AFRL advances hint at 24-7 renewable power delivery to Earth and airborne drones.


Key Points

Space solar power beams orbital solar energy to Earth via microwaves or lasers, enabling continuous wireless electricity.

✅ Harvests sunlight in orbit and transmits via microwaves or lasers

✅ Provides 24-7 renewable power, independent of weather or night

✅ Enables wireless power for remote sites, grids, and drones


Earlier this year, a small group of spectators gathered in David Taylor Model Basin, the Navy’s cavernous indoor wave pool in Maryland, to watch something they couldn’t see. At each end of the facility there was a 13-foot pole with a small cube perched on top. A powerful infrared laser beam shot out of one of the cubes, striking an array of photovoltaic cells inside the opposite cube. To the naked eye, however, it looked like a whole lot of nothing. The only evidence that anything was happening came from a small coffee maker nearby, which was churning out “laser lattes” using only the power generated by the system as ambitions for cheap abundant electricity gain momentum worldwide.

The laser setup managed to transmit 400 watts of power—enough for several small household appliances—through hundreds of meters of air without moving any mass. The Naval Research Lab, which ran the project, hopes to use the system to send power to drones during flight. But NRL electronics engineer Paul Jaffe has his sights set on an even more ambitious problem: beaming solar power to Earth from space. For decades the idea had been reserved for The Future, but a series of technological breakthroughs and a massive new government research program suggest that faraway day may have finally arrived as interest in space-based solar broadens across industry and government.

Since the idea for space solar power first cropped up in Isaac Asimov’s science fiction in the early 1940s, scientists and engineers have floated dozens of proposals to bring the concept to life, including inflatable solar arrays and robotic self-assembly. But the basic idea is always the same: A giant satellite in orbit harvests energy from the sun and converts it to microwaves or lasers for transmission to Earth, where it is converted into electricity. The sun never sets in space, so a space solar power system could supply renewable power to anywhere on the planet, day or night, as recent tests show we can generate electricity from the night sky as well, rain or shine.

Like fusion energy, space-based solar power seemed doomed to become a technology that was always 30 years away. Technical problems kept cropping up, cost estimates remained stratospheric, and as solar cells became cheaper and more efficient, and storage improved with cheap batteries, the case for space-based solar seemed to be shrinking.

That didn’t stop government research agencies from trying. In 1975, after partnering with the Department of Energy on a series of space solar power feasibility studies, NASA beamed 30 kilowatts of power over a mile using a giant microwave dish. Beamed energy is a crucial aspect of space solar power, but this test remains the most powerful demonstration of the technology to date. “The fact that it’s been almost 45 years since NASA’s demonstration, and it remains the high-water mark, speaks for itself,” Jaffe says. “Space solar wasn’t a national imperative, and so a lot of this technology didn’t meaningfully progress.”

John Mankins, a former physicist at NASA and director of Solar Space Technologies, witnessed how government bureaucracy killed space solar power development firsthand. In the late 1990s, Mankins authored a report for NASA that concluded it was again time to take space solar power seriously and led a project to do design studies on a satellite system. Despite some promising results, the agency ended up abandoning it.

In 2005, Mankins left NASA to work as a consultant, but he couldn’t shake the idea of space solar power. He did some modest space solar power experiments himself and even got a grant from NASA’s Innovative Advanced Concepts program in 2011. The result was SPS-ALPHA, which Mankins called “the first practical solar power satellite.” The idea, says Mankins, was “to build a large solar-powered satellite out of thousands of small pieces.” His modular design brought the cost of hardware down significantly, at least in principle.

Jaffe, who was just starting to work on hardware for space solar power at the Naval Research Lab, got excited about Mankins’ concept. At the time he was developing a “sandwich module” consisting of a small solar panel on one side and a microwave transmitter on the other. His electronic sandwich demonstrated all the elements of an actual space solar power system and, perhaps most important, it was modular. It could work beautifully with something like Mankins' concept, he figured. All they were missing was the financial support to bring the idea from the laboratory into space.

Jaffe invited Mankins to join a small team of researchers entering a Defense Department competition, in which they were planning to pitch a space solar power concept based on SPS-ALPHA. In 2016, the team presented the idea to top Defense officials and ended up winning four out of the seven award categories. Both Jaffe and Mankins described it as a crucial moment for reviving the US government’s interest in space solar power.

They might be right. In October, the Air Force Research Lab announced a $100 million program to develop hardware for a solar power satellite. It’s an important first step toward the first demonstration of space solar power in orbit, and Mankins says it could help solve what he sees as space solar power’s biggest problem: public perception. The technology has always seemed like a pie-in-the-sky idea, and the cost of setting up a solar array on Earth is plummeting, as proposals like a tenfold U.S. solar expansion signal rapid growth; but space solar power has unique benefits, chief among them the availability of solar energy around the clock regardless of the weather or time of day.

It can also provide renewable energy to remote locations, such as forward operating bases for the military, which has deployed its first floating solar array to bolster resilience. And at a time when wildfires have forced the utility PG&E to kill power for thousands of California residents on multiple occasions, having a way to provide renewable energy through the clouds and smoke doesn’t seem like such a bad idea. (Ironically enough, PG&E entered a first-of-its-kind agreement to buy space solar power from a company called Solaren back in 2009; the system was supposed to start operating in 2016 but never came to fruition.)

“If space solar power does work, it is hard to overstate what the geopolitical implications would be,” Jaffe says. “With GPS, we sort of take it for granted that no matter where we are on this planet, we can get precise navigation information. If the same thing could be done for energy, especially as peer-to-peer energy sharing matures, it would be revolutionary.”

Indeed, there seems to be an emerging race to become the first to harness this technology. Earlier this year China announced its intention to become the first country to build a solar power station in space, and for more than a decade Japan has considered the development of a space solar power station to be a national priority. Now that the US military has joined in with a $100 million hardware development program, it may only be a matter of time before there’s a solar farm in the solar system.


Related News

View more

Alberta shift from coal to cleaner energy

Alberta Coal-to-Gas Transition will retire coal units, convert plants to natural gas, boost renewables, and affect electricity prices, with policy tools like a price cap and carbon tax shaping the power market.


Key Points

Shift retiring coal units and converting to natural gas and renewables, targeting coal elimination by 2030.

✅ TransAlta retires Sundance coal unit; more units convert to gas.

✅ Forward prices seen near $40 to low $50/MWh in 2018.

✅ 6.8-cent cap shields consumers; carbon tax backstops costs.


The turn of the calendar to 2018 saw TransAlta retire one of its coal power generating units at its Sundance plant west of Edmonton and mothball another as it begins the transition to cleaner sources of energy across Alberta.

The company will say goodbye to three more units over the next year and a half to prepare them for conversion to natural gas.

This is part of a fundamental shift in Alberta, which will see coal power retired ahead of schedule by 2030, replaced by a mix of natural gas and renewable sources.

“We’re going to see that transition continue right up from now until 2030, and likely beyond 2030 as wind generation starts to outpace coal and new technologies become available.”

Coal has long been the backbone of Alberta’s grid, currently providing nearly 40 per cent of the provinces power. Analysts believe removing it will come with a cost to consumers, according to a report on coal phase-out costs published recently.

“The open question over the next couple of years is whether they’re going to inch up gradually, or whether they’re going to inch up like they did in 2012 and 2013, by having periods of very high power prices.”

Albertans are currently paying historically low power prices, with generation costs last year averaging below $23/MWh, less than half of the average of the past 10 years.

A report released in mid-December by electricity consultant firm EDC Associates showed forward prices moving from the $40/MWh in the first three months of 2018, to the low $50/MWh range.

“The forwards tend to take several weeks to fully react to announcements, so its anticipated that prices will continue to gradually track upwards over the coming weeks,” the report reads.

The NDP government has taken steps to protect consumers against price surges. Last spring, a price cap of 6.8 cents/MWh was put in place until the spring of 2021, with any cost above that to be covered by carbon tax revenue.


Related News

View more

India is now the world’s third-largest electricity producer

India Electricity Production 2017 surged to 1,160 BU, ranking third globally; rising TWh output with 334 GW capacity, strong renewables and thermal mix, 7% CAGR in generation, and growing demand, investments, and FDI inflows.


Key Points

India's 2017 power output reached 1,160 BU, third globally, supported by 334 GW capacity, rising renewables, and 7% CAGR.

✅ 1,160 BU generated; third after China and the US

✅ Installed capacity 334 GW; 65% thermal, rising renewables

✅ Generation CAGR ~7%; demand, FDI, investments rising


India now generates around 1,160.1 billion units of electricity in financial year 2017, up 4.72% from the previous year, and amid surging global electricity demand that is straining power systems. The country is behind only China which produced 6,015 terrawatt hours (TWh. 1 TW = 1,000,000 megawatts) and the US (4,327 TWh), and is ahead of Russia, Japan, Germany, and Canada.


India’s electricity production grew 34% over seven years to 2017, and the country now produces more energy than Japan and Russia, which had 27% and 8.77% more electricity generation capacity installed, respectively, than India seven years ago.

India produced 1,160.10 billion units (BU) of electricity–one BU is enough to power 10 million households (one household using average of about 3 units per day) for a month–in financial year (FY) 2017. Electricity production stood at 1,003.525 BU between April 2017-January 2018, according to a February 2018 report by India Brand Equity Foundation (IBEF), a trust established by the commerce ministry.

#google#

With a production of 1,423 BU in FY 2016, India was the third largest producer and the third largest consumer of electricity in the world, behind China (6,015 BU) and the United States (4,327 BU).

With an annual growth rate of 22.6% capacity addition over a decade to FY 2017, renewables beat other power sources–thermal, hydro and nuclear. Renewables, however, made up only 18.79% of India’s energy, up 68.65% since 2007, and globally, low-emissions sources are expected to cover most demand growth in the coming years. About 65% of installed capacity continues to be thermal.

As of January 2018, India has installed power capacity of 334.4 gigawatt (GW), making it the fifth largest installed capacity in the world after European Union, China, United States and Japan, and with much of the fleet coal-based, imported coal volumes have risen at times amid domestic supply constraints.

The government is targeting capacity addition of around 100 GW–the current power production of United Kingdom–by 2022, as per the IBEF report.


Electricity generation grew at 7% annually

India achieved a 34.48% growth in electricity production by producing 1,160.10 BU in 2017 compared to 771.60 BU in 2010–meaning that in these seven years, electricity production in India grew at a compound annual growth rate (CAGR) of 7.03%, while thermal power plants' PLF has risen recently amid higher demand and lower hydro.


Generation capacity grew at 10% annually

Of 334.5 GW installed capacity as of January 2018–up 60% from 132.30 GW in 2007–thermal installed capacity was 219.81 GW. Hydro and renewable energy installed capacity totaled 44.96 GW and 62.85 GW, respectively, said the report.

The CAGR in installed capacity over a decade to 2017 was 10.57% for thermal power, 22.06% for renewable energy–the fastest among all sources of power–2.51% for hydro power and 5.68% for nuclear power.


Growing demand, higher investments will drive future growth

Growing population and increasing penetration of electricity connections, along with increasing per-capita usage would provide further impetus to the power sector, said the report.

Power consumption is estimated to increase from 1,160.1 BU in 2016 to 1,894.7 BU in 2022, as per the report, though electricity demand fell sharply in one recent period.

Increasing investment remained one of the driving factors of power sector growth in the country.

Power sector has a 100% foreign direct investment (FDI) permit, which boosted FDI inflows in the sector.

Total FDI inflows in the power sector reached $12.97 billion (Rs 83,713 crore) during April 2000 to December 2017, accounting for 3.52% of FDI inflows in India, the report said.


Related News

View more

In a record year for clean energy purchases, Southeast cities stand out

Municipal Renewable Energy Procurement surged as cities contracted 3.7 GW of solar and wind, leveraging green tariffs, community solar, and utility partnerships across the Southeast, led by Houston, RMI, and WRI data.


Key Points

The process by which cities contract solar and wind via utilities or green tariffs to meet climate goals.

✅ 3.7 GW procured in 2020, nearly 25% year-over-year growth

✅ Houston runs city ops on 500 MW solar, a record purchase

✅ Southeast cities use green tariffs and community solar


Cities around the country bought more renewable energy last year than ever before, reflecting how renewables may soon provide one-fourth of U.S. electricity across the grid, with some of the most remarkable projects in the Southeast, according to new data unveiled Thursday.

Even amid the pandemic, about eight dozen municipalities contracted to buy nearly 3.7 gigawatts of mostly solar and wind energy — enough to power more than 800,000 homes. The figure is almost a quarter higher than the year before.

Half of the cites listed as “most noteworthy” in Thursday’s release —  from research groups Rocky Mountain Institute and World Resources Institute — are in the region that stretches from Texas to Washington, D.C. 

Houston stands out for the sheer enormity of its purchase: In July, it began powering city operations entirely from nearly 500 megawatts of solar power — the largest municipal purchase of renewable energy ever in the United States, as renewable electricity surpassed coal nationwide.

The groups also feature smaller deals in North Carolina and Tennessee, achieved through a utility partnership called a green tariff.

“We wanted to recognize that Nashville and Charlotte were really blazing a new trail,” said Stephen Abbott, principal at the Rocky Mountain Institute.

And the nation’s capital shows how renewable energy can be a source of revenue: It’s leasing out its public transit station rooftops for 10 megawatts of community solar.

All of these strategies will be necessary for scores of U.S. cities to meet their ambitious climate goals, researchers believe. An interactive clean energy targets tracker shows all 95 clean energy procurements from the year in detail.


Tracker 
Even before former President Donald Trump promised to remove the United States from the Paris Climate Accord, a lack of federal action on climate left a void that some cities and counties were beginning to fill, as renewables hit a record 28% in a recent month. In 2015, the first year tracked by researchers at the Rocky Mountain Institute and the World Resources Institute, municipalities contracted to buy more than 1 gigawatt of wind, solar and other forms of clean energy. 

But when Trump officially set in motion the withdrawal from the climate agreement, the ranks of municipalities dedicated to 100% clean energy multiplied. Today there are nearly 200 of them. The growth in activity last year reflects, in part, that surge of new pledges.

“It takes a while to get city staff up to speed and understand the options, and create the roadmap and then start executing,” Abbott said. “There is a bit of a lag, but we’re starting to see the impact.”

Even in Houston — one of the earliest to begin procuring renewable energy — there has been a steep learning curve as market forces change and prices drop, including cheaper solar batteries shaping procurement strategies, said Lara Cottingham, Houston’s chief of staff and chief sustainability officer.

No matter how well resourced and educated their staff, cities have to clear a thicket of structural, political and economic challenges to procure renewable energy. Most don’t own their own sources of power. Nearly all face budget constraints. Few have enough land or government rooftops to meet their goals within city limits.

“Cities face a situation where it’s a square peg in a round hole,” Cottingham said.

The hurdles are especially steep in much of the Southeast, where only publicly regulated utilities can sell electricity to retail customers, even large ones such as major cities. That’s where a green tariff regime comes in: Cities can purchase clean energy from a third party, such as a solar company, using the utility as a go-between.

Early last year, Charlotte became the largest city to use such a program, partnering with Duke Energy and two North Carolina solar developers to build a solar farm 50 miles north in Iredell County. At first, the city will pay a premium for the energy, but in the latter half of the 20-year contract, as gas prices rise, it will save money compared to business as usual.

“Over the course of 20 years, it’s projected we would save about $2 million,” Katie Riddle, sustainability analyst with Charlotte, told the Energy News Network last year.

The growing size of projects, innovative partnerships like green tariff programs, and the improving economics all give Abbott hope that renewable energy investments from cities will only grow — even with the Trump presidency over and the country back in the Paris agreement.

And when cities meet their goals for procuring renewable energy for their own operations, they must then turn to an even bigger task: reducing the carbon footprint of every person in their jurisdiction with broader decarbonization strategies and community engagement.

“The city needs to do its part for sure,” said Houston’s Cottingham. “Then we have this challenge of how do we get everyone else to.”


Related News

View more

Which of the cleaner states imports dirty electricity?

Hourly Electricity Emissions Tracking maps grid balancing areas, embodied emissions, and imports/exports, revealing carbon intensity shifts across PJM, ERCOT, and California ISO, and clarifying renewable energy versus coal impacts on health and climate.


Key Points

An hourly method tracing generation, flows, and embodied emissions to quantify carbon intensity across US balancing areas.

✅ Hourly traces of imports/exports and generation mix

✅ Consumption-based carbon intensity by balancing area

✅ Policy insights for renewables, coal, health costs


In the United States, electricity generation accounts for nearly 30% of our carbon emissions. Some states have responded to that by setting aggressive renewable energy standards; others are hoping to see coal propped up even as its economics get worse. Complicating matters further is the fact that many regional grids are integrated, and as America goes electric the stakes grow, meaning power generated in one location may be exported and used in a different state entirely.

Tracking these electricity exports is critical for understanding how to lower our national carbon emissions. In addition, power from a dirty source like coal has health and environment impacts where it's produced, and the costs of these aren't always paid by the parties using the electricity. Unfortunately, getting reliable figures on how electricity is produced and where it's used is challenging, even for consumers trying to find where their electricity comes from in the first place, leaving some of the best estimates with a time resolution of only a month.

Now, three Stanford researchers—Jacques A. de Chalendar, John Taggart, and Sally M. Benson—have greatly improved on that standard, and they have managed to track power generation and use on an hourly basis. The researchers found that, of the 66 grid balancing areas within the United States, only three have carbon emissions equivalent to our national average, and they have found that imports and exports of electricity have both seasonal and daily changes. de Chalendar et al. discovered that the net results can be substantial, with imported electricity increasing California's emissions/power by 20%.

Hour by hour
To figure out the US energy trading landscape, the researchers obtained 2016 data for grid features called balancing areas. The continental US has 66 of these, providing much better spatial resolution on the data than the larger grid subdivisions. This doesn't cover everything—several balancing areas in Canada and Mexico are tied in to the US grid—and some of these balancing areas are much larger than others. The PJM grid, serving Pennsylvania, New Jersey, and Maryland, for example, is more than twice as large as Texas' ERCOT, in a state that produces and consumes the most electricity in the US.

Despite these limitations, it's possible to get hourly figures on how much electricity was generated, what was used to produce it, and whether it was used locally or exported to another balancing area. Information on the generating sources allowed the researchers to attach an emissions figure to each unit of electricity produced. Coal, for example, produces double the emissions of natural gas, which in turn produces more than an order of magnitude more carbon dioxide than the manufacturing of solar, wind, or hydro facilities. These figures were turned into what the authors call "embodied emissions" that can be traced to where they're eventually used.

Similar figures were also generated for sulfur dioxide and nitrogen oxides. Released by the burning of fossil fuels, these can both influence the global climate and produce local health problems.

Huge variation
The results were striking. "The consumption-based carbon intensity of electricity varies by almost an order of magnitude across the different regions in the US electricity system," the authors conclude. The low is the Bonneville Power grid region, which is largely supplied by hydropower; it has typical emissions below 100kg of carbon dioxide per megawatt-hour. The highest emissions come in the Ohio Valley Electric region, where emissions clear 900kg/MW-hr. Only three regional grids match the overall grid emissions intensity, although that includes the very large PJM (where capacity auction payouts recently fell), ERCOT, and Southern Co balancing areas.

Most of the low-emissions power that's exported comes from the Pacific Northwest's abundant hydropower, while the Rocky Mountains area exports electricity with the highest associated emissions. That leads to some striking asymmetries. Local generation in the hydro-rich Idaho Power Company has embodied emissions of only 71kg/MW-hr, while its imports, coming primarily from Rocky Mountain states, have a carbon content of 625kg/MW-hr.

The reliance on hydropower also makes the asymmetry seasonal. Local generation is highest in the spring as snow melts, but imports become a larger source outside this time of year. As solar and wind can also have pronounced seasonal shifts, similar changes will likely be seen as these become larger contributors to many of these regional grids. Similar things occur daily, as both demand and solar production (and, to a lesser extent, wind) have distinct daily profiles.

The Golden State
California's CISO provides another instructive case. Imports represent less than 30% of its total electric use in 2016, yet California electricity imports provided 40% of its embodied emissions. Some of these, however, come internally from California, provided by the Los Angeles Department of Water and Power. The state itself, however, has only had limited tracking of imported emissions, lumping many of its sources as "other," and has been exporting its energy policies to Western states in ways that shape regional markets.

Overall, the 2016 inventory provides a narrow picture of the US grid, as plenty of trends are rapidly changing our country's emissions profile, including the rise of renewables and the widespread adoption of efficiency measures and other utility trends in 2017 that continue to evolve. The method developed here can, however, allow for annual updates, providing us with a much better picture of trends. That could be quite valuable to track things like how the rapid rise in solar power is altering the daily production of clean power.

More significantly, it provides a basis for more informed policymaking. States that wish to promote low-emissions power can use the information here to either alter the source of their imports or to encourage the sites where they're produced to adopt more renewable power. And those states that are exporting electricity produced primarily through fossil fuels could ensure that the locations where the power is used pay a price that includes the health costs of its production.


Related News

View more

Sign Up for Electricity Forum’s Newsletter

Stay informed with our FREE Newsletter — get the latest news, breakthrough technologies, and expert insights, delivered straight to your inbox.

Electricity Today T&D Magazine Subscribe for FREE

Stay informed with the latest T&D policies and technologies.
  • Timely insights from industry experts
  • Practical solutions T&D engineers
  • Free access to every issue

Live Online & In-person Group Training

Advantages To Instructor-Led Training – Instructor-Led Course, Customized Training, Multiple Locations, Economical, CEU Credits, Course Discounts.

Request For Quotation

Whether you would prefer Live Online or In-Person instruction, our electrical training courses can be tailored to meet your company's specific requirements and delivered to your employees in one location or at various locations.